PUBLIC HEALTH WEEKLY REPORT, PHWR
Vol.11 No.7
2018
CONTENTS
CONTENTS
0182
2016년 국내 엔테로바이러스 실험실 표본감시 결과
0188
식이보충제 복용 및 영양소 섭취 현황
0193
주요 감염병 통계
환자감시 : 전수감시, 표본감시
병원체감시 : 인플루엔자 및 호흡기바이러스
급성설사질환, 엔테로바이러스
연구논문, Research article
2016년 국내 엔테로바이러스 실험실
표본감시 결과
Results of laboratory-based enterovirus sentinel surveillance in Korea, 2016
Yoon Youngsil, Lee Yong-Pyo, Kim Jooae, Choi Wooyoung, Kang Chun
Division of Viral Diseases, Center for Laboratory control of Infectious Diseases, KCDC Lee June-Woo, Yoo Jung Sik
Division of Vaccine Research, Center for Infectious Diseases Research, KNIH, KCDC
Background: Human enterovirus (HEV) is the main cause of aseptic meningitis, encephalitis, hand, foot and mouth disease (HFMD) and herpangina. In recent years, enterovirus outbreaks have been frequently associated with some serotypes. This study analyzed the genetic characteristics of enterovirus-associated symptomatic cases in Korea in 2016.
Methodology/Results: A total of 2,379 clinical specimens were collected from patients who were suspected of enterovirus infections in 2016. The detection of HEV was performed by real-time reverse transcription polymerase chain reaction (RT-PCR) and nested RT-PCR, while genotype analysis was evaluated based on VP1 gene expression. The overall HEV-positive rate was 37.2% (884/2,379). Of 884 HEV-positive cases, the most frequently presented genotypes were E18 (61.0%), CB5 (7.3%), CA16 (6.2%), and EV71 (5.2%). The detection rate of enterovirus according to symptoms was 42.5% (338/796) for aseptic meningitis, 64.0% (142/222) for HFMD and herpangina, and 42.6% (43/101) for HFMD with complications.
Conclusion: At present, there are no anti-viral treatments specific to HEV infections. This study may encourage studies for the development for HEV vaccines and therapeutics by providing surveillance data of enterovirus infections.
Keywords: Enterovirus, Sentinel surveillance, Aseptic meningitis, Herpangina, Serotypes
질병관리본부 감염병분석센터 바이러스분석과 윤영실, 이용표, 김주애, 최우영, 강춘* 질병관리본부 국립보건연구원 감염병연구센터 백신연구과 이준우, 유정식
발생되며 주요 증상은 무균성수막염, 뇌염, 수족구병, 포진성구협염
등이다[1, 7]. 주된 감염 경로는 분변-경구 및 호흡기 경로이며,
매개물(fomites)을 통한 전파도 가능하다. 최근에는 모계에서
신생아에게로 출생 전후기(perinatal period) 수직감염도 가능한
것으로 보고되었다[3]. 주요 발생 국가는 우리나라를 포함한 중국,
일본, 대만 등 서태평양 지역 국가로 알려져 있다[4].
엔테로바이러스에 감염되면 특유의 발진이 나타나며 열이
없거나 미열이 동반될 수 있다. 대부분 가벼운 임상증상을 보이며,
발진은 발병 약 1주일 후에 소실된다. 잠복기는 3~6일 정도이며,
감염 후 호흡기에서 1~3주, 분변에서는 7~11주까지도 바이러스가
배출된다고 알려져 있다. 엔테로바이러스 중 콕사키바이러스 A16과
엔테로바이러스 71에 의한 감염이 다수 보고되고 있다[4-6]. 특히,
들어가는 말
최근 10년간 국내에서 엔테로바이러스(Enterovirus)에 의한
인체감염발생이 지속적으로 보고되고, 2009년 5월에는 수족구병
및 신경계 합병증으로 인한 첫 사망사례가 보고됨에 따라 그
해 6월부터 법정 감염병으로 지정되었다. 엔테로바이러스는
피코나바이러스과(Family Picornaviridae)에 속하며, 혈청형에
따라 약 70여 종으로 분류된다. 구조적 특징은 외피가
없고(non-enveloped) 단일 가닥(single-stranded positive sense) RNA
유전자를 갖고 있으며, 캡시드(capsid)는 VP1, VP2, VP3, VP4의
4종의 폴리펩타이드(polypeptide)로 구성되어 있다[1, 2]. 전
세계적으로는 매년 수백만 명의 영유아 및 소아에서 주로 감염이
Enterovirus Sentinel Surveillance
Specimen collection
Transport organization of specimen ·Specimen collection and transport Regional Institutes of Health and Environment
·Diagnosis of enterovirus
·Management of regional clinic system ·Report of diagnosis result
(58 hospitals)
Specimen transport Division of Viral Diseases, KCDC ·Management of Enterovirus Sentinel Surveillance and Regional Institutes of Health and Environment ·Analysis of current situation
·Providing weekly report ·Diagnosis of enterovirus Specimen transport Input data(system) Affilated hospitals ·Clinical diagnosis ·Specimen sampling Results of test Results of test
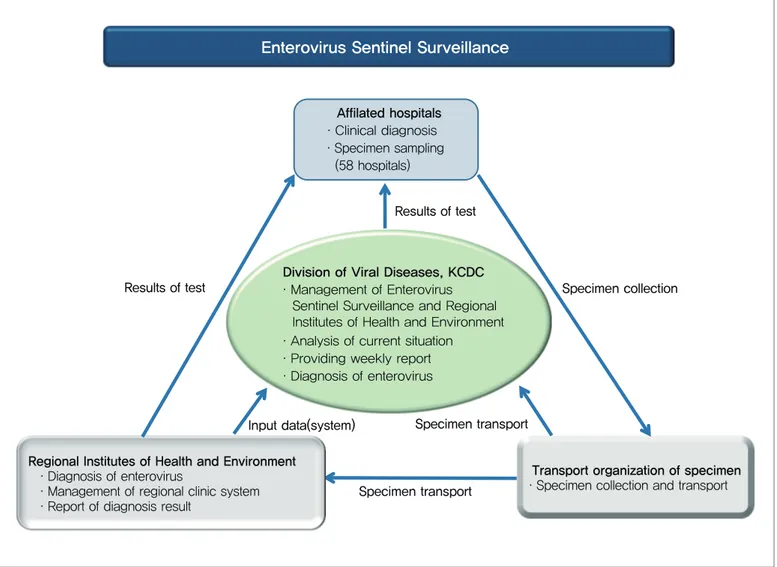
Figure 1. Schematic diagram of enterovirus sentinel surveillance
(%) 0 20 40 60 80 100 0 20 40 60 80 100 120 140 160 180 200 2 6 10 14 18 22 26 30 34 38 42 46 50 53 HEV-positive rate
No. of HEV cases
Week
HEV cases HEV-positive rate
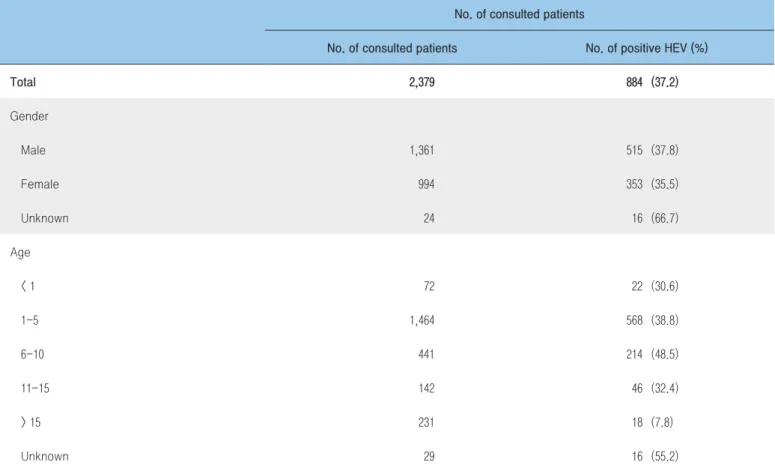
Table 1. Age and sex distribution of human enterovirus (HEV) patients and proportions of enterovirus-positive specimens, 2016
No. of consulted patients
No. of consulted patients No. of positive HEV (%)
Total 2,379 884 (37.2) Gender Male 1,361 515 (37.8) Female 994 353 (35.5) Unknown 24 16 (66.7) Age < 1 72 22 (30.6) 1-5 1,464 568 (38.8) 6-10 441 214 (48.5) 11-15 142 46 (32.4) > 15 231 18 (7.8) Unknown 29 16 (55.2)
엔테로바이러스 71 감염에 의한 수족구병은 영유아에서 높은 비율로
신경계 합병증을 일으키는 것으로 알려져 있고, 경우에 따라서
뇌간 뇌염(brain stem encephalitis), 신경인성 폐부종(neurogenic
pulmonary edema), 폐출혈, 쇼크(shock) 등의 합병증을 동반하며,
이로 인해 사망에 이를 수 있는 것으로 알려져 있다[5, 6]. 현재까지
국내에서 엔테로바이러스에 대한 상용화된 백신이 없기 때문에, 손
씻기 및 소독 등 개인위생 강화에 따른 예방수칙 준수가 필요하다.
질병관리본부 감염병분석센터 바이러스분석과에서는 국내
급성이완성마비환자 및 중증 엔테로바이러스 실험실 표본감시를
수행하고 있다. 이 글은 국내 엔테로바이러스 실험실 표본감시에서
수집한 검체로부터 엔테로바이러스 검출률과 국내 유행주에 대한
특성 분석 결과를 정리하였다.
몸 말
2016년 국내 엔테로바이러스 실험실 표본감시는 질병관리본부
바이러스분석과, 전국 8개 시·도 보건환경연구원, 그리고 58개
의료기관이 협력 네트워크를 구축하여 진행하였다(Figure 1).
엔테로바이러스의 검출은 real-time RT-PCR법과 바이러스
특이적 nested RT-PCR법을 각각 실시하여 한 가지 검사법
이상에서 엔테로바이러스 특이 유전자가 검출되면, 양성으로
판정하였다. Real-time RT-PCR법은 WHO에서 권장하고 있는
Pan_EV primer 및 probe를 사용하며, nested RT-PCR법 보다
민감도가 높고 신속한 진단이 가능한 장점이 있다. Nested
RT-PCR을 수행하여 엔테로바이러스의 구조유전자인 VP1을 검출한
후 염기서열 분석을 통해 바이러스의 유전형을 확인하였다. 유전자
검사를 수행하기 위한 적정 검체는 대변, 인후 도찰물 및 비인후
도찰물, 뇌척수액 등을 전 처리하여 사용하였다. 대변 검체는 2 g당
10 ㎖의 PBS와 1 g의 유리 비드를 첨가 후 왕복식 진탕기(stool
shaker)를 사용하여 진탕하였고 1,500 rpm에서 20분간 원심분리 후
상층액을 취하여 사용하였다. 인후 도찰물(throat swab)은 바이러스
수송 배지(virus transport medium, VTM)에 면봉을 담가 놓은
뒤 소용돌이식 진탕기(vortexing mixer)로 진탕하여 사용하였고
뇌척수액(C S F) 은 전처리 없이 바로 사 용하였다. 전처리된
검체로부터 바이러스의 RNA를 추출하여 앞에서 언급한 두 가지
검사법을 수행하였다.
2016년 수행된 실험실 표본감시에서 의뢰된 검사 건수는
2,379건이며, 그 중 성별로는 남성이 515건으로 여성(353건) 보다
많았으며 양성 검출률도 남성이 37.8%(515건/1361 검체)로 여성
35.5% 보다 높았다. 연령별로는 1~5세가 1,464건, 6~10세가
441건으로 많은 검체가 의뢰되었다. 의뢰된 검체 중 엔테로바이러스
0 20 40 60 80 100 120CA10 CA16 CA2 CA4 CA5 CA6 CA8 CA9 CB3 CB5 E5 E6 E9 E11 E18 E26 E30 EV71
N o. o f ca se s Enterovirus genotypes 316
0 50 100 150 1 5 9 13 17 21 25 29 33 37 41 45 49 53 No. of cases Week
Aseptic meningitis cases
Aseptic meningitis HEV-positive cases
0 10 20 30 40 1 5 9 13 17 21 25 29 33 37 41 45 49 53 No. of cases Week
HFMD and Herpangina cases
0 5 10 15 1 5 9 13 17 21 25 29 33 37 41 45 49 53 No. of cases Week
HFMD with Complications cases
HFMD with Complications HEV-positive cases HFMD and Herpangina HEV-positive cases
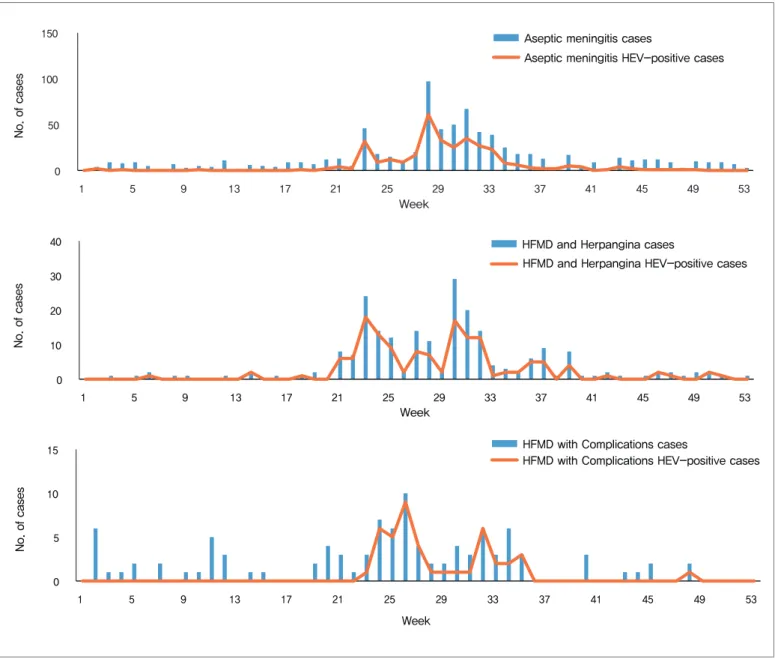
Figure 4. Detection rates of enterovirus by type of disease, 2016
양성 검출 건수는 884건(37.2%)이며 연령대별 양성 검체수는
1~5세가 568건으로 가장 많았으나 양성 검출률은 6~10세에서
48.5%(214건/441 검체)로 가장 높았다(Table 1).
2016년 검출된 엔테로바이러스의 연중 분포를 보면, 늦은
봄에서 가 을인 5~9월 사이에 많이 검출되었으며(93.5%),
6월(23~27주)과 7월(28~31주)에 각각 34.6%, 30.9%로 높은
분포율을 보였다(Figure 2).
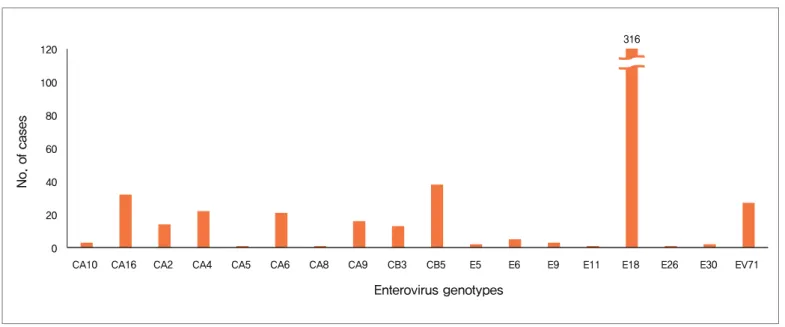
2016년에 검출된 유전형은 총 18종(518건)으로 에코바이러스
18(Echovirus 18) 316건(61.0%), 콕사키바이러스 B5(Coxackievirus
B5) 38건(7.3%), 콕사키바이러스 A16(Coxackievirus A16) 32건 (6.2%)
순으로 높았다(Figure 3).
엔테로바이러스로 인한 임상적 특징은 주로 무균성수막염
(Aseptic meningitis), 수족구병(HFMD) 및 포진성구협염, 합병증을
동반한 수족구병 등인데, 2016년도에는 무균성수막염 증상을
보이는 환자 42.5%(338명)와 수족구병 및 포진성 구협염 증상 환자
64.0%(142명), 합병증을 동반한 수족구병 환자 42.6%(43명)에서
엔테로바이러스가 검출되었다(Figure 4). 이 중 무균성수막염 증상을
보이는 환자에서 에코바이러스 18형이 39.6%(134건), 콕사키바이러스
B5형이 5.6%(19건), 콕사키바이러스 A9형이 2.4%(8건) 검출되었고,
수족구병 및 포진성 구협염 환자에서는 에코바이러스 18형이
18.3%(26건), 콕사키바이러스 16형에서 11.3%(16건), 콕사키바이러스
A6형에서 7.0%(10건) 검출되었다. 그리고 합병증동반 수족구병
환자는 에코바이러스 44.2%(19명), 에코바이러스 6형이 7.0%(3명)
검출되었다.
맺는 말
엔테로바이러스는 유전형이 다양하고 유전자 변이가 자주
나타나기 때문에 유전형 및 염기서열 변화를 지속적으로 감시할
필요가 있다. 본 엔테로바이러스 실험실 표본감시는 2016년
전국 58개 의료기관 및 8개 시·도 보건환경연구원이 활발히
참여하였으며, 전국에서 유행하는 엔테로바이러스 감시를 보다
적극적으로 수행하기 위해 질병관리본부의 실험실감시망과 참여
의료기관의 임상감시망들의 통합을 통해 감시 및 검출대상지역을
확대하고자 한다. 향후 본 감시 사업을 통해 확보한 유행 주기 및
증상별 유전형 분석 결과를 기반으로 국내 유행 엔테로바이러스의
임상적 특징과 유전형 사이의 상관관계를 분석하여 의료 현장에서
활용 가능한 정보를 제공해 나갈 예정이다.
참고문헌
1. Baek, K. A., et al. Molecular and epidemiological characterization of Enteroviruses isolated in Chungnam, Korea from 2005 to 2006. J Microbiol Biotechnol. 2009;19:1055-64.
2. Hyypiäa, T., et al. Classification of Enteroviruses based on molecular and biological properties. K Gen Virol. 1997;78:1-11.
3. Jung, J. S., et al. Vertically transmitted severe Coxsackievirus B infection in four preterm twins presented. Korean J Perinatol. 2013;24(4):315-21.
4. World Health Organization. A guide to clinical management and public health response for hand, foot and mouth disease (HFMD). WHO. 2011.
5. Liu W., et al. Co-circulation and genomic recombination of Coxsackievirus A16 and enterovirus71 during a large outbreak of hand, foot, and mouth disease in Central China. PLos One. 2014;9:e96051.
6. Ooi, M., et al. Clinical features, diagnosis, and management of enterovirus 71. Lancet Neurol. 2010;9:1097-105.
7. Glen R. Abedi., et al. Enterovirus and Human Parechovirus Surveillance-United States, 2009-2013. MMWR. 2015;64:940-3.
연구단신, Brief report
식이보충제 복용 및 영양소 섭취 현황
질병관리본부 질병예방센터 건강영양조사과 윤이나, 양지은, 권상희, 오경원*
*교신저자 : kwoh27@korea.kr, 043-719-7460
Dietary supplement intake based on the Korea National Health and Nutrition
Examination Survey in 2015
Yoon Leena, Yang Jieun, Kweon Sanghui, Oh Kyungwon
Division of Health and Nutrition Survey, Center for Disease Prevention, KCDC
This study was conducted to assess the characteristics of dietary supplement users and to evaluate nutrient intakes from dietary supplements. Using the Korea National Health and Nutrition Examination Survey (KNHANES) IV-3 (2015) raw data, a nutrient composition table for dietary supplements was developed and nutrient intakes from food and dietary supplements was estimated. The nutrients included in the composition table for dietary supplements were calcium, phosphorus, iron, vitamin A, thiamin, riboflavin, niacin, and vitamin C. The proportion of dietary supplement user during the recent one year was 41.8%, which was higher in women, and in those aged 1-5 years or 50 years and over. The most frequently consumed supplements was vitamin and mineral product in all age groups, while the second-most frequently consumed supplements were probiotic products in younger individuals and omega-3 fatty acid products in the older individuals. The intakes of calcium, iron, and vitamin C were 515.6 ㎎, 17.3 ㎎, and 115.0 ㎎, respectively from food, and 574.8 ㎎, 19.9 ㎎, and 476.3 ㎎, respectively from food plus dietary supplement. Although the proportion of subjects with undernutrition was reduced by adding respective dietary supplement use, the proportion of subjects with overnutrition higher than the upper tolerable levels slightly increased.
Keywords: Dietary supplement, Korea National Health and Nutrition Examination Survey, Nutrient intakes, Vitamin and mineral, Omega-3 fatty acid products, Probiotic products
들어가는 말
건강을 유지하고 적절히 성장하기 위한 영양소나 생리활성
물질은 균형 잡힌 식단으로 충분히 섭취할 수 있고 임신부 등 일부
생리적 필요가 있는 대상에 대해서만 식이보충제를 권하는 것이
일반적이다. 그러나 이와 상관없이 많은 사람들이 식이보충제를
섭취하고 있고 이는 여러 나라에서 공통적으로 나타나고 있는
현상이다[1]. 건강에 대한 관심이 높아지면서 국내에서 유통되는
식이보충제의 종류도 다양해지고 판매량 또한 증가하고 있는
추세이며[2], 국민건강영양조사에서도 식이보충제를 1년 내에
복용했다고 응답한 사람이 40%를 넘어서는 것으로 보고하고
있다[3].
국민건강영양조사는 식이보충제 복용 경험 조사를 실시하고
있으며 조사 1일 전 섭취한 식이보충제 제품에 대한 정보, 섭취량,
섭취 시간 및 방법 등 상세한 내용을 조사하고 있다[4]. 또한,
조사현장에서 대상자가 섭취한 식이보충제 실물을 구할 수
있는 경우에는 포장에 적힌 정보를 사진으로 찍어 이에 기초한
식이보충제 데이터베이스(database, DB)를 구축하였다. 조사 1일
전 섭취한 것으로 조사된 식이보충제는 2015년에 조사된 자료를
기준으로 3,106건이었으며 중복 자료를 제외하고 구축된 식이보충제
DB 건수는 1,084건이었다. 식이보충제 DB는 제품명, 제조사,
판매사, 1회 분량, 형태(캡슐, 정제 등), 원료 및 함량, 영양표시 정보,
생리활성물질 등에 대해서 구축하였으며, 영양소는 칼슘, 인, 철,
비타민 A, 티아민, 리보플라빈, 나이아신, 비타민 C 등 8가지가
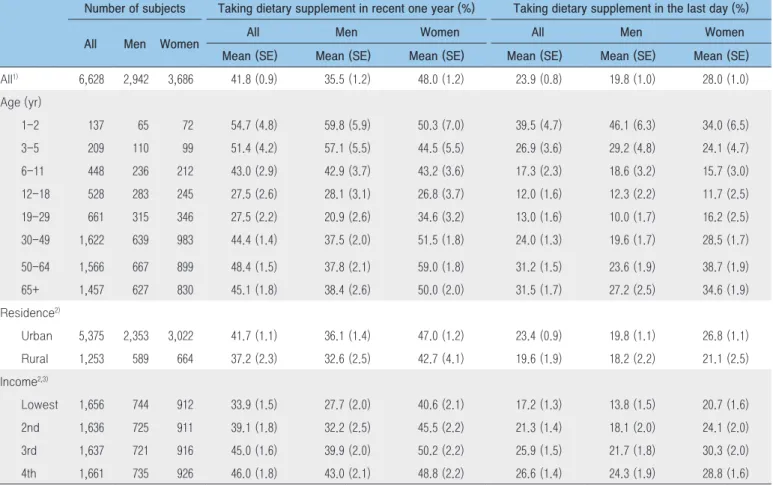
Table 1. Prevalence of subject taking dietary supplement, 2015
Number of subjects Taking dietary supplement in recent one year (%) Taking dietary supplement in the last day (%)
All Men Women All Men Women All Men Women
Mean (SE) Mean (SE) Mean (SE) Mean (SE) Mean (SE) Mean (SE)
All1) 6,628 2,942 3,686 41.8 (0.9) 35.5 (1.2) 48.0 (1.2) 23.9 (0.8) 19.8 (1.0) 28.0 (1.0) Age (yr) 1-2 137 65 72 54.7 (4.8) 59.8 (5.9) 50.3 (7.0) 39.5 (4.7) 46.1 (6.3) 34.0 (6.5) 3-5 209 110 99 51.4 (4.2) 57.1 (5.5) 44.5 (5.5) 26.9 (3.6) 29.2 (4.8) 24.1 (4.7) 6-11 448 236 212 43.0 (2.9) 42.9 (3.7) 43.2 (3.6) 17.3 (2.3) 18.6 (3.2) 15.7 (3.0) 12-18 528 283 245 27.5 (2.6) 28.1 (3.1) 26.8 (3.7) 12.0 (1.6) 12.3 (2.2) 11.7 (2.5) 19-29 661 315 346 27.5 (2.2) 20.9 (2.6) 34.6 (3.2) 13.0 (1.6) 10.0 (1.7) 16.2 (2.5) 30-49 1,622 639 983 44.4 (1.4) 37.5 (2.0) 51.5 (1.8) 24.0 (1.3) 19.6 (1.7) 28.5 (1.7) 50-64 1,566 667 899 48.4 (1.5) 37.8 (2.1) 59.0 (1.8) 31.2 (1.5) 23.6 (1.9) 38.7 (1.9) 65+ 1,457 627 830 45.1 (1.8) 38.4 (2.6) 50.0 (2.0) 31.5 (1.7) 27.2 (2.5) 34.6 (1.9) Residence2) Urban 5,375 2,353 3,022 41.7 (1.1) 36.1 (1.4) 47.0 (1.2) 23.4 (0.9) 19.8 (1.1) 26.8 (1.1) Rural 1,253 589 664 37.2 (2.3) 32.6 (2.5) 42.7 (4.1) 19.6 (1.9) 18.2 (2.2) 21.1 (2.5) Income2,3) Lowest 1,656 744 912 33.9 (1.5) 27.7 (2.0) 40.6 (2.1) 17.2 (1.3) 13.8 (1.5) 20.7 (1.6) 2nd 1,636 725 911 39.1 (1.8) 32.2 (2.5) 45.5 (2.2) 21.3 (1.4) 18.1 (2.0) 24.1 (2.0) 3rd 1,637 721 916 45.0 (1.6) 39.9 (2.0) 50.2 (2.2) 25.9 (1.5) 21.7 (1.8) 30.3 (2.0) 4th 1,661 735 926 46.0 (1.8) 43.0 (2.1) 48.8 (2.2) 26.6 (1.4) 24.3 (1.9) 28.8 (1.6)
1) subject: 1 year old or over, 2015
2) The mean and standard error were calculated using direct standardization method based on ‘05 population projection. 3) Income
- According to the equivalent income of household, subjects were divided into quartile groups within sex and each 5-year age stratum - Equivalent income of household = monthly household income / √No. of a household members
포함되어있다.
이 글에서는 우리나라 국민이 주로 복용하는 식이보충제
종류에 대해서 분석하고 식이보충제를 통해 섭취하는 영양소의 양을
식품으로부터 섭취하는 양과 비교하여 제공하려고 한다.
몸 말
국민건강영양조사 제6기 3차년도(2015) 원시자료를 이용하여
식이보충제 복용 현황 분석을 실시하였다.
최근 1년 내에 식이보충제 복용 경험이 있다고 응답한 분율은
41.8%였으나 조사 전날 섭취했다고 응답한 분율은 23.9%였다.
최근 1년 내에 식이보충제 복용 경험과 조사 전날 섭취했다는 응답
모두에서 남자보다 여자가 높고 1~5세, 50세 이상의 연령군에서
높았다(Table 1).
Ta b l e 2 는 식이 보 충 제 종 류별 섭취 자 수 를 나 타 낸
것으로, 연령과 관계없이 섭취자가 가장 많은 식이보충제는
비타민
·무기질제(52.9%)였으며, 다음으로 오메가-3 지방산 함유
제품, 홍삼제품, 프로바이오틱스제품 등이 상대적으로 많았다.
연령별로는 소아·청소년(1~18세)에서 비타민·무기질 다음으로
프로바이오틱스제품 섭취가 많았으며 19세 이상 성인 연령에서는
오메가-3 지방산 함유 제품 섭취자가 많았다.
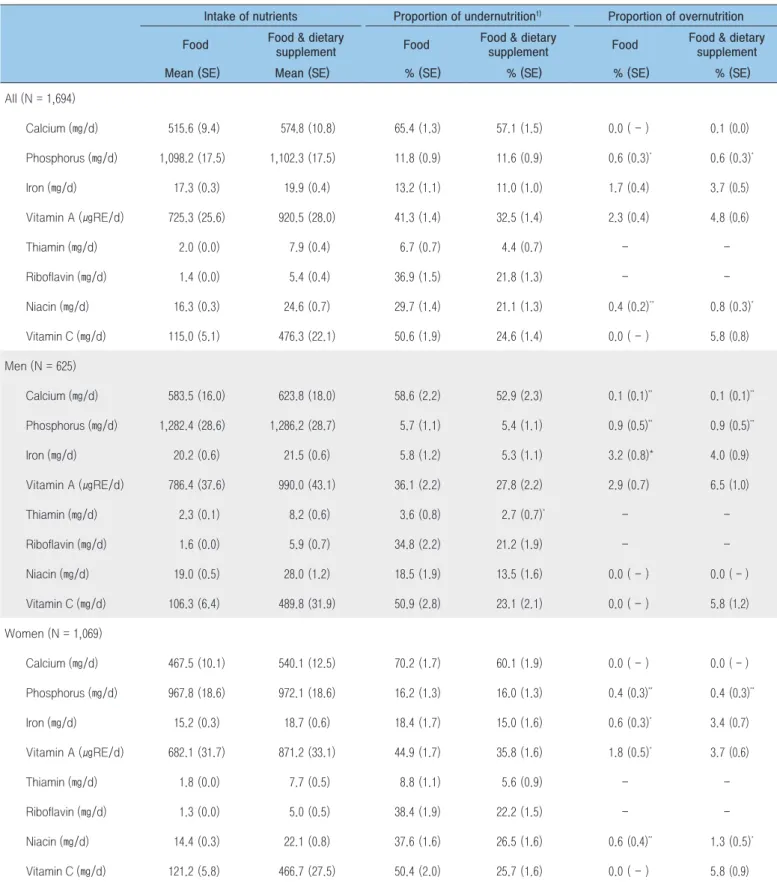
조사 1일 전 식이보충제를 섭취했다고 응답한 1,694명의
자료를 이용하여 영양소 섭취수준을 분석한 결과, 식품으로부터
섭취한 칼슘은 1일 1인 평균 515.6 ㎎이었으나 식이보충제로부터
섭취한 양을 합하면 574.8 ㎎을 섭취하는 것으로 조사되었으며,
철은 17.3 ㎎에서 19.9 ㎎, 비타민 C는 115.0 ㎎에서 476.3 ㎎으로
증가하였다(Table 3). 식이보충제 복용에 따라 섭취량 변화가 큰
영양소는 수용성 비타민 종류였으며, 수용성 비타민은 지용성
비타민이나 무기질에 비해 알려져 있는 독성이 적어 일반적인
비타민
·무기질제에 빠짐없이 포함되는 편이기 때문인 것으로
보인다. 특히 비타민 C는 해당 영양소만 제공하는 식이보충제의
섭취 빈도가 높고 500~1,000 ㎎의 고용량 제품이 많아 합산
시 영향이 가장 큰 것으로 보인다. 반면, 칼슘 및 비타민 A 등
상한섭취량이 정해진 영양소의 경우 이들이 첨가된 식이보충제의
종류도 상대적으로 적었다. 식품으로 섭취하는 영양소 양만을
Table 2. Number and proportion of subjects taking dietary supplement by main ingredient, 2015
All age (n = 2,672) 1-21) (n = 74) 3-5 (n = 77) 6-11 (n = 95) 12-18 (n = 88) 19-29 (n = 120) 30-49 (n = 635) 50-64 (n = 844) 65 year old or over (n = 739) n % n % n % n % n % n % n % n % n %
Vitamin & Mineral 1,413 52.9 33 44.6 37 48.1 61 64.2 57 64.8 77 64.2 363 57.2 425 50.4 360 48.7
Omega-3 fatty acid 350 13.1 3 4.1 4 5.2 6 6.3 5 5.7 10 8.3 59 9.3 131 15.5 132 17.9
Red Ginseng 206 7.7 3 4.1 8 10.4 9 9.5 9 10.2 9 7.5 41 6.5 65 7.7 62 8.4
Probiotics 199 7.4 28 37.8 22 28.6 16 16.8 10 11.4 6 5.0 48 7.6 44 5.2 25 3.4
Lutein 42 1.6 - - - - 2 1.7 10 1.6 16 1.9 14 1.9
Propolis 37 1.4 - - - - 1 0.8 9 1.4 7 0.8 20 2.7
Spirulina 31 1.2 - - - 2 2.3 - 8 1.3 15 1.8 6 0.8
Milk Thistle extract 31 1.2 - - - - 1 0.8 14 2.2 13 1.5 3 0.4
Glucosamin 30 1.1 - - - 3 0.5 11 1.3 16 2.2
Ginkgo leaf extract 25 0.9 - - - 1 0.2 10 1.2 14 1.9
Others 308 11.5 7 9.5 6 7.8 3 3.2 5 5.7 14 11.7 79 12.4 107 12.7 87 11.8
Table 3. Intake of nutrients by food and dietary supplement, 2015
Intake of nutrients Proportion of undernutrition1) Proportion of overnutrition
Food Food & dietary supplement Food Food & dietary supplement Food Food & dietary supplement
Mean (SE) Mean (SE) % (SE) % (SE) % (SE) % (SE)
All (N = 1,694) Calcium (㎎/d) 515.6 (9.4) 574.8 (10.8) 65.4 (1.3) 57.1 (1.5) 0.0 ( - ) 0.1 (0.0) Phosphorus (㎎/d) 1,098.2 (17.5) 1,102.3 (17.5) 11.8 (0.9) 11.6 (0.9) 0.6 (0.3)* 0.6 (0.3)* Iron (㎎/d) 17.3 (0.3) 19.9 (0.4) 13.2 (1.1) 11.0 (1.0) 1.7 (0.4) 3.7 (0.5) Vitamin A (㎍RE/d) 725.3 (25.6) 920.5 (28.0) 41.3 (1.4) 32.5 (1.4) 2.3 (0.4) 4.8 (0.6) Thiamin (㎎/d) 2.0 (0.0) 7.9 (0.4) 6.7 (0.7) 4.4 (0.7) - -Riboflavin (㎎/d) 1.4 (0.0) 5.4 (0.4) 36.9 (1.5) 21.8 (1.3) - -Niacin (㎎/d) 16.3 (0.3) 24.6 (0.7) 29.7 (1.4) 21.1 (1.3) 0.4 (0.2)** 0.8 (0.3)* Vitamin C (㎎/d) 115.0 (5.1) 476.3 (22.1) 50.6 (1.9) 24.6 (1.4) 0.0 ( - ) 5.8 (0.8) Men (N = 625) Calcium (㎎/d) 583.5 (16.0) 623.8 (18.0) 58.6 (2.2) 52.9 (2.3) 0.1 (0.1)** 0.1 (0.1)** Phosphorus (㎎/d) 1,282.4 (28.6) 1,286.2 (28.7) 5.7 (1.1) 5.4 (1.1) 0.9 (0.5)** 0.9 (0.5)** Iron (㎎/d) 20.2 (0.6) 21.5 (0.6) 5.8 (1.2) 5.3 (1.1) 3.2 (0.8)* 4.0 (0.9) Vitamin A (㎍RE/d) 786.4 (37.6) 990.0 (43.1) 36.1 (2.2) 27.8 (2.2) 2.9 (0.7) 6.5 (1.0) Thiamin (㎎/d) 2.3 (0.1) 8.2 (0.6) 3.6 (0.8) 2.7 (0.7)* - -Riboflavin (㎎/d) 1.6 (0.0) 5.9 (0.7) 34.8 (2.2) 21.2 (1.9) - -Niacin (㎎/d) 19.0 (0.5) 28.0 (1.2) 18.5 (1.9) 13.5 (1.6) 0.0 ( - ) 0.0 ( - ) Vitamin C (㎎/d) 106.3 (6.4) 489.8 (31.9) 50.9 (2.8) 23.1 (2.1) 0.0 ( - ) 5.8 (1.2) Women (N = 1,069) Calcium (㎎/d) 467.5 (10.1) 540.1 (12.5) 70.2 (1.7) 60.1 (1.9) 0.0 ( - ) 0.0 ( - ) Phosphorus (㎎/d) 967.8 (18.6) 972.1 (18.6) 16.2 (1.3) 16.0 (1.3) 0.4 (0.3)** 0.4 (0.3)** Iron (㎎/d) 15.2 (0.3) 18.7 (0.6) 18.4 (1.7) 15.0 (1.6) 0.6 (0.3)* 3.4 (0.7) Vitamin A (㎍RE/d) 682.1 (31.7) 871.2 (33.1) 44.9 (1.7) 35.8 (1.6) 1.8 (0.5)* 3.7 (0.6) Thiamin (㎎/d) 1.8 (0.0) 7.7 (0.5) 8.8 (1.1) 5.6 (0.9) - -Riboflavin (㎎/d) 1.3 (0.0) 5.0 (0.5) 38.4 (1.9) 22.2 (1.5) - -Niacin (㎎/d) 14.4 (0.3) 22.1 (0.8) 37.6 (1.6) 26.5 (1.6) 0.6 (0.4)** 1.3 (0.5)* Vitamin C (㎎/d) 121.2 (5.8) 466.7 (27.5) 50.4 (2.0) 25.7 (1.6) 0.0 ( - ) 5.8 (0.9)
1) The proportion of undernutrition means percentage of subjects whose intake of respective nutrient was lower than the estimated average requirements (EAR). The proportion of overnutrition means percentage of subjects whose intake of respective nutrient was equal or higher than the tolerable upper intake level (UL). EAR and UL were from the Dietary Reference Intakes for Koreans, 2015 by the Ministry of Health and Welfare
2) When the proportion is under the 0.05, standard error is not present.
고려했을 때는 비타민 A 섭취가 부족한 분율이 41.3%였던 것에
반해 식이보충제 섭취량까지 고려하면 32.5%로 감소하였으며,
리보플라빈, 비타민 C 등도 상당 수준 감소하였다. 철, 비타민 A,
비타민 C의 상한섭취량 이상 섭취자 분율은 다소 증가하였는데
비타민 C의 경우 식품을 통한 섭취량에 식이보충제를 통한 섭취량을
합산한 경우에만 상한섭취량 이상을 섭취하는 대상자가 있었다.
맺는 말
국민건강영양조사에서 식이보충제는 일상 식사에서 부족한
영양소를 보충하거나 건강증진을 위해 복용하는 제품으로, 비타민,
무기질 및 기능성 원료를 함유한 정제, 캡슐, 분말, 과립, 액상,
환 형태의 제품을 의미하며, 질병 치료를 목적으로 복용하더라도
비타민, 무기질 및 기능성 원료가 함유된 경우에는 식이보충제에
포함하여 조사하고 있다. 식이보충제와 식품으로부터 섭취하는
영양소를 동등하게 비교할 수는 없지만 식이보충제를 복용하는
이유 중에 하나가 식품만으로는 섭취가 부족할 수 있는 영양소를
보충한다는 것이므로 식이보충제 복용을 통해 섭취할 수 있는
영양소 양을 평가하기 위해 식이보충제별 영양성분 DB를 구축하고
이를 통한 섭취량을 산출하였다. 식이보충제를 통한 영양소
섭취량을 식품으로부터의 섭취량에 합산할 경우, 섭취 부족자
분율이 감소하고, 과잉 섭취하는 경우가 증가하였다(Table 3).
이는 1일간의 섭취량으로 평가한 결과이므로 과잉 섭취자 분율이
과대평가될 위험이 크지만 그럼에도 불구하고 대부분의 영양소에서
식이보충제로 인한 과잉 섭취자 분율은 다행히 크게 증가하지
않았다.
식이보충제의 유 통 주기가 짧고 , 한 해 조 사되 고 있 는
식이보충제 1천여 건 중 10명 이상 여러 사람이 복용한 제품은 20여
건에 불과해 제품별 DB를 구축·활용하는 것이 비효율적인 측면이
있다. 또한 식이보충제 중에서 비타민
·무기질제를 복용하는 사람이
많기는 하지만 제품별 영양성분 DB로는 영양소 외의 생리활성물질
보충용 제품의 역할에 대한 평가가 어려워 별도의 분석 방법 마련이
기능성 성분을 주로 고려하여 분류 체계를 마련하고 각 분류별
섭취 빈도, 섭취 특성 등을 분석하는 등 식이보충제 조사 자료를
효율적으로 활용하기 위해 다양한 연구를 시도할 계획이다.
참고문헌
1. Burnett AJ, Livingstone KM, Woods JL, McNaughton SA. Dietary Supplement Use among Australian Adults: Findings from the 2011–2012 National Nutrition and Physical Activity Survey. Nutrients. 2017;9:1248-59.
2. 식품의약처안전처. 2016 식품의약품통계연보 제18호. 2016. 3. 질병관리본부. 2015 국민건강통계. 2016.
4. 질병관리본부. 국민건강영양조사 제6기(2013-2015) 영양조사 지침서. 2015.
Classification of disease‡ Current
week Cum.2018
5-year weekly average
Total no. of cases by year Imported cases of current week : Country (no. of cases) 2017 2016 2015 2014 2013 Category Ⅰ Cholera 0 0 0 5 4 0 0 3
Typhoid fever 14 51 3 128 121 121 251 156 Laos(4) Paratyphoid fever 3 6 1 73 56 44 37 54 Shigellosis 17 86 3 111 113 88 110 294 Vietnam(11), Philippines(2), Laos(1) EHEC 0 8 1 139 104 71 111 61 Viral hepatitis A 74 397 46 4,429 4,679 1,804 1,307 867 Category Ⅱ Pertussis 10 91 2 328 129 205 88 36 Tetanus 0 2 0 34 24 22 23 22 Measles 2 7 1 8 18 7 442 107 Mumps 274 1,410 234 16,922 17,057 23,448 25,286 17,024 Rubella 0 16 0 11 11 11 11 18
Viral hepatitis B (Acute) 8 44 4 393 359 155 173 117 Japanese encephalitis 0 0 0 9 28 40 26 14 Varicella 974 8,662 823 80,074 54,060 46,330 44,450 37,361 Streptococcus pneumoniae 13 139 7 520 441 228 36 -Category Ⅲ Malaria 0 7 2 515 673 699 638 445 Scarlet fever§ 451 2,550 180 22,862 11,911 7,002 5,809 3,678 Meningococcal meningitis 0 1 0 18 6 6 5 6 Legionellosis 5 33 1 196 128 45 30 21 Vibrio vulnificus sepsis 0 0 0 47 56 37 61 56 Murine typhus 0 0 0 20 18 15 9 19
Scrub typhus 17 133 8 10,592 11,105 9,513 8,130 10,365 Indonesia(1) Leptospirosis 0 13 1 133 117 104 58 50 Brucellosis 3 10 0 26 4 5 8 16 Rabies 0 0 0 0 0 0 0 0 HFRS 1 40 4 598 575 384 344 527 Syphilis 33 265 19 2,153 1,569 1,006 1,015 799 CJD/vCJD 5 19 1 68 42 33 65 34 Tuberculosis 621 3,520 560 28,577 30,892 32,181 34,869 36,089 HIV/AIDS 15 67 16 1,005 1,062 1,018 1,081 1,013 Viral hepatitis C 198 1,437 - 6,395 - - - -VRSA 0 0 - 0 - - - -CRE 141 950 - 5,393 - - - -Category Ⅳ
Dengue fever 14 32 4 177 313 255 165 252 Thailand(2), Philippines(2), Laos(2),
Republic of South Africa(1), Taiwan(1), Malaysia(1), Vietnam(1), Indonesia(1), Cambodia(1), Tanzania(1) Unknown(1)
Q fever 11 52 0 126 81 27 8 11
West Nile fever 0 0 0 0 0 0 0 0
Lyme Borreliosis 3 10 0 33 27 9 13 11
Melioidosis 0 0 0 2 4 4 2 2
Chikungunya fever 3 6 0 5 10 2 1 2 Tanzania(1), Thailand(1), Unknown(1)
SFTS 0 0 0 272 165 79 55 36
MERS 0 0 - 0 0 185 -
-Zika virus infection 0 0 - 11 16 - -
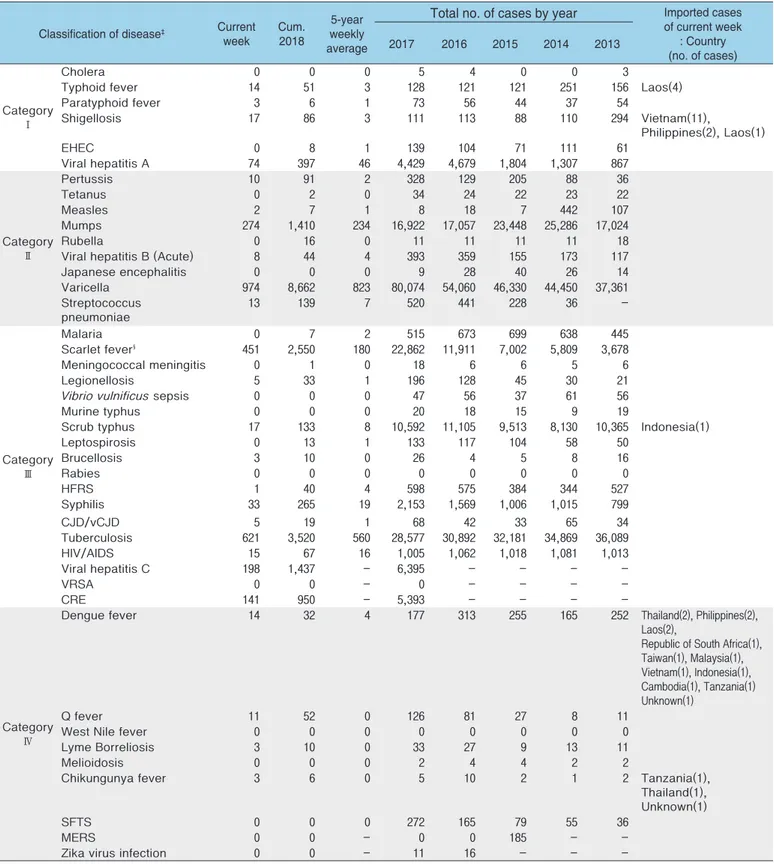
-1.1 환자감시 : 전수감시 감염병 주간 발생 현황
(6th Week)
Table 1. Reported cases of national infectious diseases in Republic of Korea, week ending February 10, 2018 (6th Week)*
Unit: No. of cases†
Abbreviation: EHEC= Enterohemorrhagic Escherichia coli, HFRS= Hemorrhagic fever with renal syndrome, CJD/vCJD= Creutzfeldt-Jacob Disease / variant Creutzfeldt-Jacob Disease, VRSA= Vancomycin-resistant Staphylococcus aureus, CRE= Carbapenem-resistant Enterobacteriaceae, SFTS= Severe fever with thrombocytopenia syndrome, MERS-CoV= Middle East Respiratory Syndrome Coronavirus.
Cum: Cumulative counts from 1st week to current week in a year.
* The reported data for year 2017, 2018 are provisional but the data from 2013 to 2016 are finalized data.
† According to surveillance data, the reported cases may include all of the cases such as confirmed, suspected, and asymptomatic carrier in the group.
Reporting area
Diseases of Category Ⅰ
Cholera Typhoid fever Paratyphoid fever Shigellosis
Current week Cum.2018 Cum. 5-year average§ Current week Cum.2018 Cum. 5-year average§ Current week Cum.2018 Cum. 5-year average§ Current week Cum.2018 Cum. 5-year average§ Overall 0 0 0 14 51 17 3 6 3 17 86 16 Seoul 0 0 0 2 9 3 1 3 0 3 13 2 Busan 0 0 0 3 8 1 1 1 0 0 3 1 Daegu 0 0 0 0 1 0 0 0 0 6 15 0 Incheon 0 0 0 1 5 2 0 0 1 1 6 5 Gwangju 0 0 0 0 0 1 0 0 0 0 2 0 Daejeon 0 0 0 1 2 1 0 0 0 0 2 0 Ulsan 0 0 0 0 3 0 0 0 0 0 0 0 Sejong 0 0 0 0 0 0 0 0 0 0 2 0 Gyonggi 0 0 0 3 7 4 0 0 1 1 11 4 Gangwon 0 0 0 2 5 0 0 0 0 0 3 0 Chungbuk 0 0 0 1 4 0 0 0 0 0 1 0 Chungnam 0 0 0 0 2 1 0 0 0 0 5 1 Jeonbuk 0 0 0 0 0 0 0 0 1 0 10 0 Jeonnam 0 0 0 0 0 1 0 1 0 0 2 2 Gyeongbuk 0 0 0 0 1 1 1 1 0 6 9 1 Gyeongnam 0 0 0 1 4 2 0 0 0 0 2 0 Jeju 0 0 0 0 0 0 0 0 0 0 0 0
Cum: Cumulative counts from 1st week to current week in a year
* The reported data for year 2017, 2018 are provisional but the data from 2013 to 2016 are finalized data.
† According to surveillance data, the reported cases may include all of the cases such as confirmed, suspected, and asymptomatic carrier in the group. § Cum. 5-year average is mean value calculated by cumulative counts from 1st week to current week for 5 preceding years.
Table 2. (Continued) Reported cases of infectious diseases by geograohy, weeks ending February 10, 2018 (6th Week)*
Unit: No. of cases†
Reporting area
Diseases of Category Ⅰ Diseases of Category Ⅱ
Enterohemorrhagic
Escherichia coli Viral hepatitis A Pertussis Tetanus
Current week Cum.2018 Cum. 5-year average§ Current week Cum.2018 Cum. 5-year average§ Current week Cum.2018 Cum. 5-year average§ Current week Cum.2018 Cum. 5-year average§ Overall 0 8 2 74 397 223 10 91 10 0 2 0 Seoul 0 0 1 14 66 41 0 13 3 0 0 0 Busan 0 0 0 0 7 5 1 2 1 0 0 0 Daegu 0 2 0 3 16 5 0 1 0 0 1 0 Incheon 0 0 0 11 32 17 3 12 0 0 0 0 Gwangju 0 1 0 1 4 4 0 2 1 0 0 0 Daejeon 0 0 0 5 21 8 0 0 0 0 0 0 Ulsan 0 0 0 2 7 3 0 0 1 0 0 0 Sejong 0 0 0 0 2 2 0 4 0 0 0 0 Gyonggi 0 2 1 22 114 76 1 43 2 0 0 0 Gangwon 0 1 0 0 6 6 0 0 0 0 0 0 Chungbuk 0 0 0 3 17 10 0 2 0 0 1 0 Chungnam 0 1 0 6 43 12 0 1 0 0 0 0 Jeonbuk 0 0 0 3 31 15 2 4 0 0 0 0 Jeonnam 0 0 0 1 6 6 1 2 0 0 0 0 Gyeongbuk 0 0 0 1 15 4 1 1 1 0 0 0 Gyeongnam 0 1 0 2 10 6 1 4 1 0 0 0 Jeju 0 0 0 0 0 3 0 0 0 0 0 0
Cum: Cumulative counts from 1st week to current week in a year
* The reported data for year 2017, 2018 are provisional but the data from 2013 to 2016 are finalized data.
† According to surveillance data, the reported cases may include all of the cases such as confirmed, suspected, and asymptomatic carrier in the group. § Cum. 5-year average is mean value calculated by cumulative counts from 1st week to current week for 5 preceding years.
Reporting area
Diseases of Category Ⅱ
Measles Mumps Rubella Viral hepatitis B(Acute)
Current week Cum.2018 Cum. 5-year average§ Current week Cum.2018 Cum. 5-year average§ Current week Cum.2018 Cum. 5-year average§ Current week Cum.2018 Cum. 5-year average§ Overall 2 7 0 274 1,410 1,704 0 16 1 8 44 22 Seoul 1 2 0 35 173 166 0 4 0 3 9 3 Busan 0 0 0 15 86 134 0 1 0 0 3 2 Daegu 0 0 0 14 66 45 0 1 0 0 2 0 Incheon 0 0 0 13 79 58 0 0 0 2 3 1 Gwangju 0 0 0 13 43 149 0 0 0 0 1 0 Daejeon 0 1 0 13 47 75 0 1 0 0 1 1 Ulsan 0 0 0 8 52 54 0 0 0 0 2 1 Sejong 0 0 0 0 8 6 0 2 0 0 0 0 Gyonggi 1 3 0 76 360 348 0 0 1 2 9 7 Gangwon 0 1 0 8 51 70 0 2 0 0 1 0 Chungbuk 0 0 0 3 31 29 0 0 0 0 2 1 Chungnam 0 0 0 10 66 56 0 2 0 0 1 1 Jeonbuk 0 0 0 12 54 181 0 2 0 0 0 2 Jeonnam 0 0 0 5 46 96 0 0 0 0 0 1 Gyeongbuk 0 0 0 15 66 56 0 1 0 0 3 1 Gyeongnam 0 0 0 32 157 154 0 0 0 1 7 1 Jeju 0 0 0 2 25 27 0 0 0 0 0 0
Cum: Cumulative counts from 1st week to current week in a year
* The reported data for year 2017, 2018 are provisional but the data from 2013 to 2016 are finalized data.
† According to surveillance data, the reported cases may include all of the cases such as confirmed, suspected, and asymptomatic carrier in the group. § Cum. 5-year average is mean value calculated by cumulative counts from 1st week to current week for 5 preceding years.
Table 2. (Continued) Reported cases of infectious diseases by geography, week ending February 10, 2018 (6th Week)*
Unit: No. of cases†
Reporting area
Diseases of Category Ⅱ Diseases of Category Ⅲ
Japanese encephalitis Varicella Malaria Scarlet fever¶
Current week Cum.2018 Cum. 5-year average§ Current week Cum.2018 Cum. 5-year average§ Current week Cum.2018 Cum. 5-year average§ Current week Cum.2018 Cum. 5-year average§ Overall 0 0 0 974 8,662 6,689 0 7 8 451 2,550 988 Seoul 0 0 0 131 1,180 673 0 2 3 64 368 107 Busan 0 0 0 43 390 448 0 0 0 38 210 74 Daegu 0 0 0 59 471 395 0 0 0 18 83 35 Incheon 0 0 0 60 514 398 0 2 1 18 134 41 Gwangju 0 0 0 37 364 177 0 1 0 16 103 52 Daejeon 0 0 0 19 230 179 0 0 0 13 83 31 Ulsan 0 0 0 43 255 228 0 0 0 32 126 38 Sejong 0 0 0 10 54 35 0 0 0 1 19 2 Gyonggi 0 0 0 260 2,494 1,877 0 1 2 124 657 292 Gangwon 0 0 0 20 221 274 0 0 1 10 47 12 Chungbuk 0 0 0 15 304 133 0 1 1 5 63 18 Chungnam 0 0 0 47 350 306 0 0 0 20 94 49 Jeonbuk 0 0 0 24 298 315 0 0 0 13 107 37 Jeonnam 0 0 0 44 356 311 0 0 0 22 134 37 Gyeongbuk 0 0 0 44 369 272 0 0 0 16 97 65 Gyeongnam 0 0 0 60 491 504 0 0 0 40 193 84 Jeju 0 0 0 58 321 164 0 0 0 1 32 14
Cum: Cumulative counts from 1st week to current week in a year
* The reported data for year 2017, 2018 are provisional but the data from 2013 to 2016 are finalized data.
† According to surveillance data, the reported cases may include all of the cases such as confirmed, suspected, and asymptomatic carrier in the group. § Cum. 5-year average is mean value calculated by cumulative counts from 1st week to current week for 5 preceding years.
Reporting area
Diseases of Category Ⅲ
Meningococcal meningitis Legionellosis Vibrio vulnificus sepsis Murine typhus
Current week Cum.2018 Cum. 5-year average§ Current week Cum.2018 Cum. 5-year average§ Current week Cum.2018 Cum. 5-year average§ Current week Cum.2018 Cum. 5-year average§ Overall 0 1 1 5 33 6 0 0 0 0 0 0 Seoul 0 0 1 1 6 3 0 0 0 0 0 0 Busan 0 0 0 1 4 0 0 0 0 0 0 0 Daegu 0 0 0 0 1 0 0 0 0 0 0 0 Incheon 0 0 0 0 1 1 0 0 0 0 0 0 Gwangju 0 0 0 0 0 0 0 0 0 0 0 0 Daejeon 0 0 0 0 2 0 0 0 0 0 0 0 Ulsan 0 0 0 1 2 1 0 0 0 0 0 0 Sejong 0 0 0 0 0 0 0 0 0 0 0 0 Gyonggi 0 0 0 2 9 1 0 0 0 0 0 0 Gangwon 0 0 0 0 0 0 0 0 0 0 0 0 Chungbuk 0 0 0 0 2 0 0 0 0 0 0 0 Chungnam 0 1 0 0 0 0 0 0 0 0 0 0 Jeonbuk 0 0 0 0 1 0 0 0 0 0 0 0 Jeonnam 0 0 0 0 0 0 0 0 0 0 0 0 Gyeongbuk 0 0 0 0 3 0 0 0 0 0 0 0 Gyeongnam 0 0 0 0 1 0 0 0 0 0 0 0 Jeju 0 0 0 0 1 0 0 0 0 0 0 0
Cum: Cumulative counts from 1st week to current week in a year
* The reported data for year 2017, 2018 are provisional but the data from 2013 to 2016 are finalized data.
† According to surveillance data, the reported cases may include all of the cases such as confirmed, suspected, and asymptomatic carrier in the group. § Cum. 5-year average is mean value calculated by cumulative counts from 1st week to current week for 5 preceding years.
Table 2. (Continued) Reported cases of infectious diseases by geography, week ending February 10, 2018 (6th Week)*
Unit: No. of cases†
Reporting area
Diseases of Category Ⅲ
Scrub typhus Leptospirosis Brucellosis with renal syndromeHemorrhagic fever
Current week Cum.2018 Cum. 5-year average§ Current week Cum.2018 Cum. 5-year average§ Current week Cum.2018 Cum. 5-year average§ Current week Cum.2018 Cum. 5-year average§ Overall 17 133 59 0 13 3 3 10 0 1 40 32 Seoul 2 5 3 0 0 0 1 1 0 0 3 2 Busan 0 1 3 0 0 0 0 0 0 0 0 0 Daegu 0 0 0 0 0 0 0 2 0 0 0 0 Incheon 0 3 1 0 0 0 1 1 0 0 1 1 Gwangju 1 1 1 0 0 0 0 0 0 0 0 0 Daejeon 0 2 3 0 0 0 0 0 0 0 0 1 Ulsan 0 4 2 0 0 0 0 0 0 0 0 0 Sejong 1 1 0 0 0 0 0 0 0 0 0 0 Gyonggi 1 5 8 0 1 1 0 3 0 0 6 13 Gangwon 0 1 2 0 0 0 0 0 0 0 2 3 Chungbuk 0 6 0 0 0 0 0 0 0 0 3 1 Chungnam 2 13 3 0 0 0 1 3 0 0 2 1 Jeonbuk 1 8 5 0 0 1 0 0 0 1 1 3 Jeonnam 5 20 12 0 0 1 0 0 0 0 3 1 Gyeongbuk 0 6 3 0 0 0 0 0 0 0 5 4 Gyeongnam 4 52 11 0 12 0 0 0 0 0 14 2 Jeju 0 5 2 0 0 0 0 0 0 0 0 0
Cum: Cumulative counts from 1st week to current week in a year
* The reported data for year 2017, 2018 are provisional but the data from 2013 to 2016 are finalized data.
† According to surveillance data, the reported cases may include all of the cases such as confirmed, suspected, and asymptomatic carrier in the group. § Cum. 5-year average is mean value calculated by cumulative counts from 1st week to current week for 5 preceding years.
Reporting area
Diseases of Category Ⅲ Diseases of Category Ⅳ
Syphilis CJD/vCJD Tuberculosis Dengue fever
Current week Cum.2018 Cum. 5-year average§ Current week Cum.2018 Cum. 5-year average§ Current week Cum.2018 Cum. 5-year average§ Current week Cum.2018 Cum. 5-year average§ Overall 33 265 114 5 19 5 621 3,520 3,547 14 32 23 Seoul 4 68 23 0 3 1 94 588 724 5 9 8 Busan 2 14 7 0 0 0 52 265 272 1 4 1 Daegu 2 10 5 1 1 0 33 159 181 1 2 2 Incheon 1 20 10 0 0 0 30 171 185 0 1 1 Gwangju 6 13 3 0 0 1 12 72 97 0 0 0 Daejeon 3 12 3 0 1 0 15 78 90 0 1 1 Ulsan 0 2 1 0 0 0 13 81 68 2 2 0 Sejong 0 0 1 0 0 0 2 19 7 0 0 0 Gyonggi 11 62 31 2 6 1 138 774 732 2 7 5 Gangwon 0 8 4 0 0 0 37 172 141 0 0 0 Chungbuk 0 9 3 0 0 0 12 105 104 2 3 0 Chungnam 0 9 3 0 1 1 43 188 141 1 1 1 Jeonbuk 0 2 3 1 2 0 24 142 133 0 0 1 Jeonnam 1 6 3 0 1 0 33 178 165 0 1 0 Gyeongbuk 0 11 5 1 2 1 38 245 241 0 0 1 Gyeongnam 1 9 6 0 2 0 36 231 230 0 0 2 Jeju 2 10 3 0 0 0 9 52 35 0 1 0
Cum: Cumulative counts from 1st week to current week in a year
* The reported data for year 2017, 2018 are provisional but the data from 2013 to 2016 are finalized data.
† According to surveillance data, the reported cases may include all of the cases such as confirmed, suspected, and asymptomatic carrier in the group. § Cum. 5-year average is mean value calculated by cumulative counts from 1st week to current week for 5 preceding years.
Table 2. (Continued) Reported cases of infectious diseases by geography, week ending February 10, 2018 (6th Week)*
Unit: No. of cases†
Reporting area
Diseases of Category Ⅳ
Q fever Lyme Borreliosis SFTS Zika virus infection
Current week Cum.2018 Cum. 5-year average§ Current week Cum.2018 Cum. 5-year average§ Current week Cum.2018 Cum. 3-year average§ Current week Cum.2018 Cum. 3-year average§ Overall 11 52 2 3 10 0 0 0 0 0 0 -Seoul 3 7 0 1 4 0 0 0 0 0 0 -Busan 0 3 0 0 0 0 0 0 0 0 0 -Daegu 0 2 0 0 0 0 0 0 0 0 0 -Incheon 1 1 0 0 0 0 0 0 0 0 0 -Gwangju 0 1 0 0 0 0 0 0 0 0 0 -Daejeon 0 0 0 0 0 0 0 0 0 0 0 -Ulsan 0 2 0 1 2 0 0 0 0 0 0 -Sejong 0 0 0 0 0 0 0 0 0 0 0 -Gyonggi 3 15 0 0 1 0 0 0 0 0 0 -Gangwon 1 1 0 0 1 0 0 0 0 0 0 -Chungbuk 0 4 1 0 1 0 0 0 0 0 0 -Chungnam 2 7 0 1 1 0 0 0 0 0 0 -Jeonbuk 0 0 0 0 0 0 0 0 0 0 0 -Jeonnam 0 0 0 0 0 0 0 0 0 0 0 -Gyeongbuk 1 3 1 0 0 0 0 0 0 0 0 -Gyeongnam 0 6 0 0 0 0 0 0 0 0 0 -Jeju 0 0 0 0 0 0 0 0 0 0 0
-Cum: Cumulative counts from 1st week to current week in a year
* The reported data for year 2017, 2018 are provisional but the data from 2013 to 2016 are finalized data.
† According to surveillance data, the reported cases may include all of the cases such as confirmed, suspected, and asymptomatic carrier in the group. § Cum. 5-year average is mean value calculated by cumulative counts from 1st week to current week for 5 preceding years.
●
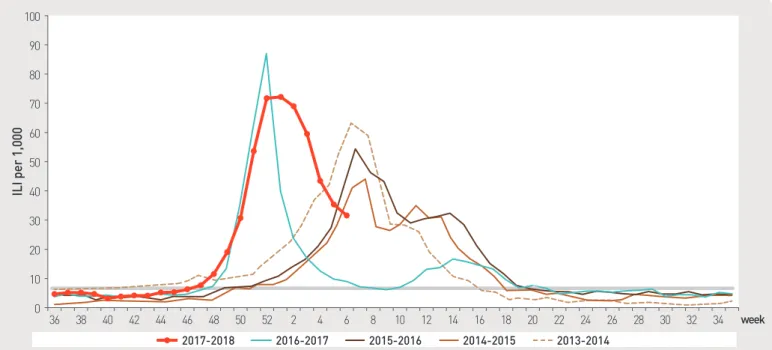
2018년도 제6주 인플루엔자 표본감시(전국 200개 표본감시기관) 결과, 의사환자분율은 외래환자 1,000명당 31.7명으로 지난주(35.3명)대비 감소
※ 2017-2018절기 유행기준은 6.6명(/1,000)
Figure 1. Weekly proportion of influenza-like illness per 1,000 outpatients, 2013-2014 to 2017-2018 flu seasons
0 20 10 40 30 60 70 80 90 50 100 36 38 40 42 44 46 48 50 52 2 4 6 8 10 12 14 16 18 20 22 24 26 28 30 32 34 ILI per 1,000 week 2014-2015 2015-2016 2013-2014 2016-2017 2017-2018
2. Hand, Foot and Mouth Disease(HFMD), Republic of Korea, weeks ending February 10, 2018 (6th week)
●
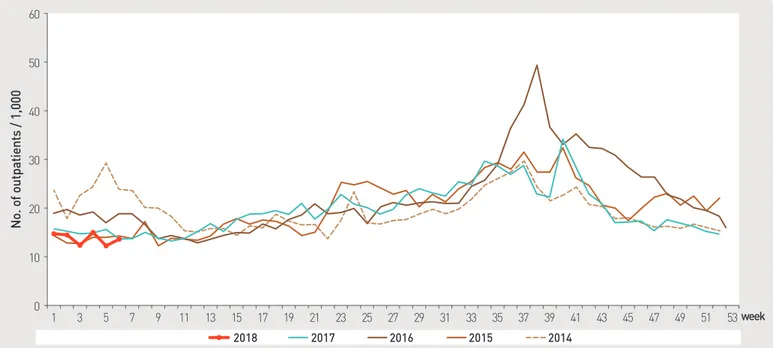
2018년도 제6주차 수족구병 표본감시(전국 95개 의료기관) 결과, 의사환자 분율은 외래환자 1,000명당 0.4명으로 전주(0.6명) 대비 감소
※ 수족구병은 2009년 6월 법정감염병으로 지정되어 표본감시체계로 운영
Figure 2. Weekly proportion of hand, foot and mouth disease per 1,000 outpatients, 2013-2018
1 3 5 7 9 11 13 2017 2018 2016 2015 2014 2013 15 17 19 21 23 25 27 29 31 33 35 37 39 41 43 45 47 49 51 week 0 10.0 5.0 20.0 15.0 30.0 35.0 40.0 45.0 50.0 25.0 55.0 No. of outpatients / 1,000
3. Ophthalmologic infectious disease, Republic of Korea, weeks ending February 10, 2018 (6th week)
●
2018년도 제6주차 유행성각결막염의 표본감시(전국 92개 의료기관) 결과, 외래환자 1,000명당 분율은 13.9명으로 전주 11.9명 대비 증가
●
동기간 급성출혈성결막염의 환자 분율은 0.6명으로 지난주 0.8명 대비 감소
Figure 3. Weekly proportion of epidemic keratoconjunctivitis per 1,000 outpatients
0 10 20 30 40 50 60 1 3 5 7 9 11 13 15 17 19 21 23 25 27 29 31 33 35 37 39 41 43 45 47 49 51 53 No. of outpatients / 1,000 week 2018 2017 2016 2015 2014
Figure 4. Weekly proportion of acute hemorrhagic conjunctivitis per 1,000 outpatients
0 1 2 3 4 5 1 3 5 7 9 11 13 15 17 19 21 23 25 27 29 31 33 35 37 39 41 43 45 47 49 51 53 No. of outpatients / 1,000 week 2018 2017 2016 2015 2014
▣ Waterborne and foodborne disease outbreaks, Republic of Korea, weeks ending February 10, 2018 (6th week)
●
2018년도 제6주 보고기관(전국 254개 보건소)에서 집단발생이 16건 발생하였으며 누적발생건수는 49건(사례수 398명)이 발생함.
1.3 수인성 및 식품매개 감염병 집단발생 주간 현황 (6th week)
▶ 자세히 보기 : 질병관리본부 → 정책/사업 → 감염병감시 → 표본감시주간소식지
Figure 5. Number of waterborne and foodborne disease outbreaks reported by week, 2017-2018
0 5 15 20 25 30 10 1 3 5 7 9 11 13 15 17 19 21 23 25 27 29 31 33 35 37 39 41 43 45 47 49 51 week
2018 2017 Average no. of cases in last 5 years(2012-2016)
35
No. of outbreaks
Unit: No. of cases/sentinels
Cum: Cumulative counts from 1st week to current week in a year
† According to surveillance data, the reported cases may include all of the cases such as confirmed, suspected, and asymptomatic carrier in the group. § Cum. 5-year average is mean value calculated by cumulative counts from 1st week to current week for 5 preceding years.
※ 문의: (043)719-7118, 7132
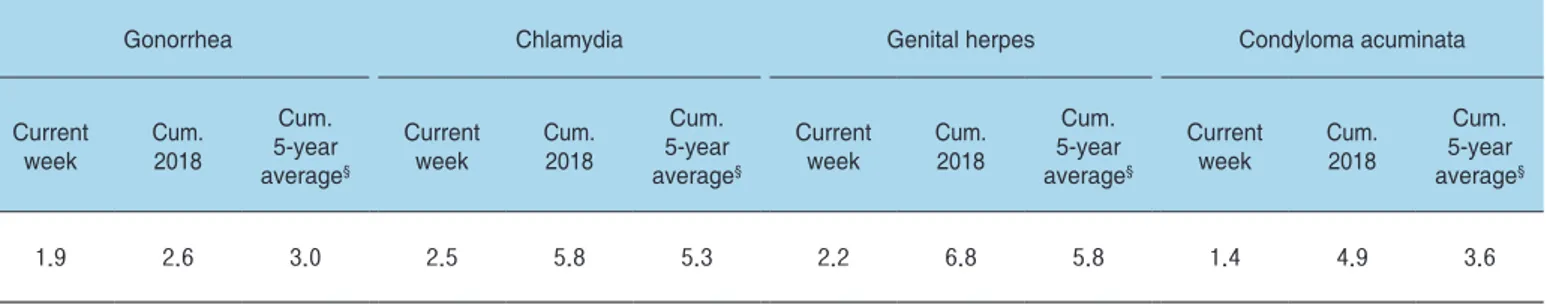
※ 제6주차 신고의료기관 수 : 임질 13개, 클라미디아 48개, 성기단순포진 36개, 첨규콘딜롬 26개
Gonorrhea Chlamydia Genital herpes Condyloma acuminata
Current week Cum.2018 Cum. 5-year average§ Current week Cum.2018 Cum. 5-year average§ Current week Cum.2018 Cum. 5-year average§ Current week Cum.2018 Cum. 5-year average§ 1.9 2.6 3.0 2.5 5.8 5.3 2.2 6.8 5.8 1.4 4.9 3.6
2.1 병원체감시 : 인플루엔자 및 호흡기바이러스 주간 감시 현황
(6th week)
2. Respiratory viruses, Republic of Korea, Weeks ending February 10, 2018 (6th week)
● 2018년도 제6주 호흡기 검체에 대한 유전자 검사(17개 시·도 보건환경연구원 및 전국 52개 참여기관) 결과, 66.4%의 호흡기 바이러스가
검출되었음.
(최근 4주 평균 301개의 호흡기 검체에 대한 유전자 검사결과를 나타내고 있음)
※ 주별통계는 잠정통계이므로 변동가능
- HAdV : human Adenovirus, HPIV : human Parainfluenza virus, HRSV : human Respiratory syncytial virus, IFV : Influenza virus, HCoV : human Coronavirus, HRV : human Rhinovirus, HBoV : human Bocavirus, HMPV : human Metapneumovirus
※ the rate of detected cases between January 14. 2018. – February 10. 2018, (Average No. of detected cases is 301 in last 4 weeks) ∀ 2017 Cum. : the rate of detected cases between January 01. 2017. - December 30. 2017.
Figure 6. Number of specimens positive for influenza by subtype, 2016-2017 to 2017-2018 flu season
0 100 120 140 160 80 60 40 20 0 20.0 10.0 40.0 30.0 60.0 70.0 80.0 90.0 50.0 100.0 120.0
1. Influenza viruses, Republic of Korea, weeks ending February 10, 2018 (6th week)
●
2018년도 제 6주에 전국 52개 감시사업 참여의료기관에서 의뢰된 호흡기검체 292건 중 122건 양성(A/H1N1pdm09 3건, A(H3N2) 49건, B형 70건)
180 200 No. of positives Percent positives (%) weekA(H3N2) A(not subtyped) A(H1N1)pdm09 B Percent positive
34 36373839404142434445464748495051 521 2 3 4 5 6 7 8 9101112131415161718192021222324252627282930313233 35
2018
(week) Weeklytotal
Detection rate (%)
HAdV HPIV HRSV IFV HCoV HRV HBoV HMPV
3 80.2 2.2 1.6 2.2 64.2 6.7 1.9 0.3 1.0 4 75.1 2.3 1.0 4.3 53.8 8.2 3.9 0.3 1.3 5 72.5 5.1 1.0 3.7 49.5 7.5 3.7 0.7 1.4 6 66.4 2.7 1.7 2.4 41.8 9.9 5.8 0.3 1.7 Cum.※ 73.7 3.1 1.3 3.2 52.5 8.0 3.8 0.4 1.3 2017 Cum.∀ 56.6 3.7 6.3 4.6 10.9 4.4 19.4 2.0 5.3
◆ Acute gastroenteritis-causing viruses
Week No. of sample
No. of detection (Detection rate, %)
Group A Rotavirus Norovirus Enteric Adenovirus Astrovirus Total
2018 2 71 10 (14.1) 24 (33.8) 3 (4.2) 1 (1.4) 38 (53.5)
3 63 10 (15.9) 17 (27.0) 1 (1.6) 1 (1.6) 29 (46.0)
4 55 8 (14.5) 11 (20.0) 0 (0.0) 0 (0.0) 19 (34.5)
5 53 13 (24.5) 10 (18.9) 1 (1.9) 0 (0.0) 24 (45.3)
Cum. 306 44 (14.4) 79 (25.8) 8 (2.6) 3 (1.0) 134 (43.8)
* The samples were collected from children ≤5 years of sporadic acute gastroenteritis in Korea.
◆ Acute gastroenteritis-causing bacteria
Week sampleNo. of
No. of isolation (Isolation rate, %) Salmonella spp. Pathogenic E.coli Shigella spp. V.parahaem olyticus V. cholerae Campylobacter
spp. C.perfringens S. aureus B. cereus Total
2018 2 193 1 (0.5) 2 (1.0) 0 (0) 0 (0) 0 (0) 1 (0.5) 4 (2.0) 1 (0.5) 1 (0.5) 10 (5.2) 3 201 0 (0.0) 4 (2.0) 1 (0.5) 0 (0) 0 (0) 3 (1.5) 2 (1.0) 2 (1.0) 0 (0) 12 (6.0) 4 189 1 (0.5) 4 (2.1) 0 (0) 0 (0) 0 (0) 1 (0.5) 4 (2.1) 5 (2.6) 2 (1.1) 17 (9.0) 5 171 6 (3.5) 5 (2.9) 0 (0) 0 (0) 0 (0) 1 (0.6) 2 (1.2) 1 (0.6) 1 (0.6) 16 (9.4) Cum. 893 10 (1.1) 15 (1.7) 1 (0.2) 0 (0) 0 (0) 7 (0.8) 14 (1.6) 11 (1.2) 5 (0.6) 63 (7.1)
* Bacterial Pathogens ; Salmonella spp., E. coli (EHEC, ETEC, EPEC, EIEC), Shigella spp., Vibrio parahaemolyticus, Vibrio cholerae, Campylobacter spp., Clostridium perfringens, Staphylococcus aureus, Bacillus cereus, Listeria monocytogenes, Yersinia enterocolitica.
* Hospital participating in laboratory surveillance in 2018 (70 hospitals)
▶ 자세히 보기 : 질병관리본부 → 알림 → 주간 질병감시정보
(5th week)
● 2018년도 제5주 실험실 표본감시(17개 시·도 보건환경연구원 및 70개 의료기관) 급성설사질환 유발 바이러스 검출 건수는 24건(45.3%), 세균
0 20 40 60 80 1 5 9 13 17 21 25 29 33 37 41 45 49 53 No. of cases week
2.3 병원체감시 : 엔테로바이러스 실험실 주간 감시 현황
(5th week)
▣ Enterovirus, Republic of Korea, weeks ending February 3, 2018 (5th week)
● 2018년도 제5주 실험실 표본감시(8개 시·도 보건환경연구원, 전국 63개 참여병원)결과, 새로 검출된 엔테로바이러스 0건(2018년 누적 3건,
양성률 3.8%)임.
- 무균성수막염 0건(2018년 누적 1건), 수족구병 및 포진성구협염 0건(2018년 누적 1건), 합병증 동반 수족구 0건(2018년 누적 0건), 기타 0건(2018년 누적 1건).
◆ Aseptic meningitis
◆ HFMD and Herpangina
Figure 8. Detection cases of enterovirus in HFMD and herpangina patients from 2017 to 2018
◆ HFMD with Complications
0 5 10 20 15 25 1 5 9 13 17 21 25 29 33 37 41 45 49 53 0 4 3 2 1 5 6 7 8 9 10 1 5 9 13 17 21 25 29 33 37 41 45 49 532018 Enterovirus detection rate 2017 Enterovirus detection rate
Figure 7. Detection cases of enterovirus in aseptic meningitis patients from 2017 to 2018
2017 Enterovirus detection rate 2018 Enterovirus detection rate
2017 Enterovirus detection rate 2018 Enterovirus detection rate
No. of cases
No. of cases
week
신고건수를 나타내며, 2018년 누계 환자수(Cum. 2018)는 2018년 1주부터 해당 주까지의 누계 건수, 그리고 5년 주 평균 환자수(5-year
weekly average)는 지난 5년(2013-2017년) 해당 주의 신고건수와 이전 2주, 이후 2주의 신고건수(총 25주) 평균으로 계산된다. 그러므로
금주 환자수(Current week)와 5년 주 평균 환자수(5-year weekly average)의 신고건수를 비교하면 해당 주 단위 시점과 예년의 신고
수준을 비교해 볼 수 있다. 연도별 환자수(Total no. of cases by year)는 지난 5년간 해당 감염병 현황을 나타내는 확정 통계이며 연도별
현황을 비교해 볼 수 있다.
예) 2018년 12주의 5년 주 평균 환자수(5-year weekly average)는 2013년부터 2017년의 10주부터 14주까지의 신고 건수를 총 25주로 나눈 값으로 구해진다.
* 5년 주 평균 환자수(5-year weekly average)=(X1 + X2 + … + X25)/25
10주 11주 12주 13주 14주 2018년 해당 주 2017년 X1 X2 X3 X4 X5 2016년 X6 X7 X8 X9 X10 2015년 X11 X12 X13 X14 X15 2014년 X16 X17 X18 X19 X20 2013년 X21 X22 X23 X24 X25