저작자표시-비영리-변경금지 2.0 대한민국 이용자는 아래의 조건을 따르는 경우에 한하여 자유롭게 l 이 저작물을 복제, 배포, 전송, 전시, 공연 및 방송할 수 있습니다. 다음과 같은 조건을 따라야 합니다: l 귀하는, 이 저작물의 재이용이나 배포의 경우, 이 저작물에 적용된 이용허락조건 을 명확하게 나타내어야 합니다. l 저작권자로부터 별도의 허가를 받으면 이러한 조건들은 적용되지 않습니다. 저작권법에 따른 이용자의 권리는 위의 내용에 의하여 영향을 받지 않습니다. 이것은 이용허락규약(Legal Code)을 이해하기 쉽게 요약한 것입니다. Disclaimer 저작자표시. 귀하는 원저작자를 표시하여야 합니다. 비영리. 귀하는 이 저작물을 영리 목적으로 이용할 수 없습니다. 변경금지. 귀하는 이 저작물을 개작, 변형 또는 가공할 수 없습니다.
A THESIS
FOR THE DEGREE OF MASTER OF SCIENCE
Anti-melanogenenic and anti-inflammatory effect of
Hibiscus syriacus anthocyanin-rich extracts
WISURUMINI ARACHCHILAGE HASITHA MADURANGA
KARUNARATHNE
Department of Marine Life Sciences
SCHOOL OF BIOMEDICAL SCIENCE
JEJU NATIONAL UNIVERSITY
REPUBLIC OF KOREA
ii
Acknowledgment
I would like to express the deepest appreciation to my supervisor Prof. Gi-Young Kim, who has the attitude and the substance of a genius: he continually and convincingly conveyed a spirit of adventure in regard to research and scholarship, and an excitement in regard to teaching. Without his guidance and persistent help this dissertation would not have been possible.
I extend my deepest thanks to thank my lab member Mr. Neelaka Molagoda who is so kindly guided me in this research by giving generously of his time and supported me throughout this period with his patience and knowledge.
Then, I would like to thank our former lab members specially Dr. Prasad Jayasooriya and Dr. Dilshara Matharage for their encouragement and guidance to success of my research and to be a part of this laboratory associates.
My thanks also go out to the Prof. Barana Jayawardana, my former supervisor who encouraged me to do the higher studies for a better future.
Finally, but not least, my sincere thanks to my parents who are always behind me and wish the success of my life always.
iii
Table of Content
Acknowledgments ... ii
Table of Content ... iii
List of Figures ... vi
List of Tables... viii
PART 01 ... ix
Abstract ... x
1. Introduction ... 1
2. Material and Methods ... 4
2.1 Plant material and sample preparation ... 4
2.2 Regents and antibodies ... 4
2.3 Cell culture and Cell viability assay ... 5
2.4 Flow cytometry Analysis... 5
2.5 In vitro mushroom tyrosinase assay ... 6
2.6 Measurement of extracellular and intracellular melanin content ... 6
2.7 Real-time reverse transcription-polymerase chain reaction (RT-PCR) ... 6
2.8 Western blot analysis ... 7
2.9 Maintenance and phenotype based evaluation of zebrafish ... 8
2.10 Determination of melanogenic inhibitors effects on zebrafish toxicity ... 8
iv
2.12 Statistical Analysis ... 9
3. Results ……….10
3.1 PS and PTS do not alter cell viability at the concentrations used in this study ... 10
3.2 PS and PTS decrease extracellular and intracellular melanin production in B16F10 cells stimulated by α-MSH. ... 12
3.3 PS and PTS does not downregulate mushroom tyrosinase activity ... 14
3.4 PS and PTS inhibits the expression of MITF and tyrosinase in α-MSH-stimulated B16F10 cells ... 15
3.5 PS and PTS inhibit melanin synthesis in zebrafish larvae ... 17
3.6 PS- and PTS-induced ERK phosphorylation regulates MITF expression ... 19
3.7 The ERK signaling pathway regulates melanogenesis in PS- and PTS-treated B16F10 cells and zebrafish larvae ... 21
3.8 Tentative identification of metabolites in PS ... 24
4. Discussion ... 32
5. References... 36
PART 02 ... 41
Abstract ... 42
1. Introduction ... 43
2. Material and Methods ... 45
2.1 Plant material and sample preparation ... 45
v
2.3 Cell culture and MTT assay ... 46
2.4 Flow cytometry analysis... 46
2.5 NO Assay ... 46
2.6 Isolation of total RNA and Reverse transcriptase polymerase chain reactions (RT-PCR) ... 47
2.7 Western blotting assay ... 48
2.8 Enzyme immunosorbent assay (ELISA) ... 48
2.9 Zebrafish maintenance and toxicity evaluation ... 49
2.10 Exposure of LPS by microinjection to zebrafish and Sudan black and Neutral Red staining ... 49
2.11 Statistical analysis ... 50
3. Results ... 50
3.1 Effect of PS on the viability of RAW264.7 macrophage cells ... 50
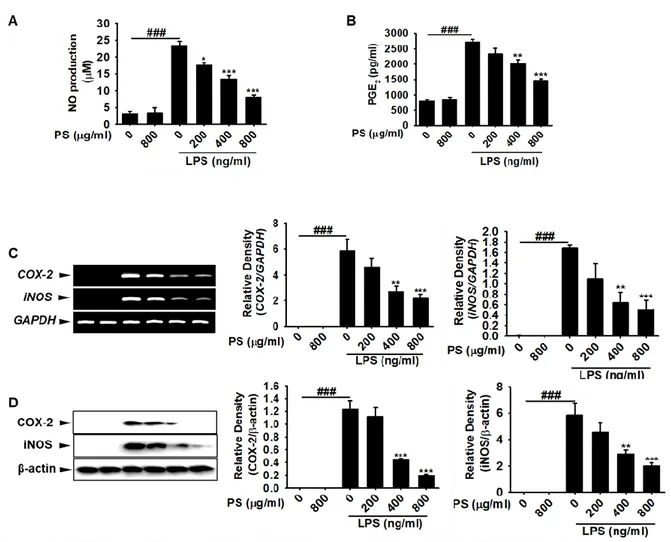
3.2 Effect of PS on iNOS, COX-2 expression and NO, PGE2 Production ... 52
3.3 Effect of PS on LPS-induced TNF-α, IL-6, IL-12 production and mRNA expression ... 54
3.4 Effect of PS on LPS-induced NF-κb nuclear translocation ... 56
3.5 Effect of PS on Morphological changes and toxicity of zebrafish ... 57
3.6 Effect of PS on LPS-induced recruitment of neutrophil and macrophages in zebrafish ... 59
4. Discussion ... 61
vi
List of Figures
Figure 1-1. PS and PTS do not alter cell viability at the concentrations tested.. .... 12 Figure 1-2. PS and PTS decrease extracellular and intracellular melanin production
in α-MSH-stimulated B16F10 cells. ... 13 Figure 1-3. PS and PTS do not downregulate mushroom tyrosinase activity in vitro ... 14 Figure 1-4. PS and PTS inhibit the expression of MITF and tyrosinase in α-MSH-stimulated B16F10 cells.. ... 17 Figure 1-5. PS and PTS inhibit melanin synthesis in zebrafish larvae. ... 19 Figure 1-6. PS and PTS-induced ERK phosphorylation downregulates MITF
expression. ... 21 Figure 1-7. The ERK signaling pathway positively regulates melanogenesis in PS-
and PTS-treated B16F10 cells and zebrafish larvae.. ... 24 Figure 1-8. Comprehensive profile of anthocyanin and flavonoid constituents in PS
and PTS was directly analyzed by UPLC-PDA-QTof-MS
chromatogram. ... 26 Figure 1-9. Common flavonoid glycosides structures. ... 28 Figure 1-10. Molecular docking data. All 17 anthocyanins identified in this study were
directly bound to DUSP7 between two monomers. ... 29 Figure 1-11.The inhibitory mechanism of PS and PTS on α-MSH-stimulated
melanogenesis.. ... 31 Figure 2-1. Effect of PS on the cell viability of RAW 264.7 macrophages.. ... 51 Figure 2-2. Effect of PS on iNOS, COX-2 expression and NO, PGE2 Production. 53
vii
Figure 2-3. Effect of PS on LPS-induced TNF-α, IL-6, IL-12 production and mRNA expression………..55
Figure 2-4. Effect of PS on LPS-induced NF-κb nuclear translocation………56
Figure 2-5. Effect of PS on zebrafish toxicity………58
Figure 2-6. Effect of PS on LPS-induced recruitment of neutrophil and macrophages in zebrafish……….60
viii
List of Tables
Table 1.1. Identification and characterization of metabolites ... 27 Table 1.2. Classification of results gained from the docking of anthocyanins identified
in this study into DUSP7. ... 30 Table 2.1. Zebrafish larval phenotype data………..57
ix
PART 01
Hibiscus syriacus anthocyanin-rich extract inhibits
melanogenesis by activating the ERK signaling
pathway: Molecular docking of the anthocyanins with
x
Abstract
Hibiscus syriacus is the national flower of South Korea and grows in a wide climatic range from mild to tropical temperature. The bark and roots of H. syriacus have been used to cure diarrhea and bacterial infection, and its seed are effective to fever and cold. Recently, native flowers of H. syriacus possesses promising potential as a new edible source and colorants with various anthocyanins. However, the function of anthocyanins isolated from H. syriacus has been determined. In the current study, we, for the first time, evaluated whether H. syriacus varieties, Pulsae and Paetanshim, anthocyanin-rich extract (PS and PTS, respectively) inhibits melanin biogenesis. Our results showed that PS and PTS did not strongly downregulate mushroom tyrosinase activity in vitro; but significantly decreased the extracellular and intracellular melanin production in B16F10 cells accompanied by the inhibition of α-melanocyte-stimulating hormone (α-MSH)-induced microphthalmia-associated transcription factor (MITF) and tyrosinase expression. We also found that PS and PTS attenuated pigmentation in α-MSH-stimulated zebrafish larva without any severe toxicity. Furthermore, PS and PTS activated the phosphorylation of extracellular signal-regulated kinase (ERK) and a specific ERK inhibitor, PD98059, resulted in the recovery of intracellular and extracellular melanin downregulation induced by PS and PTS in B16F10 cells and of melanogenesis in zebrafish larvae. PS and PTS possess 17 specific anthocyanins, which mostly target dual specificity protein phosphastase 7 (DUSP7) according to molecular docking prediction. These findings suggest that anthocyanins from PS and PTS inhibit melanogenesis in vitro and in vivo by activating the ERK signaling pathway.
1
1. Introduction
Melanocytes are melanin-producing neural crest-derived cells located in the basal layer of epidermis of the skin and transfer melanin to adjacent keratinocytes to induce pigmentation [1]. Melanin is not only a dark pigment responsible for skin, eye, and hair color, but also prevents ultraviolet radiation (UV)-induced skin injuries through the absorbance of UV [2]. Therefore, melanin has been thought as a major photoprotective factor by suppressing UV-induced oxidative stress. However, the abnormal accumulation of melanin causes dermatological problems such as melsma, wrinkling, senile lentigines, and skin cancer [3, 4]. In addition, interest in the skin whitening has been amazingly growing in the cosmetic industry. In regards, many anti-melanogenic compounds have been developed targeting tyrosinase which is a major rate-limiting enzyme of the melanin biosynthesis [5, 6].
Melanogenesis is a physiological process which produces melanin regulated by a variety of the molecular signaling pathways with the chain of enzymatic and non-enzymatic reactions. Tyrosinase and tyrosinase related protein-1/2 (TRP-1/2) play a crucial role in increasing melanin generation by hydroxylation of tyrosine into dihydroxyphenylalanine (DOPA) trailed by further oxidation of DOPA into DOPA quinone [7]. Because, tyrosinase is exclusively inevitable for melanogenesis so that tyrosinase has been targeted for the development of melanogenesis inhibitors. In addition, microphthalmia-associated transcription factor (MITF) is a pivotal transcription factor that upregulates the expression of tyrosinase and TRP-1/2 in transcription level under UV exposure, which stimulates melanogenesis [8, 9]. During melanogenesis, α-melanocyte stimulating hormone (α-MSH), which is an endogenous peptide hormone, binds to the melanocortin 1 receptor (MC1R) belonging to the G- protein receptor family in melanocytes which increases the intracellular level of cAMP by activating the adenylyl cyclase (AC) and stimulates protein kinase A (PKA) [10].
2
Then, cAMP responsive element binding protein (CREB) leads to the phosphorylation and upregulates MITF expression [11]. In contrast, previous studies revealed that extracellular signal-regulated kinase (ERK) phosphorylation inhibited melanogenesis by accelerating the proteasomal degradation of MITF accompanied by mitochondrial fission [12, 13]. Therefore, recent researchers have found melanogenesis inhibitors which negatively regulate cAMP-dependent pathway and positively stimulate ERK pathway [5, 6]. Moreover, the Wnt/β-catenin signaling pathway has been studied as a potential regulator of melanogenesis in relation to MITF transcription [14, 15].
Hibiscus syriacus is a Korean national flower called by rose of Sharon and widely distributed from Southern Asia to Northern Asia. H. syriacus has been known as a medicinal herb: the dried root and stem bark of H. syriacus have been used as antidotes, spring tonics, and fever reducers in Korean traditional remedy. Recent studies also revealed that extracts from the bark and rhizosphere of H. syriacus significantly enhanced wound healing activity and protected UV-mediated photoaging in fibroblasts and keratinocytes by stimulating collagen and fibronectin synthesis [16, 17]. Moreover, new medicinal effect of H. syriacus has been elucidated possessing anti-depressant and neuroprotective [18], anti-cancer [19, 20], and anti-oxidant activity [21]. Nevertheless, H. syriacus, especially its petals, has not been studied for the medicinal and functional effect.
In the current study, we, for the first time, investigated the effects of anthocyanin-rich fraction isolated from two different H. syriacus variety, Pulsae and Paetanshim (PS and PTS) with different color of flower petal (Pulsae: purple petal; Paetanshim, white petal) on the regulation of melanogenesis in α-MSH-treated B16F10 cells and zebrafish. Anthocyanin-rich PS and PTS significantly downregulated melanogenesis in B16F10 cells and zebrafish larvae by inhibiting the expression of tyrosinase and MITF. Additionally, both of PT and PTS contained 17 anthocyanins and enhanced ERK
3
phosphorylation, which stimulated melanogenesis. Molecular docking analysis revealed that all anthocyanins fit into dual specific phosphatase 7 (DUSP7) which is a negative regulator of ERK and may inhibit DUSP7, which promoted ERK phosphorylation.
4
2. Material and Methods
2.1 Plant material and sample preparation
H. syriacus Pulsae and Paetanshim were cultivated at farm of Korea Forest Research Institute (Suwon-si, Republic of Korea) and identified by Dr. H.-Y. Kwon (one of author). A voucher specimen of this raw material is deposited in Korea Forest Service (KFS, http://english.forest.go.kr/newkfsweb/eng/idx/Index.do?mn=ENG_01).
The petals of H. syriacus Pulsae and Paektanshim were freeze-dried for 3 days and then stored at below -20°C before extraction. Secondary metabolites were obtained through extraction in accordance with a previously described procedure [19], with slight modification. The petals (1.5 kg) were ground, extracted three times with ethanol (40.0 L) at 10℃ for 48 h, filtered, and then evaporated using a rotary evaporator at below 30℃. The resultant extract was separated by Diaion® HP-20(Mitsubishi Chemical Co., Japan). The anthocyanin-rich fraction was freeze-dried (120 g). The supernatant was filtered through a 0.2 mm polytetrafluoroethylene (PTFE) filter, and then subjected to UPLC-QTOF-MS and biological activity analyses. The extraction solvent was of EP grade, whereas the chromatographic solvents used in the MS experiments were of LC-MS grade (J. T. Baker, Phillipsburg, NJ).
2.2 Regents and antibodies
Dulbecco’s modified Eagle’s medium (DMEM), fetal bovine serum (FBS), and antibiotics mixture were purchased from WELGENE (Gyeongsan-si, Gyeongsangbuk-do, Republic of Korea). Kojic acid, phenylthiourea (PTU) mushroom tyrosinase, 3-(4,5-dimethylthiazol-2-yl)-2,5-diphenyltetrazolium bromide (MTT), α-MSH, and PD98059 were purchased from Sigma-Aldrich Co. (St. Louis, MO). Antibodies against tyrosinase, MITF, ERK, phosphor-ERK (p-ERK), and mouse monoclonal anti-β-actin were obtained from Santa Cruz Biotechnology (Santa Cruz, CA). Peroxidase-labeled
5
anti-rabbit and anti-mouse immunoglobulins were obtained from KOMA BIOTECH (Seoul, Republic of Korea). All other chemicals were purchased from Sigma-Aldrich. Anthocyanin powder of H. sabdariffa from Egypt was purchased from Shin Young Hub (Seoul, Republic of Korea).
2.3 Cell culture and Cell viability assay
Murine B16F10 cells (ATCC, Manassas, VA) were maintained in DMEM supplemented with 10% heat inactivated FBS at 37℃ in a humidified atmosphere of 5% CO2. To analyze the effect of PS and PTS on cell viability, the MTT assay was
performed. Briefly, B16F10 cells were seeded in 24 well plates at a density of 1 × 10⁴
cell/ml, and then incubated for 18 h at 37℃. The cells were then treated with different concentrations (0-800 μg/ml) of PS and PTS for 72 h. After incubation, MTT were added to each well and the plates were further incubated for 4 h at 37℃. The precipitate was dissolved in DMSO and absorbance was measured at 560 nm using a microplate spectrophotometer (Thermo Electron Corporation, Marietta, OH).
2.4 Flow cytometry Analysis
To estimate the total cell count and viability of cell population, flow cytometry analysis (FACS) was carried out based on the viable and non-viable cells differential stained due to their different permeability to the DNA binding dyes. The B16F10 cells were plated at a density of 1 × 10⁴ cell/ml for overnight and treated with the indicated
concentrations (0-800 μg/ml) of PS and PTS for 72 h. In brief, the cells were harvested and washed with ice cold phosphate-buffered saline (PBS). Then, the cells were incubated with Muse® cell count & viability kit (EMD Millipore, Billerica, MA) for 5 min and analyzed according to the manufactures instructions by Muse® cellcycler (EMD Millipore).
6
2.5 In vitro mushroom tyrosinase assay
Tyrosinase inhibition was measured using mushroom tyrosinase in a cell-free system according to a previous method [22] Briefly, 130 µl of 100 mM phosphate buffer (pH 6.8), 20 µl of PS or PTS, 30 µl of 1.5 mM L-tyrosine, and 20 µl of 210
Units/ml mushroom tyrosinase were mixed. The reaction mixture was then incubated for 30 min at 37℃, and absorbance was measured at 490 nm using a microplate spectrophotometer. Kojic acid (25 µM) and PTU (250 nM) were used as positive controls.
2.6 Measurement of extracellular and intracellular melanin content
The effect of PS and PTS on α-MSH-induced melanogenesis was measured according to a previous method [22]. Briefly, B16F10 cells were cultured at 1 × 10⁴
cell/ml in a 6 well plate for 18 h and treated with α-MSH (500 ng/ml) for 24 h. Next, the cells were treated with different concentrations of PS and PTS (0-400 μg/ml) for an additional 72 h. After incubation, extracellular melanin content in the culture media was measured. Briefly, the cells were washed in ice-cold PBS and dissolved in 1 M NaOH containing 10% DMSO at 100℃ for 10 min, and then absorbance was measured at 405 nm to obtain the melanin content
2.7 Real-time reverse transcription-polymerase chain reaction (RT-PCR)
B16F10 cells were seeded at 1 × 10⁴ cell/ml in a 6 well plate for 18 h at 37℃. Next,
the cells were pretreated with the α-MSH (500 ng/ml) for 24 h prior to treatment with different concentration of PS and PTS (0-400 μg/ml). Total RNA was extracted using an easy-BLUE™ total RNA extraction kit (iNtRON Biotechnology, Seongnam-si, Gyeonggi, Republic of Korea) following the manufacturer’s protocol. The sequences
of the primers used were as follows. Tyrosinase sense
5′-7
CATCGCATAAAACCTGATGGC-3′; MITF sense
5′-CCCGTCTCTGGAAACTTGATCG-3′, antisense 5′-
CTGTACTCTGAGCAGCAGGTC-3′; Glyceraldehyde-3-phosphate dehydrogenase
(GAPDH) sense 5′-AGGTCGGTGTGAACGGATTTG-3′, antisense
5′-TGTAGACCATGTAGTTGAGGTCA-3′. The amplification conditions were as follows, for MITF and tyrosinase: 95℃ for 30 s, 62℃ for 45 s, and extension at 72℃ for 1 min for 25 cycles each; for GAPDH: 95℃ for 30 s, 60℃ for 30 s, and extension at 72℃ for 30 s. Agarose gel electrophoresis was performed to separate the PCR products and visualized by ethidium bromide.
2.8 Western blot analysis
B16F10 cells were seeded at 1 × 10⁴ cell/ml in 6 well plates for 18 h at 37℃.
Next, the cells were pretreated with α-MSH (500 ng/ml) for 24 h prior to treatment with different concentrations of PS and PTS (0-400 μg/ml). The cells were lysed with PRO-PREP lysis buffer (iNtRON Biotechnology). The supernatant was collected and protein concentrations were measured using Bio-Rad protein assay reagents (Bio-Rad, Hercules, CA). Equal amount of protein was separated by electrophoresis on SDS-polyacrylamide gel. The proteins were then transferred to a nitrocellulose membrane (Schleicher & Schuell, Keene, NH), and immunoblotted with specific antibodies. Bound antibodies were detected using an enhanced chemiluminescence plus kit (Thermo Scientific, Rockford, IL). The images were visualized by a Chemi-Smart 2000 (Vilber Lourmat, Cedex, France). Images were captured using Chemi-Capt (Vilber Lourmat) and transported into Adobe Photoshop.
8
2.9 Maintenance and phenotype based evaluation of zebrafish
AB strain zebrafish was served from C.H. Kang (Nakdong National Institute of Biological Resources, Sangju, Gyeongsangbukdo, Republic of Korea) and cultured at 28.5°C on a 14/10 h light/dark cycle. Embryos from natural spawning which was induced at the morning by turning on the light cultured in embryo medium [(NaCl-34.8 g, KCl-1.6 g, CaCl2.2H2O-5.8 g, MgCl2.6H2O-9.78 g) with double-distilled water, pH
7.2] supplemented with 1% methylene blue at 28°C. The 2 days post-fertilization (dpf) zebrafish (n=20) were arrayed by dropper into 6 well plates with 2 ml embryo medium. After 2 h incubation, the culture medium was replaced with new medium containing PS and PTS (400 μg/ml). Spontaneous melanin content was measured from densitometric analysis of zebrafish larvae at 4 dpf. In a parallel experiment, to investigate the effect of PS and PTS on α-MSH-stimulated zebrafish larvae, 200 µM PTU was pretreated for 24 h and then incubated with α-MSH (1 µg/ml) for an additional 24 h. The different concentrations of PS and PTS were treated at 4 dpf for 48 h. After anesthetizing zebrafish larvae in tricane methane sulfonate solution at 6 dpf, the larvae were mounted in 2% methyl cellulose on a depression slide and collected images using Olympus SZ2-ILST stereomicroscope (Tokyo, Japan). The densitometric analysis was performed using image J software (National Institute of Health). The quantification of pigmentation data was calculated as the percentage in comparison with the untreated control group.
2.10 Determination of melanogenic inhibitors effects on zebrafish toxicity
The toxicity of PS and PTS was determined by measuring the heart rate of zebrafish at 6 dpf and compared to the untreated control. Counting the heart rate were obtained with camera under stereomicroscope (Olympus SZ2-ILST). The obtained results were represented as average heart rate per minute.
9
2.11 UPLC–QT of MS for flavonoid analysis
Chromatographic separation was performed using a UPLC system (Waters Corp., Milford, MA, USA) equipped with a binary solvent delivery system, an auto-sampler, and a UV detector. Aliquots (3.0 μl) of each sample were then injected into a BEH C18
column (2.1 x 100 mm, 1.7 μM) at a flow rate of 0.4 ml/min and eluted using a chromatographic gradient of two mobile phases (A: water containing 0.1% formic acid; B: acetonitrile containing 0.1% formic acid). A linear gradient was optimized as follows: 0.0 min, 1% B; 0.0–1.0 min, 1–5% B; 1.0–10.0 min, 5–30% B; 10.0–17.0 min, 30–60% B; 17.0–17.1 min, 60–100% B; 17.1–19.0 min, 100% B, 19.1–20 min, back to 10% B. The quadrupole time-of-flight mass spectrometer (Q-Tof PremierTM,Waters Corp.) was operated in negative ion mode in the following conditions: capillary voltage 2.3 kV, cone voltage 50 V, source temperature 110°C, desolvation temperature 350°C. A sprayer with a reference solution of leucine-enkephalin ([M−H]− m/z 554.2615) was used as the lock mass. The full-scan data and MS/MS spectra were collected using the MassLynx software.
2.12 Statistical Analysis
All the data in this study were obtained as averages of experiments that were performed at least in triplicate and expressed as means ± Standard Error (SE). Statistical analysis was performed by Sigma plot 12.0 software by Student’s t-test and unpaired One-way analysis of variance (ANOVA) with Bonferroni’s correction. The significant significance of results was set at p < 0.05 (*), p < 0.01 (**), and p < 0.001 (***).
10
3. Results
3.1 PS and PTS do not alter cell viability at the concentrations used in this
study
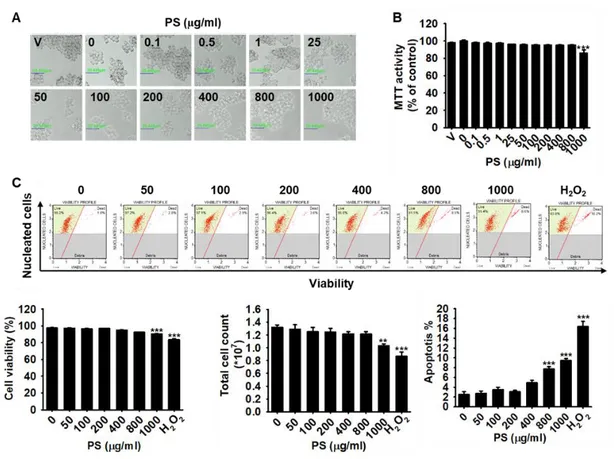
We first investigated whether PS and PTS are cytotoxic. B16F10 cells were treated with various concentrations (0-800 µg/ml) of PS and PTS for 72 h, and cytotoxicity was evaluated by microscopic analysis and MTT assay. As shown in Fig. 1.1A, no morphological change was observed following treatment with PS and PTS at any concentration, suggesting that PS and PTS did not induce phenotypic change. Results of MTT assay showed that PS at the high concentrations (over 200 µg/ml) slightly decreased mitochondrial activity (Fig. 1.2B). To confirm in detail whether PS and PTS influence cell viability, flow cytometric analysis was performed in the same experimental condition. As presented in Fig. 1.1C, PS and PTS, compared to the untreated control, did not increase the population of apoptotic cells, and sustained cell viability and total cell numbers. These data indicated that PS and PTS did not exert direct cytotoxicity.
12
Figure 1-1. PS and PTS do not alter cell viability at the concentrations tested.
B16F10 cells were treated with 0-800 µg/ml of PS or PTS for 72 h. (A) Microscopic images were captured and analyzed. (B) Cell viability was determined by the MTT assay. Cell viability in each group was presented as the percentage of the values of the untreated control. (C) In a parallel experiment, cell viability, viable cell count, and apoptotic cell population were measured by FACS. Data are reported as the mean ± SE of three independent experiments (n=3). * p < 0.01 and ***p < 0.001 compared to the untreated control group.
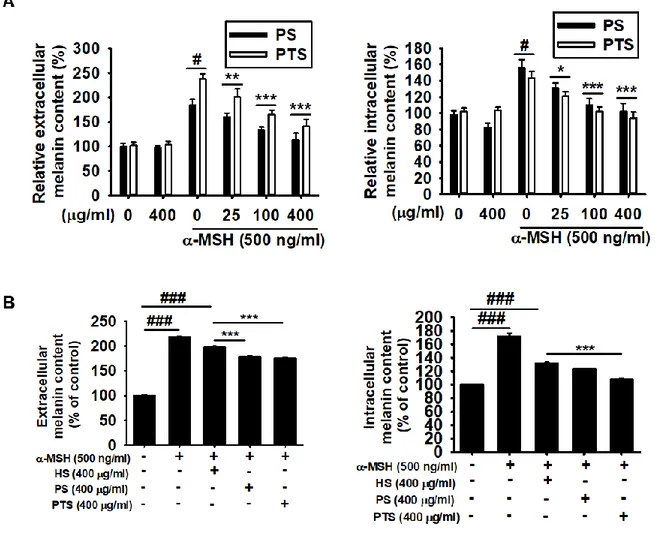
3.2 PS and PTS decrease extracellular and intracellular melanin
production in B16F10 cells stimulated by α-MSH.
To investigate the effect of PS and PTS on melanogenesis, B16F10 cells were treated with various concentrations (0-400 µg/ml) of PS and PTS for 72 h and melanin content was measured from extracellular and intracellular compartment. Both of the melanin contents maintained at PS and PTS at 400 µg/ml compared to the untreated group (Fig. 1.2A). However, melanogenesis stimulator, α-MSH, significantly increased extracellular and intracellular melanin content to approximately 200% (Fig. 1.2A, left panel) and 150% (Fig. 1.2A, right panel), respectively. PS and PTS dose-dependently downregulated α-MSH-mediated melanin content in extracellular and intracellular level. Next, commercial Hibiscus sabdariffa anthocyanin-rich extract (HS) was used to compare the effectiveness of melanin inhibition by PS or PTS. As shown in Fig. 1.2B, we found that both PS and PTS remarkably decreased the extracellular and intracellular melanin than those of HS-treated group. These data indicate that PS and PTS would be a promising candidate for anti-melanogenesis.
13
Figure 1-2. PS and PTS decrease extracellular and intracellular melanin
production in α-MSH-stimulated B16F10 cells. (A) B16F10 cells were exposed to
500 ng/ml α-MSH in the presence of 0 - 400 µg/ml PS or PTS for 72 h, and extracellular (right panel) and intracellular (left panel) melanin contents were measured. (B) In a parallel experiment, the cells were treated with α-MSH (500 ng/ml), PS (400 µg/ml), PTS (400 µg/ml), or commercial H. sabdariffa (HS, 400 µg/ml) for 72 h, and extracellular (right panel) and intracellular (left panel) melanin contents were measured. The percentage values in each group are relative to those in the untreated control. Data are reported as the mean ± SE of three independent experiments performed (n=3). # p < 0.05 and ### p < 0.001 vs. untreated control group; * p < 0.05, ** p < 0.01, *** p < 0.001 vs. α-MSH-stimulated group.
14
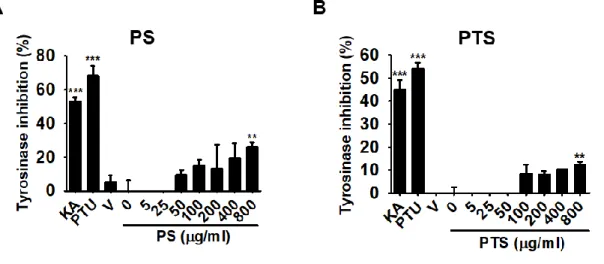
3.3 PS and PTS does not downregulate mushroom tyrosinase activity
Mushroom tyrosinase is widely examined to determine the effect of potential inhibitors of melanogenesis for the treatment of some dermatological disorders and for skin whitening. Therefore, we, for the first time, investigated whether PS and PTS negatively regulate mushroom tyrosinase activity in vitro using the conversion of L-tyrosine to O-hydroxylation of L-tyrosine and/or oxidation of L-DOPA to O-diquinone. A well-known, tyrosinase inhibitors, kojic acid and PTU, significantly inhibited the mushroom tyrosinase activity; however, both of PS and PTS did not inhibit the activity and highest concentration (800 μg/ml) a little increased the activity (Fig. 1.3A and 1.3B). These data indicate that PS and PTS do not direct inhibit tyrosinase activity.
Figure 1-3. PS and PTS do not downregulate mushroom tyrosinase activity in
vitro. (A) and PTS (B) on mushroom tyrosinase was measured in vitro. PS or PTS (0 -
800 µg/ml), kojic acid (KA, 25 µM), and PTU (250 nM) were loaded onto a 96-well microplate. After incubation with mushroom tyrosinase at 37℃ for 30 min, dopaquinone levels were measured by spectrophotometry at 490 nm. The percentage values in each experiment are expressed relative to those of untreated control. Data are
15
reported as the mean ± SEM of three independent experiments performed (n=3). ** p < 0.01 and *** p < 0.001 vs. untreated control group.
3.4 PS and PTS inhibits the expression of MITF and tyrosinase in
α-MSH-stimulated B16F10 cells
To investigate whether PS and PTS affect the expression of key regulators in melanogenesis, MITF and tyrosinase, RT-PCR and western blot analysis were performed after treatment with PS and PTS. As shown in Fig. 1.4A, α-MSH significantly upregulated MITF and tyrosinase expression at 48 h and both of PS and PTS dose-dependently suppressed α-MSH-induced tyrosinase and MITF expression. Especially, highest concentration (400 μg/ml) of them reduced α-MSH-induced tyrosinase and MITF expression as much as the untreated control. In addition, both of PS and PTS also decreased the protein levels of MITF and tyrosinase at 72 h induced by α-MSH (Fig. 1.4B). These results suggest that PS and PTS inhibit the melanogenesis by suppressing the expression of tyrosinase and MITF.
17
Figure 1-4. PS and PTS inhibit the expression of MITF and tyrosinase in
α-MSH-stimulated B16F10 cells. (A) B16F10 cells were exposed to 500 ng/ml α-MSH in the
presence of 0 - 400 µg/ml PS or PTS for 48 h, and the gene expression of MITF and tyrosinase (TYR) was measured. (B) Under the same experimental condition, the protein expression of MITF and TYR was measured by western blotting analysis at 72 h. The data are relative to the values in the untreated control group and represented as the means ± SE of three separate experiments (n=3). # p <0.05 and ### p< 0.001 vs. untreated control group; * p < 0.05, ** p < 0.01, and *** p < 0.001 vs. α-MSH-stimulated group.
3.5 PS and PTS inhibit melanin synthesis in zebrafish larvae
To further evaluate the anti-melanogenic activity of PS and PTS, we treated PS and PTS in α-MSH-stimulated zebrafish larvae and then measured melanogenesis. PS and PTS itself were treated for 2 days in 2 dpf zebrafish, which showed anti-melanogenic activity (Fig. 1.5A, left two lanes of upper and bottom). To additionally, investigate whether PS and PTS downregulates α-MSH-stimulated melanogenesis in zebrafish larvae, 2dpf zebrafish were pretreated with PTU (200 µM) for 24 h to reduce background pigmentation and then α-MSH (1 µg/ml) was treated for an additional 24 h to stimulate the melanogenesis. At 4 dpf, PS and PTS were treated for 48 h. As expected, both PS and PTS significantly decreased the melanin pigmentation in a concentration-dependent manner (Fig. 1.5A): both of PS and PTS at 400 µg/ml concentration reduced the melanin pigmentation to approximately 40% compared to the α-MSH-stimulated group (Fig. 1.5B). To determine whether PS and PTS exerts toxicity in zebrafish larvae, we monitored the heart rate, morphological patterns and mortality. In assessing the heart rate, the zebrafish larvae treated with PS and PTS did not show any apparent difference compared to the untreated control group (Fig. 1.5C).
18
Furthermore, morphological malformation and mortality of the larvae were also not observed under the condition treated with PS and PTS for 48 h (Fig. 1.5A). This results suggest that PS and PTS are potent inhibitors for melanogenesis in vivo.
19
Figure 1-5. PS and PTS inhibit melanin synthesis in zebrafish larvae. (A and B)
Zebrafish larvae at 2 dpf were treated with PS and PTS (400 µg/ml) for 48 h, and images were collected (left two zebrafish larvae, top for PS and bottom of PTS). Additionally, 2 dpf zebrafish larvae were treated with PTU (200 µM) for 24 h, and the medium was replaced with α-MSH (1 µg/ml) for another 24 h. Next, the larvae were treated with the indicated concentration of PS or PTS for 48 h. The effects of PS and PTS on pigmentation in zebrafish were observed under an Olympus microscope (40×). (B) Relative density was calculated by the Image J software. (C) Average heart rate of zebrafish larvae (n=20) was measured to assess the toxicity of PS and PTS. Data are reported as the mean ± SEM of three independent experiments (n=3). # p < 0.05 vs. untreated control group; *** p < 0.001 vs. α-MSH-stimulated group pretreated with PTU.
3.6 PS- and PTS-induced ERK phosphorylation regulates MITF
expression
Since ERK phosphorylation promoted tyrosinase activity by enhancing the proteosomal degradation of MITF, leading to melanogenesis (Kim et al., 2014; Wang et al., 2017), we examined whether PS and PTS induce the ERK phosphorylation in α-MSH-stimulated B16F10 cells. Our results revealed that no significant expression of ERK phosphorylation occurred in α-MSH-stimulated B16F10 cells; however, PS (Fig. 1.6A, left panel) and PTS (Fig. 1.6A, right panel) remarkably upregulated ERK phosphorylation irrespective of the presence of α-MSH. We, next, examined whether a specific ERK inhibitor, PD98059, restores MITF expression degraded by PS and PTS-mediated ERK phosphorylation. As shown in Fig. 1.6B and Fig. 1.6C, MITF expression was significantly reinstated in both PS and PTS-treated B16F10 cells. Therefore, these
20
results indicate that ERK phosphorylation is involved with the effects of PS and PTS on MITF degradation in B16F10 cells.
21
Figure 1-6. PS- and PTS-induced ERK phosphorylation downregulates MITF
expression. (A) B16F10 cells were pretreated with 500 ng/ml α-MSH and then treated
with PS or PTS (each 0 - 400 µg/ml) for 72 h, and ERK phosphorylation was analyzed by western blotting analysis (left, PS-treated; right, PTS-treated). (B) The cells were pretreated with PD98059 (10 μM) for 1 h, and then treated with 500 ng/ml α-MSH in the absence or presence of PS or PTS (each 100 μg/ml and 400 μg/ml) for 72 h. Next, the levels of p-ERK1/2 and MITF in cell lysate were analyzed by western blotting analysis. The percentage values are relative to those in the untreated control. The data are represented as the means ± SEM of three separate experiments (n=3). # p < 0.05, ## p < 0.01, and ### p <0.001 vs. untreated control group; * p < 0.05 and ** p < 0.01 vs. α-MSH-stimulated group.
3.7 The ERK signaling pathway regulates melanogenesis in PS- and
PTS-treated B16F10 cells and zebrafish larvae
To further confirm the role of the ERK signaling pathway on PS- and PTS-induced anti-melanogenic effect, we examined extracellular and intracellular melanin content and melanogenesis in α-MSH-stimulated B16F10 cells and zebrafish larvae. As shown in Fig. 1.7A and Fig. 1.7B, PD98059 itself did not downregulate α-MSH-mediated extracellular and intracellular melanin content, which indicates that PD98059 did not influence melanin production stimulated by α-MSH because the ERK signaling pathway is deviated from α-MSH-stimulated melanogenesis. On the other hand, PD98059 directly reversed PS- and PTS-mediated inhibition (Fig. 1.7A and Fig. 1.7B, respectively) of extracellular (top panel) and intracellular (bottom panel) melanin contents in response to α-MSH. These results imply that PS and PTS inhibit melanin production in α-MSH-stimulated B16F10 cells through the ERK signaling pathways. Furthermore, to evaluate whether anti-melanogenic activity of PS and PTS occurs by
22
activating ERK, zebrafish larvae were treated with PS and PTS along with PD98059 for 48 h after the treatment with α-MSH for 24 h. As shown in Fig. 1.7C, PS and PTS remarkably suppressed α-MSH-stimulated melanogenesis in zebrafish larvae; however, PD98059 significantly increased melanin pigmentation on the body surface from PS and PTS-treated zebrafish larvae (Fig. 1.7C). Compared with PS- and PTS-treated group (each 400 µg/ml), PD98059 exposure resulted in an increase of melanogenesis to approximately 124% and 111%, respectively (Fig. 1.7D). PS and PTS showed no significant effect on the heart beat rate of zebrafish and did not exhibit any conspicuous adverse effect (Fig. 1.7E). Additionally, the heart rate regularly sustained, which suggest that all chemicals give no influence on toxicity under all the current experimental conditions (Fig. 1.7E). These data indicate that ERK activation functions a key negative regulator on PS- and PTS-induced anti-melanogenesis.
24
Figure 1-7. The ERK signaling pathway positively regulates melanogenesis in PS-
and PTS-treated B16F10 cells and zebrafish larvae. (A and B) B16F10 cells were
treated with α-MSH (500 ng/ml) in the presence of PS or PTS (100 µg/ml and 400 µg/ml) for 72 h after pretreatment with PD98059 (10 µM). Extracellular (top panel) and intracellular (bottom panel) melanin contents were measured (A: PS-treated; B; PTS-treated). (C) Zebrafish at 2 dpf were treated with PTU (200 μM) for 24 h and then with α-MSH (1 µg/ml) for 48 h. Next, the medium was replaced with PD98059 (20 μM) for 2 h, and then the fish were treated with PS (400 µg/ml) or PTS (400 µg/ml) for 48 h. (D) Pigmentation in zebrafish was observed under an Olympus microscope (40×) and relative density was calculated by the Image J software. (E) Average heart rate in zebrafish larvae (n=20) was measured to assess the toxicity of the extracts. Data are reported as the mean ± SEM of three independent experiments (n=3). ### p < 0.001 vs. untreated control group; * p < 0.05, ** p < 0.01, and *** p < 0.001 vs. α-MSH-stimulated group (A and B). *** p < 0.001 vs. PTU + PT or PTS group (D).
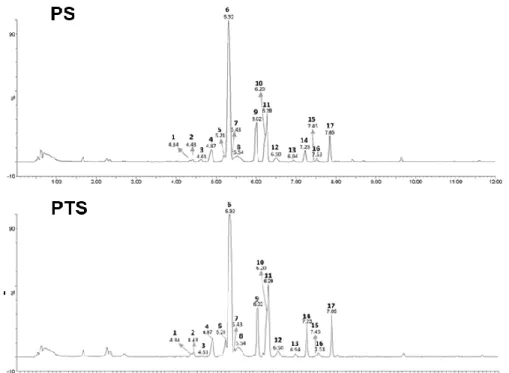
3.8 Tentative identification of metabolites in PS
To set the importance of analyzed metabolites in a practical content, a comprehensive profile of the constituents of anthocyanin and flavonoids extract was directly analyzed by UPLC-PDA-QTof-MS chromatogram as shown in Fig. 1.8 (top panel for PS and bottom panel for PTS). Mass spectrometry, which acquires mass spectra from the product ions produced from the fragmentation of a selected precursor ion, has been used for identification and characterization of metabolites (Table. 1.1). The typical fragmentation pattern includes O-glucoside (m/z 162), C-glucoside (m/z 120 and 90), and acetylhexoside (m/z 204) [23]. The peaks 1, 2 and 4 were tentatively identified as galatoside (1, tR = 4.34 min, m/z 449, 287), cyanidin-3-O-glucoside (2, tR = 4.43 min, m/z 449, 287), and cyanidin-3,5-O-dicyanidin-3-O-glucoside (4, tR =
25
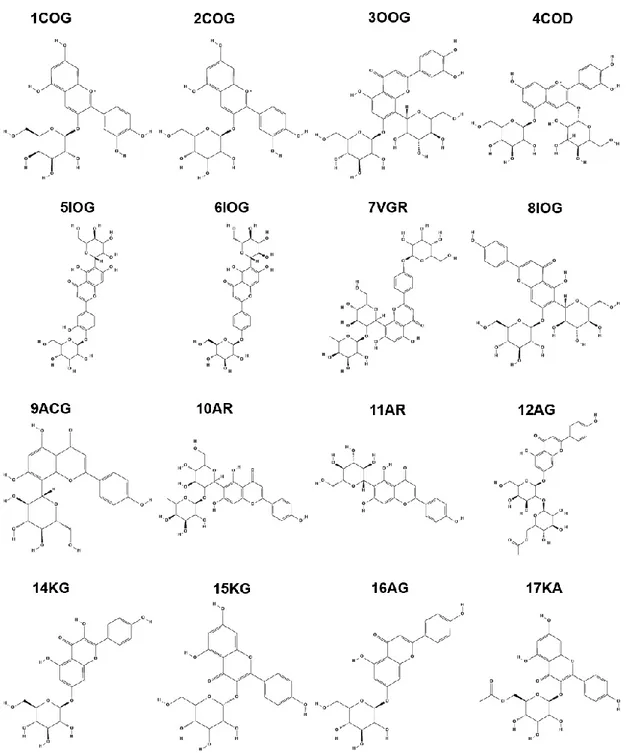
4.87 min, m/z 611, 449, 287) because of its shorter retention time and analysis of MS/MS data compared to the literature led [24, 25]. The fragment ion of peaks 3, and 5-12 were observed typical characteristics of the C-glycosyl flavones such as the loss of −90 and −120 amu. In addition, the product ion mass spectrum of peaks 3 (tR = 4.61 min, m/z 609), 5 (tR = 5.21 min, m/z 609), 6 (tR = 5.32 min, m/z 593), 7 (tR = 5.43 min, m/z 739), 8 (tR = 5.54 min, m/z 593), 9 (tR = 6.02 min, m/z 431), 10 (tR = 6.20 min, m/z 577), 11 (tR = 6.28 min, m/z 431), and 12 (tR = 6.50 min, m/z 635) showed as deprotonated ion [M–H]− and the main fragment ion at m/z 447 [(M–H)–162]−, 431 [(M–H)–162]−, m/z m/z 357 [(M–H)–(162+90)]−, and m/z 327 [(M–H)–(162+120)]−. This molecular weight was determined to be the characteristic of the aglycone as the apigenin structure by comparing it with previously published data [23]. Therefore, peaks 3, and 5-12 was confirmed with orientin-7-O-glucoside (3), isoorientin-4'-O-glucoside (5), isovitexin-4'-O-isoorientin-4'-O-glucoside (6), vitexin-4'-O-isoorientin-4'-O-glucoside-2''-O-rhamnoside (7), isovitexin-7-O-glucoside (8), apigenin-8-C-β-D-glucoside (9), isovitexin-2″-O-rhamnoside (10), apigenin-6-C-β-D-glucoide (11), and apigenin-6-C-glucoside-7-(6''-O-acetylglucoside) (12). The most area peak 6 was present in very high intensity because they appeared as principal peaks in the UPLC-PDA-QTof-MS chromatogram with retention times. Based on the MS/MS analysis, the spectra of peaks 13–17 contained ions at m/z 284–285 and 207-271 indicating that their aglycone moieties were kaempferol and apigenin. Peak 13 (tR = 6.94 min, m/z 693) had a molecular ion [M−H]− at m/z 693 and produced MS/MS fragments at m/z 447, 284 and 255, a typical fragment for kaempferol-O-glucoside. Based on these results, compound 13 was identified as a kaempferol-O-glucoside derivative. Peaks14-17 were identified as kaempferol-7-O-glucoside (14, tR = 7.23 min, m/z 447, 284), kaempferol-3-O-kaempferol-7-O-glucoside (15, tR = 7.45 min, m/z 447, 285), apigenin-7-O-glucoside (16, tR = 7.53 min, m/z 431, 271), and kaempferol-3-(6''-O-acetylglucoside) (17, tR = 4.43 min, m/z 489, 284), respectively,
26
by matching the experimental MS, MS/MS and molecular formulae with the literature spectr [26]. These glycones were previously reported as common flavonoid glycosides and the structures were shown in Fig. 1.9.
Figure 1-8. Comprehensive profile of anthocyanin and flavonoid constituents in
27
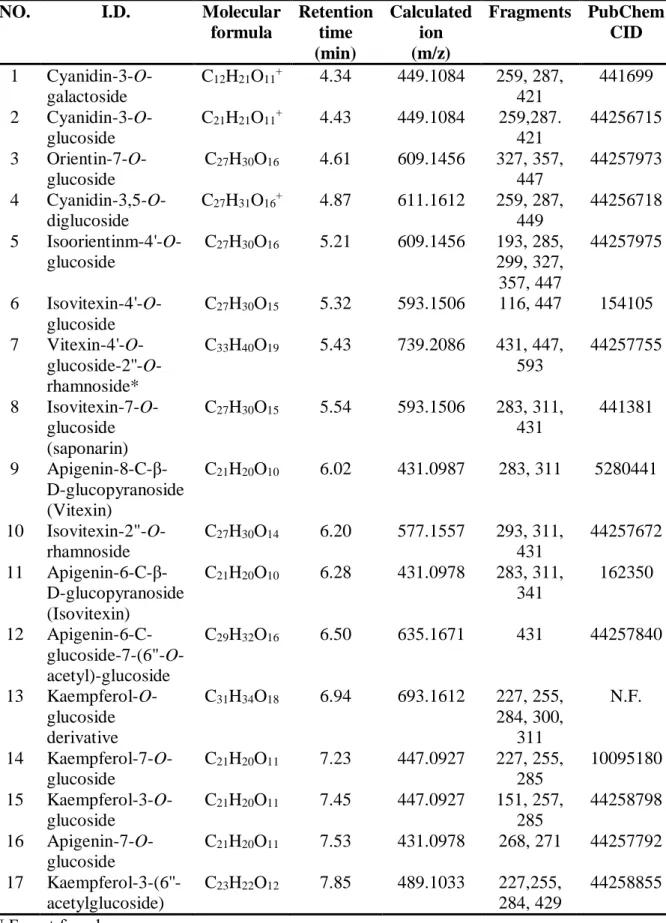
Table 1.1. Identification and characterization of metabolites
NO. I.D. Molecular formula Retention time (min) Calculated ion (m/z) Fragments PubChem CID 1 Cyanidin-3-O-galactoside C12H21O11+ 4.34 449.1084 259, 287, 421 441699 2 Cyanidin-3-O-glucoside C21H21O11+ 4.43 449.1084 259,287. 421 44256715 3 Orientin-7-O-glucoside C27H30O16 4.61 609.1456 327, 357, 447 44257973 4 Cyanidin-3,5-O-diglucoside C27H31O16+ 4.87 611.1612 259, 287, 449 44256718 5 Isoorientinm-4'-O-glucoside C27H30O16 5.21 609.1456 193, 285, 299, 327, 357, 447 44257975 6 Isovitexin-4'-O-glucoside C27H30O15 5.32 593.1506 116, 447 154105 7 Vitexin-4'-O- glucoside-2''-O-rhamnoside* C33H40O19 5.43 739.2086 431, 447, 593 44257755 8 Isovitexin-7-O-glucoside (saponarin) C27H30O15 5.54 593.1506 283, 311, 431 441381 9 Apigenin-8-C-β-D-glucopyranoside (Vitexin) C21H20O10 6.02 431.0987 283, 311 5280441 10 Isovitexin-2"-O-rhamnoside C27H30O14 6.20 577.1557 293, 311, 431 44257672 11 Apigenin-6-C-β-D-glucopyranoside (Isovitexin) C21H20O10 6.28 431.0978 283, 311, 341 162350 12 Apigenin-6-C- glucoside-7-(6"-O-acetyl)-glucoside C29H32O16 6.50 635.1671 431 44257840 13 Kaempferol-O-glucoside derivative C31H34O18 6.94 693.1612 227, 255, 284, 300, 311 N.F. 14 Kaempferol-7-O-glucoside C21H20O11 7.23 447.0927 227, 255, 285 10095180 15 Kaempferol-3-O-glucoside C21H20O11 7.45 447.0927 151, 257, 285 44258798 16 Apigenin-7-O-glucoside C21H20O11 7.53 431.0978 268, 271 44257792 17 Kaempferol-3-(6''-acetylglucoside) C23H22O12 7.85 489.1033 227,255, 284, 429 44258855 N.F.: not found.
28
29
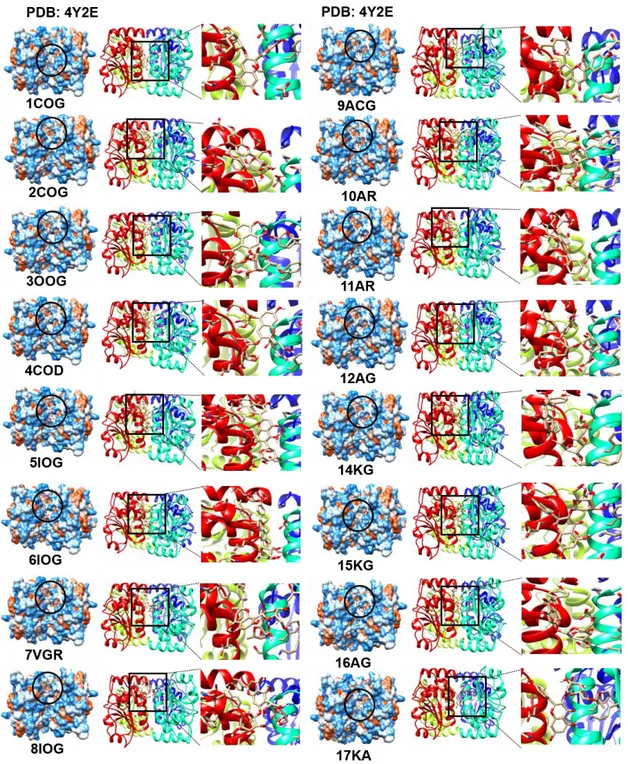
Figure 1-10. Molecular docking data. All 17 anthocyanins identified in this study
30
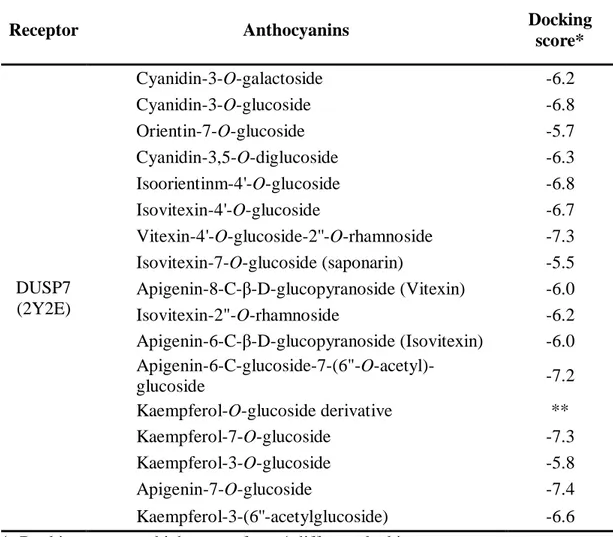
Table 1.2. Classification of results gained from the docking of anthocyanins
identified in this study into DUSP7.
*, Docking score are highest one from 4 different docking pose. **, Chemical structure was not found from PubChem CID.
Receptor Anthocyanins Docking
score* DUSP7 (2Y2E) Cyanidin-3-O-galactoside -6.2 Cyanidin-3-O-glucoside -6.8 Orientin-7-O-glucoside -5.7 Cyanidin-3,5-O-diglucoside -6.3 Isoorientinm-4'-O-glucoside -6.8 Isovitexin-4'-O-glucoside -6.7 Vitexin-4'-O-glucoside-2''-O-rhamnoside -7.3 Isovitexin-7-O-glucoside (saponarin) -5.5 Apigenin-8-C-β-D-glucopyranoside (Vitexin) -6.0 Isovitexin-2"-O-rhamnoside -6.2 Apigenin-6-C-β-D-glucopyranoside (Isovitexin) -6.0 Apigenin-6-C-glucoside-7-(6"-O-acetyl)-glucoside -7.2 Kaempferol-O-glucoside derivative ** Kaempferol-7-O-glucoside -7.3 Kaempferol-3-O-glucoside -5.8 Apigenin-7-O-glucoside -7.4 Kaempferol-3-(6''-acetylglucoside) -6.6
31
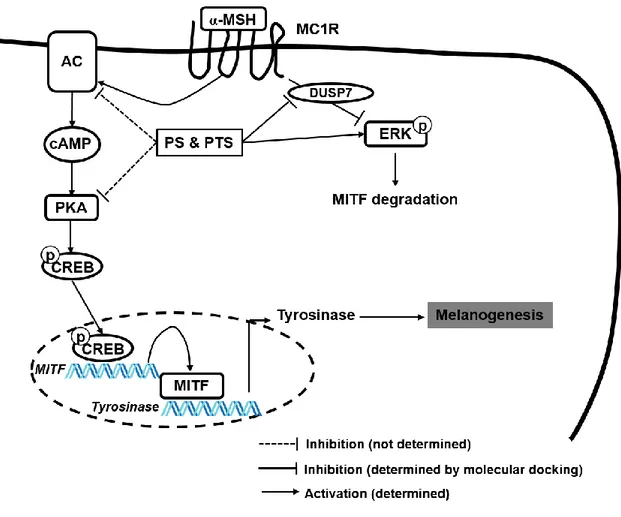
Figure 1-11. The inhibitory mechanism of PS and PTS on α-MSH-stimulated
melanogenesis. PS and PTS inhibited melanin production in B16F10 cells and
zebrafish larvae; all anthocyanins in both extracts bound to dual specificity protein phosphatase 7 (DUSP7), leading to sustainment of extracellular signal-regulated kinase (ERK) activation, which consequently downregulated tyrosinase expression and activity by inhibiting microphthalmia-associated transcription factor (MITF) expression.
32
4. Discussion
Anthocyanins are the color pigments from most fruits, vegetables and flowers, which possesses beneficial effects against many chronic diseases such as diabetes, cardiovascular disease, and obesity [27, 28]. Many researchers investigated the potential health benefits of anthocyanins over the past decades [29, 30]. Recently, anthocyanins from H. sabdariffa was purified [31, 32], which had antioxidant and antiproliferative activity, and reduced low-density lipoprotein-mediated macrophage apoptosis and hepatic damages [33-35]. Nevertheless, no data have been reported on the anthocyanin from H. syriacus. H. syriacus (Rose of Sharon or Mugunghwa) as a well-known traditional medicine material is the national flower of South Korea and a member of the family Malvaceae with H. sabdariffa which have numerous pharmacological benefits such as proliferative, cancer, microbial, anti-viral and anti-inflammatory activity [18-21]. In the current study, we, for the first time, confirmed that anthocyanin-rich extracts (PS and PTS, respectively) from two H. syriacus variety (Pulsae and Paetanshim) possessed 17 anthocyanins which were different from those isolated from H. sabdariffa and revealed anti-melanogenic activity by activating the ERK signal pathway.
Tyrosinase is a multifuncational and copper-containing enzyme, which are positively regulates melanin production [7]. Therefore, for several decades, many natural tyrosinase inhibitors have found for cosmetic and medical applications. Especially, monphenolic compounds including hydrouinone, arbutin, resorcinol and kojic acid have been known to directly bind to tyrosinase instead of its substrates such as L-tyrosine and DOPA which have a monophenolic structure [36]. Also, many
polyphenols are potent anti-melanogenic compounds by directly binding to tyrosinase via hydrogen bonds and van der Waals forces as well as their structural specificity such as the position of hydroxyl groups [37]. Among of polyphenols, anthocyanin contents
33
from black soya bean showed anti-human and anti-mushroom tyrosinase activities which was different by the extraction solvents [38]. In the current study, we purified 17 anthocyanin-rich extracts from two H. syriacus varieties and confirmed that high concentration at 800 μg/ml slightly inhibited mushroom tyrosinase activity; however, both PS and PTS significantly suppresses extracellular and intracellular melanin contents, which indicates that both PS and PTS negatively regulate melanin production through alternative mechanisms, not direct inhibition of tyrosinase.
Recently, the ERK pathway directly stimulates MITF phosphorylation, causing to its proteosomal degradation, which consequently inhibits melanogenesis [5, 12]. Therefore, ERK activation has been thought as a promising target for anti-melanogenesis. In the current study, we found that PS and PTS significantly activated ERK phosphorylation and an ERK inhibitor, PD98059, inhibited melanogenesis along with downregulation of MITF in B16F10 cells and zebrafish larvae, which indicate that PS- and PTS-mediated anti-melanogenic activity is due to an increase of ERK phosphorylation and subsequent degradation of MITF. Nevertheless, we could not find what molecule is a target of PS and PTS for ERK phosphorylation during anti-melanogenesis. Therefore, we tried to find negative regulators of the ERK signaling pathway which could be bound to anthocyanins of PS and PTS, causing ERK activation. First well-known negative regulator is a protein phosphastase 2A (PP2A) [39]. Molecular docking study found that PP2A (PDB: 3FGA) did not show to directly bind to all anthocyanins identified from PS and PTS, suggesting that PP2A is not a target molecule. Additionally, Buffet et al. reported two ERK-specific dual speicificity phosphatases (DUSP5 and DUSP6) which induces the dephosphorylation of ERK in the nucleus and the cytoplasm along with ERK phosphorylation [40]. However, all anthocyanins were not bind to DUSP5 (PDB: 2G6Z) and DUSP6 (PDB: 1HZM). DUSP7 (PDB: 2Y2E) is also a well-known ERK-specific phosphatase which could
34
dephosphorylate ERK [41, 42]. Our molecular docking data showed that all anthocyanins identified in this study, directly bound to DUSP7 between two monomers (Fig. 1.9). Even though molecular docking found 4 different poses to bind between each anthocyanin and DUSP7, it was difficult to pinpoint what amino acids of DUSP7 could accurately bind to anthocyanins identified in this study because of more than 2 coplanar positions specified. Nevertheless, on the basis of docking score (Table 1.2), apigenin-7-O-glucoside (docking score: -7.4), vitexin-4'-O-glucoside-2''-O-rhamnoside (-7.3), kaempferol-7-O-glucoside (-7.3), and apigenin-6-C-glucoside-7-(6"-O-acetyl)-glucoside (-7.2) had strong binding activity to DUSP7; kaempferol-3-O-glucoside (-5.8), orientin-7-O-kaempferol-3-O-glucoside (-5.7), and isovitexin-7-O-kaempferol-3-O-glucoside (-5.5) had relatively low binding activity. These data suggest that anthocyanins from PS and PTS promotes anti-melanogenic activity by activating the ERK signaling pathway. Additionally, some anthocyanins from PS and PTS could bind to AC and Protein kinase A (PKA), according molecular docking (data not shown), which suggest that PS and PTS also downregulate AC and Protein PKA mediated melanogenesis (Fig. 1.10). Previous research showed that the inhibition of AC and PKA pathway positively modulated ERK activation [43], which suggest that AC inhibition would be one of upstream target of anthocyanins from PS and PTS, leading to ERK-mediated anti-melanogenesis along with DUSP7 suppression. Nevertheless, unsolved puzzle is still existed in this study. Above mentioned, many evidences showed that ERK activators are a splendid candidates for anti-melanogenesis [5, 12] and our data also verified that anthocyanins of PS and PTS inhibits melanogenesis in response to α-MSH or without stimuli by phosphorylating ERK. However, in other experimental conditions, some anthocyanins suppressed the ERK pathway, leading to cancer activity and anti-metastasis [44, 45]. Why do anthocyanins increase or decrease ERK phosphorylation
35
in different experimental condition? To solve this riddle, continuous study will be needed on anthocyanins in many different experimental models.
In summary, PS and PTS possessed same 17 anthocyanins, which is directly bound to DUSP7, leading to ERK phosphorylation and subsequent anti-melanogenic activity. Finally, PS and PTS would be a potential skin whitening agent and a novel medical application for the treatment of dermatological problems such as melsma, wrinkling, and senile lentigines.
36
5. References
1. Zabierowski, S.E., et al., Direct reprogramming of melanocytes to neural crest stem-like cells by one defined factor. Stem Cells, 2011. 29(11): p. 1752-62. 2. Videira, I.F., D.F. Moura, and S. Magina, Mechanisms regulating
melanogenesis. An Bras Dermatol, 2013. 88(1): p. 76-83.
3. Ebanks, J.P., R.R. Wickett, and R.E. Boissy, Mechanisms regulating skin pigmentation: the rise and fall of complexion coloration. Int J Mol Sci, 2009.
10(9): p. 4066-87.
4. Togsverd-Bo, K., et al., Skin autofluorescence reflects individual seasonal UV exposure, skin photodamage and skin cancer development in organ transplant recipients. J Photochem Photobiol B, 2018. 178: p. 577-583.
5. Pillaiyar, T., M. Manickam, and S.H. Jung, Downregulation of melanogenesis: drug discovery and therapeutic options. Drug Discov Today, 2017. 22(2): p. 282-298.
6. Kumari, S., et al., Melanogenesis Inhibitors. Acta Derm Venereol, 2018.
98(10): p. 924-931.
7. del Marmol, V. and F. Beermann, Tyrosinase and related proteins in mammalian pigmentation. FEBS Lett, 1996. 381(3): p. 165-8.
8. Vachtenheim, J. and J. Borovansky, Transcription physiology of pigment formation in melanocytes: central role of MITF. Exp Dermatol, 2010. 19(7): p. 617-27.
9. Liu, J.J. and D.E. Fisher, Lighting a path to pigmentation: mechanisms of MITF induction by UV. Pigment Cell Melanoma Res, 2010. 23(6): p. 741-5.
37
10. Roh, E., et al., cAMP-binding site of PKA as a molecular target of bisabolangelone against melanocyte-specific hyperpigmented disorder. J Invest Dermatol, 2013. 133(4): p. 1072-9.
11. Rodriguez, C.I. and V. Setaluri, Cyclic AMP (cAMP) signaling in melanocytes and melanoma. Arch Biochem Biophys, 2014. 563: p. 22-7.
12. Kim, E.S., et al., Mitochondrial dynamics regulate melanogenesis through proteasomal degradation of MITF via ROS-ERK activation. Pigment Cell Melanoma Res, 2014. 27(6): p. 1051-62.
13. Wang, R., et al., FGF21 regulates melanogenesis in alpaca melanocytes via ERK1/2-mediated MITF downregulation. Biochem Biophys Res Commun, 2017. 490(2): p. 466-471.
14. Bellei, B., et al., Wnt/beta-catenin signaling is stimulated by alpha-melanocyte-stimulating hormone in melanoma and melanocyte cells: implication in cell differentiation. Pigment Cell Melanoma Res, 2011. 24(2): p. 309-25.
15. Guo, H., et al., Wnt/β-catenin signaling pathway activates melanocyte stem cells in vitro and in vivo. J Dermatol Sci, 2016. 83(1): p. 45-51.
16. di Martino, O., et al., Hibiscus syriacus extract from an established cell culture stimulates skin wound healing. Biomed Res Int, 2017. 2017: p. 7932019. 17. Yang, J.E., et al., Dietary enzyme-treated Hibiscus syriacus L. protects skin
against chronic UVB-induced photoaging via enhancement of skin hydration and collagen synthesis. Arch Biochem Biophys, 2019. 662: p. 190-200.
18. Kim, Y.H., et al., Antidepressant-like and neuroprotective effects of ethanol extract from the root bark of Hibiscus syriacus L. Biomed Res Int, 2018. 2018: p. 7383869.
19. Shi, L.S., et al., Cytotoxic effect of triterpenoids from the root bark of Hibiscus syriacus. Fitoterapia, 2014. 97: p. 184-91.
38
20. Hsu, R.J., et al., The triterpenoids of Hibiscus syriacus induce apoptosis and inhibit cell migration in breast cancer cells. BMC Complement Altern Med, 2015. 15: p. 65.
21. Kwon, S.W., et al., Antioxidant properties of heat-treated Hibiscus syriacus. Izv Akad Nauk Ser Biol, 2003(1): p. 20-1.
22. Duckworth, H.W. and J.E. Coleman, Physicochemical and kinetic properties of mushroom tyrosinase. J Biol Chem, 1970. 245(7): p. 1613-25.
23. Lee, J.H., et al., Elucidation of phenolic antioxidants in barley seedlings (Hordeum vulgare L.) by UPLC-PDA-ESI/MS and screening for their contents at different harvest times. Journal of Functional Foods, 2016. 26: p. 667-680. 24. Ito, C., et al., Characterisation of proanthocyanidins from black soybeans:
isolation and characterisation of proanthocyanidin oligomers from black soybean seed coats. Food Chem, 2013. 141(3): p. 2507-12.
25. Lee, J.H., et al., Characterisation of anthocyanins in the black soybean (Glycine max L.) by HPLC-DAD-ESI/MS analysis. Food Chemistry, 2009. 112(1): p. 226-231.
26. Ryu, H.W., et al., Comparison of secondary metabolite changes in Camellia sinensis leaves depending on the growth stage. Food Control, 2017. 73: p. 916-921.
27. Lee, Y.M., et al., Dietary anthocyanins against obesity and inflammation. Nutrients, 2017. 9(10).
28. Putta, S., et al., Anthocyanins: multi-target agents for prevention and therapy of chronic diseases. Curr Pharm Des, 2017. 23(41): p. 6321-6346.
29. Bonesi, M., et al., The role of anthocyanins in drug discovery: recent developments. Curr Drug Discov Technol, 2019.
39
30. Naseri, R., et al., Anthocyanins in the management of metabolic syndrome: a pharmacological and biopharmaceutical review. Front Pharmacol, 2018. 9: p. 1310.
31. Piovesana, A., E. Rodrigues, and C.P.Z. Norena, Composition analysis of carotenoids and phenolic compounds and antioxidant activity from hibiscus calyces (Hibiscus sabdariffa L.) by HPLC-DAD-MS/MS. Phytochem Anal, 2019. 30(2): p. 208-217.
32. Grajeda-Iglesias, C., et al., Isolation and characterization of anthocyanins from Hibiscus sabdariffa flowers. J Nat Prod, 2016. 79(7): p. 1709-18.
33. Maciel, L.G., et al., Hibiscus sabdariffa anthocyanins-rich extract: Chemical stability, in vitro antioxidant and antiproliferative activities. Food Chem Toxicol, 2018. 113: p. 187-197.
34. Chang, Y.C., et al., Hibiscus anthocyanins-rich extract inhibited LDL oxidation and oxLDL-mediated macrophages apoptosis. Food Chem Toxicol, 2006.
44(7): p. 1015-23.
35. Wang, C.J., et al., Protective effect of Hibiscus anthocyanins against tert-butyl hydroperoxide-induced hepatic toxicity in rats. Food Chem Toxicol, 2000.
38(5): p. 411-6.
36. Munoz-Munoz, J.L., et al., Suicide inactivation of the diphenolase and monophenolase activities of tyrosinase. IUBMB Life, 2010. 62(7): p. 539-47. 37. Zolghadri, S., et al., A comprehensive review on tyrosinase inhibitors. J Enzyme
Inhib Med Chem, 2019. 34(1): p. 279-309.
38. Jhan, J.K., et al., Anthocyanin contents in the seed coat of black soya bean and their anti-human tyrosinase activity and antioxidative activity. Int J Cosmet Sci, 2016. 38(3): p. 319-24.
40
39. Yu, L.G., et al., Protein phosphatase 2A, a negative regulator of the ERK signaling pathway, is activated by tyrosine phosphorylation of putative HLA class II-associated protein I (PHAPI)/pp32 in response to the antiproliferative lectin, jacalin. J Biol Chem, 2004. 279(40): p. 41377-83.
40. Buffet, C., et al., DUSP5 and DUSP6, two ERK specific phosphatases, are markers of a higher MAPK signaling activation in BRAF mutated thyroid cancers. PLoS One, 2017. 12(9): p. e0184861.
41. Kidger, A.M. and S.M. Keyse, The regulation of oncogenic Ras/ERK signalling by dual-specificity mitogen activated protein kinase phosphatases (MKPs). Semin Cell Dev Biol, 2016. 50: p. 125-32.
42. Urness, L.D., et al., Expression of ERK signaling inhibitors Dusp6, Dusp7, and Dusp9 during mouse ear development. Dev Dyn, 2008. 237(1): p. 163-9. 43. Davis, M.I., J. Ronesi, and D.M. Lovinger, A predominant role for inhibition of
the adenylate cyclase/protein kinase A pathway in ERK activation by cannabinoid receptor 1 in N1E-115 neuroblastoma cells. J Biol Chem, 2003.
278(49): p. 48973-80.
44. Wang, L.S. and G.D. Stoner, Anthocyanins and their role in cancer prevention. Cancer Lett, 2008. 269(2): p. 281-90.
45. Chen, X.Y., et al., Black rice anthocyanins suppress metastasis of breast cancer cells by targeting RAS/RAF/MAPK pathway. Biomed Res Int, 2015. 2015: p. 414250.
41
PART 02
Hibiscus syriacus anthocyanin-rich extract attenuate
the LPS-induced inflammation in RAW264.7
macrophages and zebrafish via
NF-κB signaling pathway
42
Abstract
The inflammatory process is a useful host response to cellular injury or external challenges that initiate and sustain inflammation, and terminate the process. Nevertheless, continued inflammation can be destructive and can contribute to the pathogenesis of many diseases. Hibiscus syriacus is used as a medicinal plant in oriented medicine even though its effect on anti-inflammation is unknown. Therefore we further studied the anti-inflammatory effect of anthocyanin-rich extracts from the H. syriacus varieties Pulsae (PS) on the lipopolysaccharide (LPS)-induced expression of proinflammatory mediators and the molecular mechanisms underlying these activities in RAW264.7 macrophages. We observed that, at the highest concentration of PS (1000 µg/ml) exhibited no substantial effect on cell viability and cellular morphological modification. Moreover, PS suppressed the LPS-induced nitric oxide (NO) and prostaglandin E2 (PGE-2) and reduced the expression of inducible NO synthase (iNOS) and cyclooxygenase-2 (COX-2) concentration dependently at the transcriptional and translational level. Furthermore, PS inhibited the production of proinflammatory cytokines including interleukin-6 (IL-6), interleukin-12 (IL-12) and tumor necrosis factor-alpha (TNF-α) in LPS-induced RAW264.7 cells. Further studies showed that PS significantly decreased LPS-induced nuclear translocation of the nuclear factor-B (NF-κB) subunits, p65 and p50. The inhibitory effect of PS further confirmed in LPS microinjected zebrafish larvae due to the diminishing the recruitment of neutrophil and macrophages. Taken together, our results indicate that PS attenuate inflammation in both in vitro and in vivo primarily by inhibiting the activation of NF-κB activity. It might be used as a navel modulatory drug for effective treatment of inflammation-related diseases.
43
1. Introduction
Inflammation is a highly regulated self-limiting process to identify and destroy invading pathogens and restore normal tissue structure and function [1]. However in many cases an excessive inflammatory response gas been recognized as the principle reason of chronic inflammation including vascular disease, rheumatoid arthritis, inflammatory bowel disease and cancer [2-5]. Macrophages are a differentiated tissue cell type originating as blood monocytes and function as the initiation and propagation of inflammatory responses by releasing proinflammatory mediators, such as nitric oxide (NO), interleukin‑6 (IL‑6), interleukin‑12 (IL‑12), tumor necrosis factor‑α (TNF‑α), and prostaglandins (PGE2) by inducible cyclo‑oxygenase (COX‑2) [6, 7].
One of the most potent initiators of inflammation is the Lipopolysaccharide (LPS), a major component of the outer membrane of Gram‑negative bacteria. LPS triggers monocytes and macrophages to produce proinflammatory cytokines [8-10]. The mitogen‑activated protein kinase (MAPK) family consists of extracellular signal‑regulated kinase (ERK), p38 and c‑Jun N‑terminal kinase (JNK) [11-13]. MAPKs are serine‑threonine kinases that mediate intracellular signaling associated with various cellular activities, including cell proliferation, differentiation, cell death and inflammation [11, 12].
Nuclear factor‑κB (NF‑κB) regulates the transcription of numerous genes involved in immunity, inflammation and protection from programmed cell death [14, 15]. The activation of NF‑κB is mediated by various upstream protein kinases, including MAPKs [16, 17]. NF‑κB p50/p65 is bound to inhibitory inhibitor of κB (IκB) proteins in the cytoplasm. The cytoplasmic NF‑κB/IκB complex is activated by phosphorylation; in the case of IκB‑α, this modification occurs at serines 32 and 36 by the IκB kinase (IKK) complex. A free p50/p65 NF‑κB complex translocates from the
44
cytosol to the nucleus, and ultimately binds to the promoter region of target genes encoding various proinflammatory factors [18-22].
Most part of the Hibiscus syriacus including flower, fruit, root stem and bark are widely used for the medicinal purpose in the eastern and southern Asia. The pharmacological effect was used to treat for tinea, eczema, scabies and dystentery as traditional medicine. According to the recent studies root bark extracts of the H. syriacus has shown anticancer, antioxidant, human neutrophil elastate inhibitory activity, monoamine oxidase inhibitory activity and antidepressant activity [23-26]. Therefore for the first time, we evaluated the effect of anthocyanin-rich extract of H. syriacus variety Pulsae (PS), which has purple petal color on the lipopolysaccharide (LPS)-induced expression of proinflammatory mediators and the molecular mechanisms underlying these activities in RAW264.7 macrophages. PS significantly downregulates the mRNA and protein expression of iNOS, COX-2 and TNF-α with a consequent diminishing of NO, PGE2 as well as proinflammatory cytokines production
in LPS stimulated RAW264.7 macrophage through inhibition of NF-κB pathway. Additionally, PS also diminished the LPS induced zebrafish (Danio rerio) larvae neutrophil and macrophage recruitment.