저작자표시-비영리-변경금지 2.0 대한민국 이용자는 아래의 조건을 따르는 경우에 한하여 자유롭게 l 이 저작물을 복제, 배포, 전송, 전시, 공연 및 방송할 수 있습니다. 다음과 같은 조건을 따라야 합니다: l 귀하는, 이 저작물의 재이용이나 배포의 경우, 이 저작물에 적용된 이용허락조건 을 명확하게 나타내어야 합니다. l 저작권자로부터 별도의 허가를 받으면 이러한 조건들은 적용되지 않습니다. 저작권법에 따른 이용자의 권리는 위의 내용에 의하여 영향을 받지 않습니다. 이것은 이용허락규약(Legal Code)을 이해하기 쉽게 요약한 것입니다. Disclaimer 저작자표시. 귀하는 원저작자를 표시하여야 합니다. 비영리. 귀하는 이 저작물을 영리 목적으로 이용할 수 없습니다. 변경금지. 귀하는 이 저작물을 개작, 변형 또는 가공할 수 없습니다.
농학박사학위논문
GC-MS/MS와 LC-MS/MS를 이용한
농식품 중 500개 잔류 농약 성분의
다성분 신속동시 분석 연구
Simultaneous and Rapid Analysis of
500 Pesticide Multiresidues in Agricultural Products
Using GC-MS/MS and LC-MS/MS
2017년 8월
서울대학교 대학원
농생명공학부 응용생명화학전공
이 종 화
A Dissertation for the Degree of Doctor of Philosophy
Simultaneous and Rapid Analysis of
500 Pesticide Multiresidues in Agricultural
Products Using GC-MS/MS and LC-MS/MS
August 2017
Jonghwa Lee
Applied Life Chemistry Major
Department of Agricultural Biotechnology
Seoul National University
Abstract
A multiresidue method for the simultaneous and rapid analysis of 500 pesticides in representative agricultural produce (brown rice, orange, spinach, and potato) was developed using a modified QuEChERS procedure combined with gas and liquid chromatography–tandem mass spectrometry (GC-MS/MS and LC-MS/MS). Multiple reaction monitoring parameters (e.g., collision energy, precursor and product ions) in MS/MS were optimized to achieve the best selectivity and sensitivity for a wide range of GC or LC-amenable pesticides. For the GC analysis of 360 pesticides, a short (20 m) microbore (0.18 mm i.d.) column resulted in better signal-to-noise (S/N) ratio with reduced analysis time than a conventional narrowbore column. The use of pulsed pressure injection was also effective to increase the peak response and S/N ratio. After changing a new liner, the priming injection, which caused by masking effect was suggested in order to consistent peak sensitivity. In LC-MS/MS analysis of 332 pesticides, the optimal mobile phase and injection volume was evaluated to acquire high sensitivity and reliable results. The limit of quantitation was <0.01 mg/kg, and the correlation coefficients (r2) of matrix-matched standards were >0.99 within the range of 0.0025–0.1 mg/kg. Acetonitrile with 0.1% formic acid without additional buffer salts was used for pesticide extraction, whereas only primary–secondary amine was used for dispersive solid phase extraction cleanup, to achieve good recoveries for most of the target analytes. The method was validated according to the European Union SANTE guidline.
The recoveries ranged from 70 to 120% with relative standard deviations of ≤20% at 0.01 and 0.05 mg/kg spiking levels (n = 6) in all samples, indicating acceptable accuracy and precision of the method. The results of matrix effects
were indicated that mainly signal enhancements were observed in GC-MS/MS but in the LC-MS/MS, the evenly spread across the ranges and little difference within the samples. The optimized method was successfully applied to the analysis of pesticide residues in real samples.
Key Words: apple, brown rice, GC-MS/MS, LC-MS/MS, orange, pesticide multiresidues, potato, QuEChERS, spinach
Student Number: 2013-30354
Table of Contents
Abstract……….……..………i
Table of Contents………..iii
List of Tables……….………..viii
List of Figures………..……….…x
Introduction……….…...1
Introduction to pesticide multiresidue analysis...1
Instrumental analysis in pesticide multiresidue………...2
Principle of triple quadrupole-mass spectrometry…....………...3
Gas chromatography-triple quadrupole mass spectrometry...10
Liquid chromatography-triple quadrupole mass spectrometry...14
Definition of terms relating to mass spectrometry…………...20
Trends in sample preparation method……….…...25
QuEChERS methodology….………..…...35
Validation of analytical method………..…...42
Matrix effect………...………..…...49
The purpose of the present study……….…...58
Part 1 : Rapid and Simultaneous Analysis of 360 Pesticides
in Crops Using Microbore GC-MS/MS
Materials and Methods..……….……….61
Chemicals and consumables ………...61
Analytical standard……...61
Selection of GC column and instrumental conditions……...62
Automated adjustment of retention time and retention indices…… 63
Pulsed pressure injection (PPI) parameters. ………...64
Evaluation of peak sensitivity and column efficiency…...64
Optimization of sample preparation………...65
Final optimized sample preparation method……...66
Priming effects.………..……….67
Validation of analytical methods...67
Matrix effects (ME)………...68
Results and Discussion…..……….……..70
Selected reaction monitoring (SRM) optimization... 70
Retention time adjustment by AART …………...71
Selection of GC Column ……….…………...75
Effect of pulsed pressure injection (PPI)………...………80
Comparison of column efficiency. …...……….……….………80
Enhancement of peak sensitivity on a microbore column with pulsed pressure injection………83
Priming effects…...88
Modification of Sample Extraction Solvent …………...94
Optimization of Sample Cleanup with dSPE…………...…………100
Method Validation……….…...……….………..….……108
Matrix Effect (ME)……….…………...114
Part 2 : Rapid and Simultaneous Analysis of 332 Pesticides in Brown
Rice, Orange, and Spinach Using LC-MS/MS
Materials and Methods..…………...……….……....121
Chemicals and Consumables...121
LC-MS/MS instrumentation…...121
Final sample preparation procedure…...122
Validation of analytical method...123
Matrix effect………...124
Results and Discussion…..……….…..125
MRM optimization ………..………...125
Selection of mobile phase………...126
Optimization of injection volume ………...127
Optimization of cleanup procedure...132
Method validation………...135
Matrix effects………...142
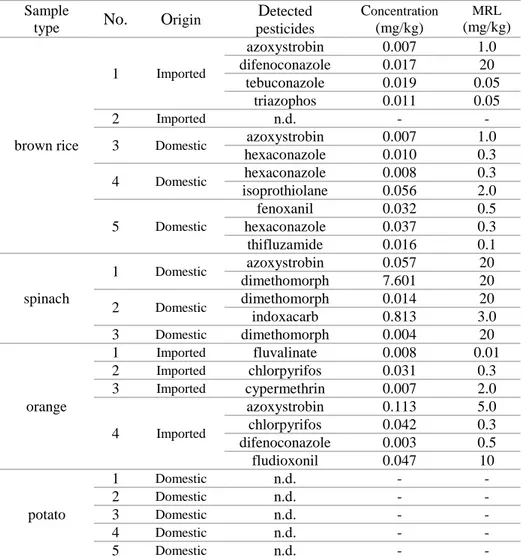
Real sample analysis ………...146
Conclusion………..149
Supplementary Materials………..150
References……….…201
Abstract in Korean……….……215
Literature Contributions ………..217
viList of Tables
Table 1. Overview of published studies in recent three years for
the analysis of pesticides multiresidue using
QuEChERS methodology……….. 27
Table 2. The representative QuEChERS methods………. 37
Table 3. The EN 15662 method guidelines for the addition of
water into commodities with low water content………... 41
Table 4. The criteria of accuracy or trueness in representative
organizations. The criteria indicate Range of mean
recovery, % (relative standard deviation, %)…………... 45
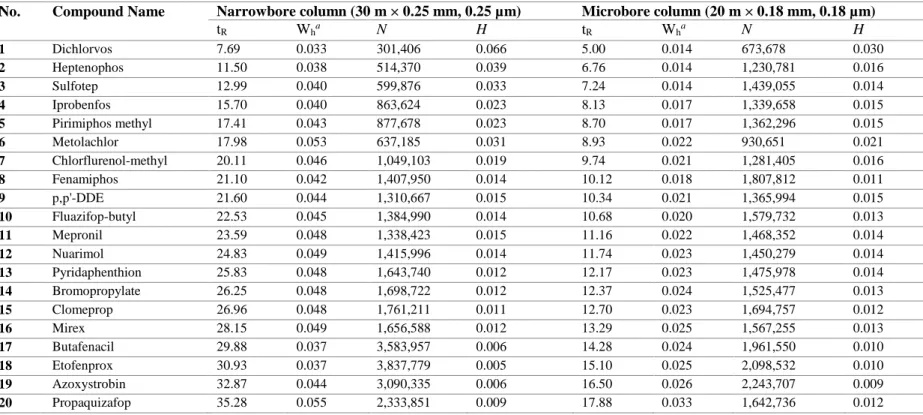
Table 5. Comparison of column efficiency for representative
compounds using narrowbore vs. Microbore column (“N” means number of theoretical plate and “H” is
height equivalent to a theoretical plate, n = 3)………… 82
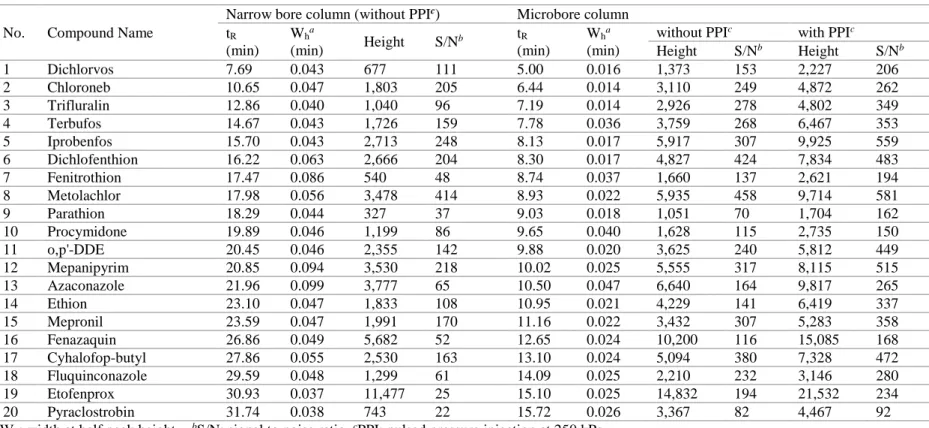
Table 6. Comparison of peak width, height and S/N ratio for
representative compounds using narrow bore vs.
microbore column [with or without PPI (n=3)]………… 84
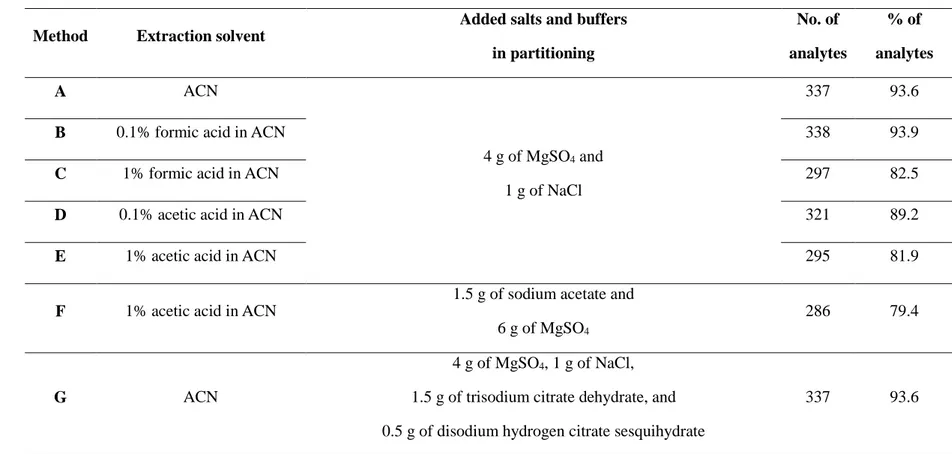
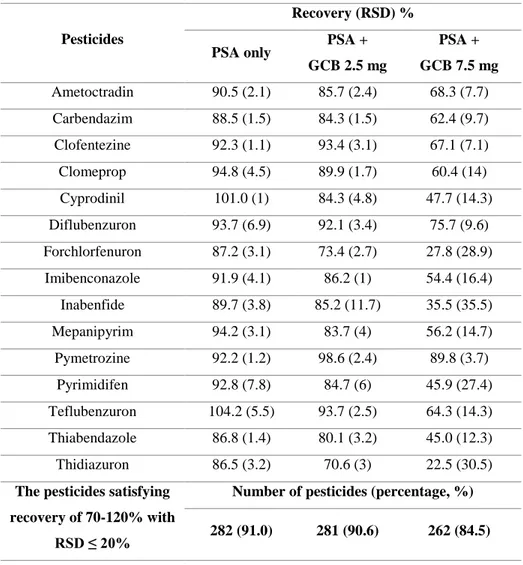
Table 7. Number of Pesticides and Percentages with Recoveries
between 70 and 120 % with RSD ≤ 20% in Recovery Results from Different Extraction Solvents for Brown
Rice Sample (Spiked at 0.01 m/kg, n = 3)……… 95
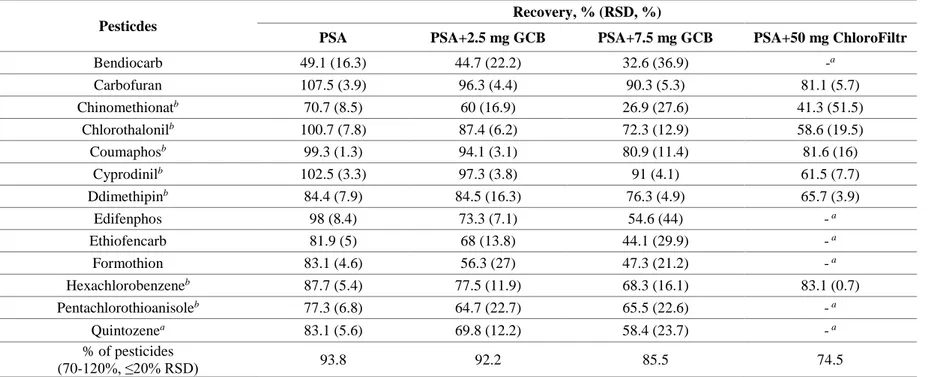
Table 8. Recovery Results for Representative Pesticides
Including Planar Pesticides in Spinach Matrix (0.01 mg/kg Spiking Level, n = 3) from Cleanup with
Different Types of dSPE Sorbents………. 104
Table 9. The concentrations (mg/kg) of pesticides detected in
real sample analysis……… 113
Table 10. Recoveries of representative pesticides from the
cleanup with different types of dSPE sorbents in
spinach (100 ng/g spiking level, n = 3)……… 134
Table 11. Results of real sample analysis by LC-MS/MS in a total
of 16 apple samples. The detected pesticides were summarized with maximum residue limit in Korea and
QC results of each pesticides………..……… 148
List of Figures
Figure 1. The principle of the MS/MS technique separating and
identifying by the fragmentation …….……….. 6
Figure 2. Main scheme of triple quadrupole in GC-MS/MS... 8
Figure 3. A schematic diagram of the GC-MS/MS……… 12
Figure 4. Schematics of (A) electrospray ionization (ESI) and
(B) atmospheric pressure chemical ionization (APCI)
sources (Particle-Sciences, 2009)……….... 18
Figure 5. Matrix effect in GC inlet……….. 52
Figure 6. Factor for signal suppression in LC-MS/MS (ESI)…… 56
Figure 7. Distribution of retention time differences (predicted
vs. observed retention times)………... 72
Figure 8. SRM TIC of 360 pesticides at 0.01 µg/mL solvent
standard mixture (a) and individual chromatograms of profuralin (b), fenthion (c), procymidone (d), and bifenthrin (e) corresponding to 30-m narrowbore (I)
and 20-m microbore column (II)……… 78
Figure 9. Influence of pulsed pressure injection on average peak
area and height of 356 target analytes (n = 3). A 50 ng/mL of solvent standard mixture (1 μL) was injected, and the results obtained from non-pulsed pressure injection were set to 100%... 80
Figure 10. Representative GC-MS/MS chromatograms on a
30-m narrow bore vs. a 20-30-m 30-microbore colu30-mn…………. 86
Figure 11. Priming effects after replacing a new inlet liner in GC: relative peak area of solvent standard mixture (0.1 mg/kg) before (gray bars) and after (dark gray bars) spinach extract injections. The intensities were compared after each area was normalized by the area of the first injection as 100%. The top arrow indicates
the sequence of sample injection………. 90
Figure 12. Relative peak area of solvent standard mixture at 0.1
mg/kg after orange extracts were injected for priming effects. Average peak area of 360 pesticides in the first
injection after replacing a new liner was set to 100%.. 94
Figure 13. SRM chromatograms of pencycuron (A), simetryn
(B), terbutryn (C) and flusilazole (D) in different extraction solvents: (1) 0.1 % formic acid; (2) 1% formic acid; (3) 1% acetic acid; (4) 1% acetic acid with AOAC buffered methods at 0.01 mg/kg
spiking……….. 98
Figure 14. Final extracts after cleanup by different cleanup
absorbents : (A) extract with 25 mg of PSA; (B) extract with 25 mg of PSA and 2.5 mg of GCB; (C) extract with 25 mg of PSA and 7.5 mg of GCB; (D)
extract with 50 mg of PSA and ChloroFiltr……… 102
Figure 15. Distribution of relative peak area (average of 360
analytes) during 50 consecutive injections of spinach
matrix matched standard at 0.01 mg/kg………. 106
Figure 16. Percentages of pesticides satisfying the recovery rates
of 70-120% and RSD≤20% at 0.01 and 0.05 mg/kg
spike levels, using the optimized method in this study... 110
Figure 17. Distribution of matrix effects (MEs) in each
commodity. The MEs were assessed by the slope ratios
of the matrix-matched calibration curves to
solvent-only calibration curves……… 116
Figure 18. Relative peak area of the methanol-based mobile
phase (A) compared with acetonitrile-based mobile phase (B) at solvent standard mixture of 100 ng/g (n = 5, 100 ng/g). The graph were plotted against the number of pesticides ranked by relative peak area of
(A)………. 128
Figure 19. Peak area and repeatability by injection volume (n =
5)……… 130
Figure 20. Distribution of limit of quantitation in LC-MS/MS
analysis………. 136
Figure 21. Percentages of pesticides satisfying the recovery rates
of 70-120% and RSD≤20% at 0.01 and 0.05 mg/kg
spike levels, using the optimized method in this study 140
Figure 22. Graphical comparison of the absolute values of matrix
effects (ME) results……….. 144
Introduction
Introduction to pesticide multiresidue analysis
Pesticide residue level of agricultural produce is one of the most important issues because it is directly related with human health safety. In addition, regulating pesticides among countries around the world is sensitive issue since different countries have different regulations, requirements and permissible limits in terms of pesticides residue. To ensure that levels of pesticide residues on grains, fruits, and vegetables meet current tolerances or maximum residue limits (MRLs) of individual countries, they are strictly monitored by authorities. Considering that new agrochemical pesticides are introduced to the market each year, they must be strictly evaluated by governments to make sure that they meet current health, environment and safety standards before the new products are available to farmers. Therefore, the rapid and effective analytical methods, multiresidue pesticide screening can play a significant role in mornitoring the unknown pesticides in imported or exported food matrices (i.e. vegetables, fruits and meat).
Pesticide multiresidue analysis is a procedure of the identifying and quantifying the several or hundreds of pesticide residues at the same time. It is a notoriously difficult, laborious and time-consuming work to ensure the accuracy and reliable data, detecting very low levels of pesticides in various sample matrices. Because a large number of pesticides potentially has been used during the harvest of agricultural produce, the development of multiresidue methods, which can provide quantitative and qualitative information simultaneously for many compounds is required. (Tsipi et al., 2015).
Instrumental analysis in pesticide multiresidue
Conventional gas chromatography (GC) and high performance liquid chromatography (HPLC) have several limitations in fast and simultaneous multiresidue analysis. Extensive partitioning and cleanup procedures are also required to remove coextractives for baseline separation of peaks on GC or HPLC, often causing low recoveries and precisions by loss of analytes.
Mass spectrometry (MS) could be contributed for qualitative and quantitative analysis by specific fragmentation because it could overcome the drawback of conventional instrumental methods such as GC-ECD, NPD, or HPLC. In the screening, identification, and quantification of complicated organic pollutant, the combination of chromatography and MS has become one of the powerful tools (Lin et al., 2009).
GC or LC combined with tandem mass spectrometry (MS/MS) has played a vital role recently in monitoring multiresidue pesticides in food matrices. Multiple reaction monitoring (MRM, operating as “molecular cleanup”) by MS/MS enables the simultaneous analysis of hundreds of pesticides (Alder et al., 2006; Rajski et al., 2013) in a short time with high sensitivity and selectivity. Gas chromatography mass spectrometry (GC–MS) is mainly used for relatively volatile, non-polar, and thermally stable compounds (Lin et al., 2009). On the other hand, liquid chromatography mass spectrometry (LC–MS) is useful for nonvolatile, thermal unstable, and polar compounds without derivation. This paragraph describes recent advances in MS/MS including principle of tandem mass spectrometry, GC-MS/MS, and LC-MS/MS.
Principle of triple quadrupole-mass spectrometry
Mass spectrometry (MS) can separate organic molecules according to their molecular weight and enable its detection with high sensitivity. It is not only regarded as having good selectivity, but also a very sensitive instrument. The principle of the MS/MS technique is illustrated in Figure 1. The mass spectrometer aim to boost the detection of low amounts of target compounds, while also to identify the species corresponding to each chromatographic peak through its unique mass spectrum (Sargent [ED], 2013).
A triple quadrupole (TQ) mass spectrometer, is a kind of tandem mass spectrometer that is consisted of two mass analyzers of quadrupole type. with a collision cell. Tandem mass spectrometry, also known as MS/MS or MS2,
involves multiple steps of mass spectrometry selection, with some form of fragmentation occurring in between the stages (IUPAC, 1997). This configuration is often abbreviated Q1, Q2, and Q3. As seen in Figure 2, the first and third quadrupoles act as a mass filters, while the second quadrupole fragment the precursor ion using a collision gas (usually N2 or Ar) (Banerjee
and Utture, 2015).
Essentially, the triple quadrupole mass spectrometer is operated under the same principle with the single quadrupole mass analyzer. The quadrupole analyzer has capability to detect and measure the abundance of target ions. These gases, pass through the electrically connected four parallel, cylindrical metal rods (quadrupole) in order to reach the detector. The radio frequency (RF) potential associated with the collision cell allows all ions that were selected for to pass through the quadrupole (Dass, 2007). In some instruments, the normal quadrupole collision cell has been replaced by hexapole (Kaplan et al., 2008; Rostom et al., 2000) or octopole collision cells(Håkansson et al., 2003) in order to improve efficiency.
Unlike single MS instruments, MS/MS techniques allow for mass analysis to occur in a sequential manner in different regions of the instruments. The TQ enable in accordance with the structurally continuous arrangement, due to ionization, primary mass selection, fragmentation by collision induced dissociation (CID), mass analysis of fragments, and detection occurring in separate segments of the instrument (Johnson et al., 1990). In addition, the triple quadrupole mass spectrometer has many advantages including cheaper price (cheaper than two individual single quadrupole instruments), easy to operate, and they are highly efficient(Dass, 2007).
In MS/MS, the main function are scanning of product ions, precursor ion, neutral loss, selected reaction monitoring (SRM), and multiple reaction monitoring (MRM), as well as single Q1 or Q3 scan. Banerjee and Utture (2015) described the operating principle each scan mode as follows. The product ion scan mode: A specific ion which will be fragmented in Q2 (collision cell) is selected in the first quadrupole (Q1). Then, the third quadrupole (Q3) scan the all m/z range with given spectrum and information on the sizes of the fragmented ions. At this time, the specific fragmentation patterns appear depends on the collision energies. Most abundant product ion and the CID voltage are generally chosen for quantitation. The precursor ion scan mode: certain product ion is fixed in Q3, and the precursor masses, which can produce the product ion are scanned in Q1. The neutral loss scan: both Q1 and Q3 are scanned together, but with a constant mass offset. This allows the selective recognition of all ions, which, by fragmentation, leads to the loss of a given neutral fragment (e.g., H2O, NH3). SRM/MRM: In this method, both Q1 and
Q3 are set to a selected ion, allowing only a distinct fragment ion from a certain precursor ion to be detected. This method results in increased sensitivity. If more than a single mass are set for Q1 and/or Q3, this configuration is called
MRM. When triple quadrupole is operated with MRM mode, the simultaneous detection in a low level of concentration in a one run is possible.
During the last decade, GC and LC–MSMS triple quadrupole mass spectrometer have become the standard for quantitative multiresidue methods for the analysis of pesticides and other residues. The main benefits of triple quadrupole are increased selectivity, improved signal-to-noise (S/N) ratio, lower limits of quantitation (LOQ), and improved accuracy. The triple quads have gained their popularity due to the increased scan speed and robustness of the instruments, allowing the simultaneous detection of several hundreds of analytes in routinely analysis.
Figure 1. The principle of the MS/MS technique separating and identifying by the fragmentation
5
Figure 2. Main scheme of triple quadrupole in GC-MS/MS (www.shimadzu.com).
Q1
Q2
Q3
Collision cell
EI
Source
9Gas chromatography-triple quadrupole mass spectrometry (GC-MS/MS) It is necessary to separate the target analyte from the matrix components, which is containing thousands of other different molecules. Gas chromatography (GC) has been widely used to separate the target compounds from food matrices. Not long ago, most pesticide residue analysis using GC has been used in combination with electron captured detector (ECD), nitrogen phosphorous detector (NPD), and flame ionization detector (FID). This combination of detectors has been contributed as a popular instrumental configuration for analysis pesticides in laboratories that are not equipped with MS(Aysal et al., 2007).GC in itself, has powerful separation performance due to the relatively narrow and sharp peak shape, allowing the easy identification and measurement for the individual compounds. Even though these conventional techniques have been considered as specific detection, the confirmation of results is limited due to the matrix interference and needs for multiresidue analysis.
Recently, it is well known that the development of MS technique could provide higher sensitivity and selectivity for pesticide analysis. Simultaneous determination and confirmation of pesticide residues could be achieved by GC equipped with tandem mass spectrometry (MS/MS) in one analytical run, which improves the analytical accuracy and shortens the analytical time (Lin et al., 2009). Figure 3 shows structure of general GC-MS/MS. After separation by gas chromatography, the anaytes continues to enter the mass spectrometer. The analyts particles are then ionized by a variety the type of mass spectrometer such as EI, CI or NCI. The ionized anaytes has specific fragmentation patterns, out of fragmented ions, the precursor ion is selected in Q1. The selected (filtered by radio frequency) precursor ion undergo one more fragmentation by collision energy (eV) in collision cell/Q2. The produced (or fragmented) ion is called to product ion, then specific product ion is filtered again in Q3. Most of MS
analyzers can be used to consist a tandem mass spectrometry, the use of MS/MS has been already introduced in routine analysis of pesticide residues.
For the GC analysis, a narrowbore (0.2 mm ≤ i.d. < 0.3 mm)(Mastovská and Lehotay, 2003) column such as a 30-m column with 0.25 mm i.d. has been widely used for the separation of various pesticides. However, it generally requires a >30 min run time for one sample. For faster analysis, a low pressure-GC method uses a short megabore column (e.g., 10 m × 0.53 mm i.d.) for multiresidue analysis with the advantage of large sample loading capacity, but it requires an additional restriction column to maintain positive pressure in the inlet. In addition, the negative influence on the vacuum state of the mass spectrometer caused by the large volume of carrier gas flow may give rise to increased detection limit (Rossi et al., 1992). On the other hand, a microbore column (0.1 mm ≤ i.d. < 0.2 mm) has not been widely studied for the fast and simultaneous analysis despite its good performance with higher signal-to-noise (S/N) ratio (Mastovská and Lehotay, 2003). The column also provides increased efficiency and higher sensitivity by reducing resistance to mass transfer (Banerjee and Utture, 2015). Furthermore, it can provide enough linear velocity with low carrier gas flow for narrow chromatographic bands. However, it should be noted that narrow peaks should be supported by a detector (e.g., MS/MS) with a fast scan speed or cycle time (or loop time) because it requires sufficient data points across the peak width for reliable and repeatable chromatographic data. The GC-MS/MS instruments recently released are known to be capable of producing consistent chromatographic data by rapidly providing sufficient points for narrow peaks while maintaining quantitative accuracy.
Figure 3. A schematic diagram of the GC-MS/MS.
Liquid chromatography-triple quadrupole mass spectrometry
Compared with GC, LC methods to analyze pesticide residues were applied more rarely in the past, because traditional ultra violet detector (UVD) and fluorescence detectors (FLD) usually have less selective and sensitive. Recently, MS (quadrupole, ion trap, or time-flight mass analyzers) equipped with electrospray ionization (ESI) or atmospheric pressure chemical ionization (APCI) have become widely regarded as the preferred techniques for the qualification and quantification.
For GC analysis, the target compounds must be volatile and thermally stable, but LC can analyze the non-polar compounds as well as thermally labile pesticides. Actually, the high number of pesticides belong to carbamates, urea herbicides, benzoylurea insecticides, and benzimidazole fungicides are known to more amenable to LC (Sannino, 2008). In addition, the need to analyze the more polar pesticides (e.g., glyphosate, glufosinate, and 2, 4-D) is one of the main reasons for frequent use of LC-MS/MS than GC-MS or GC-MS/MS. The wide scope of pesticides covered and simple sample preparation is the main reason why LC-MS/MS is more frequently used for the detection, identification, and quantification of pesticides in food nowaday(Stachniuk and Fornal, 2016).
LC-MS/MS has become the first choice for detecting trace level of pesticide residue in recent with the availability of various LC separation techniques including reverse phase, normal phase, hydrophilic interaction liquid chromatography, and/or ion chromatography. Also, many kinds of analytical columns having different column length, inner diameter, particle size, types of absorbents can accelerate the applicability of LC-MS/MS. Besides column, the capability of modifying the mobile phase and various flow rate and pressure like ultra-pressure liquid chromatography (UPLC) can be contribute to the usability.
In GC-MS ionization technique, the disadvantage of electron ionization (EI) is a strong ionization procedure. In many case, the molecular ion formation is not available due to extensive fragmentation (-70 eV). Thus, the most valuable information of the molecular weight of the unknown compound is difficult to obtain, In this case, the structure can be determined only by using the ion fragment pattern(Konstantinou, 2015).
However, LC-MS/MS equipped with electrospray ionization (ESI) or atmospheric pressure chemical ionization (APCI), which gives a more soft ionization and selective fragmentation, is more useful to understand the molecular weight as well as most common MS analyzers. Because of the characteristic soft ionization, the ionized molecular ion could survive in ionization process, while the EI, which is type of strong ionization, most of the molecular ion is broken down owing to high electron energy.
In addition, it can be applied for highly polar, volatile, or thermally unstable compounds. The ESI and older but improved APCI are the most commonly used ionization techniques throughout the world in LC-MS applications for pesticides. The schematics of ESI source and APCI source are present in Figure 4. It is confusable, both techniques are basically belongs to atmospheric pressure ionization (API) techniques. As the name suggests, API firstly ionizes analyte under atmospheric pressure conditions, which makes it especially useful for removing solvents outside a vacuum, then mechanically and electrostatically separated from neutral molecules. The follows explanations were from the information of instrument by manufacturer Shimadzu (Introduction to LC-MS, 2017). ESI generates ionized ions in solution state before it reaches the mass spectrometer. Next, the ESI pulls sample solutions to the tip of a capillary tube adding a high voltage of about 3 to 5 kV. A nebulizer gas (nitrogen) surrounds the capillary tube to spray the
sample. This makes a fine mist of charged droplets with the same polarity as the applied voltage. While these charged particles are moving, the solvents continue to evaporate, thereby increasing the electric field on the decreased droplet surface. When the mutual repulsive force of the charges exceeds the liquid surface tension, then fission occurs. It is thought that as this evaporation and fission cycle is repeated, the droplets eventually become small enough that the sample ions are released into the gas phase (Introduction to LC-MS, 2017).
The other ionization method is APCI, which is a type of chemical ionization, just like CI for GC-MS. Although the ion source design is similar to ESI, the ionization principle is quite different. APCI vaporizes solvent and sample molecules by spraying the sample solution into a heater (400 °C) using a gas (N2). Solvent molecules are ionized by corona needle to generate stable
reaction ions. The protons are transferred between these reaction ions and sample molecules to ionize sample molecules by either adding (+e) or removing a proton (-e). These ion-molecule reactions are known to involve several patterns, such as proton-transfer reactions and electrophilic addition reactions (Introduction to LC-MS, 2017). Because ESI ionize the molecule using solution of mobile phase as described above, the mobile phase selection can affect peak response, and is an important consideration during method development (Particle-Sciences, 2009).
The analysis of residues in trace levels has been a great challenge in terms of reliability of data for regulatory compliance. LC-MS/MS along with GC-MS/MS has become the main choice for conducting trace level determination of pesticide residue in fruits and vegetables. Even though its prices are not cheap, when the think about alternative benefits, it is valuable and not so much expensive. Because these techniques give many revolutionary
advantages including simultaneous determination, high sensitivity and selectivity, and time-saving with simple sample preparation.
Figure 4. Schematics of (A) electrospray ionization (ESI) and (B) atmospheric pressure chemical ionization (APCI) sources (Particle-Sciences, 2009) .
(A) ESI ionization
(B) APCI ionization
Definitions of terms relating to mass spectrometry
While new technology deal with mass spectrometry being released in every year, new terminologies also has been produced by many researchers. Sometimes we face to trouble in communication at the meeting with other researcher or reading a published paper. The use of inaccurate terminology could make an error in communication. To avoid confusing in using the terminologies, the frequently used terminologies in mass spectrometry are summarized based on the document from IUPAC Recommendations in 2013 (Murray Kermit et al., 2013).
- Exact mass; “Calculated mass of an ion or molecule with specified isotopic composition.” The exact mass of an isotopic species (more appropriately, the
calculated exact mass) is obtained by summing the masses of the individual isotopes of the molecule. For example, the exact mass of water containing two hydrogen (1H) and one oxygen (16O) is 1.0078 + 1.0078 + 15.9949 = 18.0105.
When an exact mass value is given without specifying an isotopic species, it normally refers to the most abundant isotopic species.
- Accurate mass “Experimentally determined mass of an ion of known charge”
It can be used to determine elemental composition to within limits defined by both the accuracy and precision of the measurement. Accurate mass and exact mass are not synonymous.
- Nominal mass: “Mass of a molecular ion or molecule calculated using the isotope mass of the most abundant constituent element isotope of each element rounded to the nearest integer value and multiplied by the number of atoms of
each element.” For example, H = 1, C = 12, O = 16, etc. The nominal mass of H2O is 18.
- Monoisotopic mass: “Exact mass of an ion or molecule calculated using the mass of the most abundant isotope of each element.” For example, hydrogen (H) is 1.007825, carbon (C) is 12.00000, and oxygen (O) is 15.99491. For typical organic compounds, where the monoisotopic mass is most commonly used, this also results in the lightest isotope being selected.
- Average mass: “Mass of an ion or molecule weighted for its isotopic composition.”
- GC-MS? or GC/MS? (hyphenate or slash ?);
The hyphen (-), or alternatively the slash (/, forward stroke), can be used to indicate combined methods such as gas chromatography separation combined with mass spectrometry detection. Gas chromatography-mass spectrometry or alternatively as gas chromatography/mass spectrometry (The corresponding abbreviations are GC-MS or GC/MS).First use to express the combination of separation methods are the hyphen in 1960s, next is the slash in 1970s, and “hyphenated techniques” in 1980s. Prefer expression is differ from journal. “Rapid Communications in Mass Spectrometry” and “Journal of Chromatography” are the slash (/) recommend whereas IUPAC recommend the hyphen (-). Currently, hyphens and slashes are used interchangeably.
- Precursor ion or Progenitor ion: “Ion that reacts to form particular product ions or undergoes specified neutral losses.” The “Parent ion” terminology is deprecated. The reaction can be of different types including unimolecular
dissociation, ion/molecule reaction, change in charge state, possibly preceded by isomerization.
- Product ion: “Ion formed as the product of a reaction involving a particular precursor ion.”The “Daughter ion” terminology is deprecated.
- Selected reaction monitoring (SRM): “Data acquired from one or more specific product ions corresponding to m/z selected precursor ions recorded via two or more stages of mass spectrometry.”
- Multiple reaction monitoring (MRM): “Application of selected reaction monitoring to multiple product ions from one or more precursor ions.” This term should not be confused with consecutive reaction monitoring, which involves the serial application of three or more stages of selected reaction monitoring.
- m/z: Abbreviation representing the dimensionless quantity formed by dividing
the ratio of the mass of an ion to the unified atomic mass unit, by its charge number (regardless of sign). The abbreviation is written in italicized lowercase letters with no spaces. Mass-to-charge ratio has been used occasionally for the horizontal axis in a plot of a mass spectrum, although the quantity measured is not the ion’s mass divided by its electric charge (SI units kg C–1). However, m/z
is recommended as an abbreviation to represent the dimensionless quantity that is used almost universally as the independent variable in a mass spectrum. The “Mass-to-charge ratio” and the “thomson (Th) unit” are deprecated.
- Electron ionization (EI): Ionization that removes one or more electrons from
an atom or molecule through interactions with electrons that are typically accelerated to energies between 10 and 150 eV. The “electron impact ionization” is deprecated.
- Electrospray ionization (ESI): Spray ionization process in which either
cations or anions in solution are transferred to the gas phase via formation and desolvation at atmospheric pressure of a stream of highly charged droplets that result from applying a potential difference between the tip of the electrospray needle containing the solution and a counter electrode. (electro-spray, false expression)
- Collision-induced dissociation (CID) = collisionally activated dissociation:
“Dissociation of an ion after collisional excitation.”
- Centroid acquisition: Procedure of recording mass spectra in which an
automated computer-based system detects peaks, calculates the centroid based on the average m/z value weighted by the intensity, and assigns m/z values based on a calibration file. Only the centroid m/z value and the peak magnitude are stored.
- Profile mode: Method for acquiring a mass spectrum where each peak is
displayed as a curve, with the data points defining the curve corresponding to the signal intensities at each particular m/z value.
- Linearity of calibration curve, R2
? or r2?: Coefficient of determination,
pronounced "R squared". It indicates the proportion of the variance in the
dependent variable that is predictable from the independent variable. The r2:is used for a simple linear regression whereas the R2 is used in for coefficient of multiple correlation (Coefficient_of_determination, 2017). Therefore, in pesticide quantitation, the coefficient of calibration curves expressed by the “r2” may be more proper because simple linear regression which is consist of area (height) and response has been used.
Trends in sample preparation method
Covering the wide scope of pesticides with simple sample preparation has been always challenges in pesticides multiresidue analysis. In recent years, many kinds of methods has been introduced to the development of new sample preparation method, which can save analysis time, labor, cost and environmental friendly. All of the methods has goals of improving the analytical performance of the procedure. This paragraph present the representative methods, has been widely used for pesticides multeresidue.
As the concern for food safety is increased, it has become an important issue to determining the residual pesticides accurately in the food. However, the complicated matrix of agricultural produce may affect the accuracy of the analysis (Liu, Liu, et al., 2016). The innovation of MS has revolutionized the extraction step for pesticide residue determination because it has great selectivity and sensitivity(Caldas et al., 2011).
For multiresidue sample preparation combined with the MS or MS/MS techniques, the QuEChERS (quick, easy, cheap, effective, rugged, and safe) method has widely replaced the traditional sample treatment methods such as column chromatography or solid phase extraction (SPE) since it was first introduced by Anastassiades and co-workers in 2003 (Anastassiades, Lehotay, et al., 2003; Anastassiades, Maštovská, et al., 2003). Especially, dispersive SPE (dSPE) cleanup is simple but offers high accuracy and precision (Alder et al., 2006; Chamkasem et al., 2013; Wong et al., 2010). The dSPE typically uses primary-secondary amine (PSA) sorbent for removal of some organic acids, sugars, and fatty acid (Anastassiades, Lehotay, et al., 2003; Lehotay, Maštovská, et al., 2005). Optional sorbents such as graphitized carbon black (GCB)(Li et al., 2009; Wong et al., 2010) and ChloroFiltr (Walorczyk et al., 2015a) can be applied with PSA to remove pigment such as chlorophyll or carotenoid.
Recently, multiwalled carbon nanotubes (MWCNT) were also introduced as cosorbents for reduction of matrix interferences (Han et al., 2017; Zou et al., 2016).
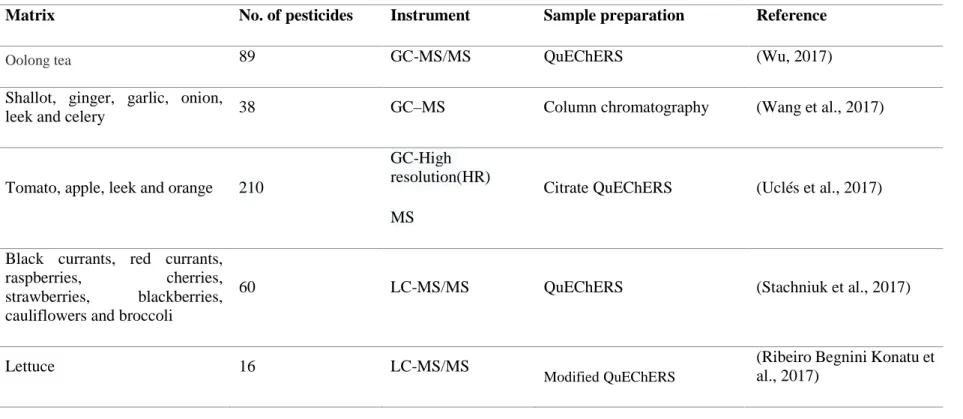
Currently, the combination of QuEChERS and the MS/MS technique is one of the most popular analytical approaches for the multiresidue analysis in various food matrices (Table 1) (Cho et al., 2016; He, Chen, et al., 2015; He, Wang, et al., 2015).
Table 1. Overview of published studies in recent three years for the analysis of pesticides multiresidue using QuEChERS methodology.
Matrix No. of pesticides Instrument Sample preparation Reference
Oolong tea 89 GC-MS/MS QuEChERS (Wu, 2017)
Shallot, ginger, garlic, onion,
leek and celery 38 GC–MS Column chromatography (Wang et al., 2017)
Tomato, apple, leek and orange 210
GC-High resolution(HR) MS
Citrate QuEChERS (Uclés et al., 2017)
Black currants, red currants,
raspberries, cherries, strawberries, blackberries, cauliflowers and broccoli
60 LC-MS/MS QuEChERS (Stachniuk et al., 2017)
Lettuce 16 LC-MS/MS
Modified QuEChERS
(Ribeiro Begnini Konatu et al., 2017)
Matrix No. of pesticides Instrument Sample preparation Reference
Atlantic salmon feeds 156 LC-QTOF
QuEChERS (Regueiro et al., 2017)
Baby food 16 (pyrethrins and
pyrethroids) LC-MS/MS salting-out assisted liquid–liquid
extraction
(Petrarca et al., 2017)
Globe artichoke leaves and fruits 35 GC and 63 LC GC-MS and LC–
MS/MS Modified QuEChERS (Machado et al., 2017)
Rice 58 LC–MS/MS
Modified QuEChERS (Liu et al., 2017a)
Fish samples 10 LC–MS/MS
SPE cleanup (Liu et al., 2017b)
Honeybees
84 LC-MS/MS and
GC-MS/MS QuEChERS (Kiljanek et al., 2017)
Fatty fish and liver matrix 340 LC–MS/MS
Modified QuEChERS (Kaczyński et al., 2017)
Oilseed samples 120 LC–MS/MS
Modified QuEChERS (Kaczyński, 2017)
Onion, wheat, potato and pea 11 LC–MS/MS modified QuPPe (Quick Polar Pesticides) protocols
(Kaczynski, 2017)
Matrix No. of pesticides Instrument Sample preparation Reference
Rice, wheat, and corn 124 GC-MS/MS
Modified QuEChERS (Han et al., 2017)
Honeybee wax 160 GC-MS/MS
Modified QuEChERS (García et al., 2017)
Leek 183 GC-MS/MS
Modified QuEChERS (Zou et al., 2016)
Straw Roughage 69
LC–MS/MS Modified QuEChERS (Zhang et al., 2016)
Honey 200
GC–MS/MS Modified QuEChERS (Shendy et al., 2016)
Orange juice 74
LC–MS/MS Modified QuEChERS (Rizzetti et al., 2016)
Apple, Citrus fruits, peanut,
spinach, leek, green tea 25 LC–MS/MS Modified QuEChERS ,
Multi-plug filtration cleanup (m-PFC)
(Qin et al., 2016)
Sugar beet and beet molasses 400 GC-MS/MS and LC– MS/MS
Modified QuEChERS, matrix
solid phase dispersion (MSPD) (Lozowicka et al., 2016)
Lettuce and orange 175 GC-MS/MS and LC–
MS/MS
Dutch mini-Luke extraction method
(Lozano, Kiedrowska, Scholten, de Kroon, de Kok and Fernandez-Alba, 2016)
Matrix No. of pesticides Instrument Sample preparation Reference
Olive oil, olives and avocado 67
LC–MS/MS
Modified QuEChERS, Enhanced Matrix Removal-Lipid (EMR)
(López-Blanco et al., 2016)
Chinese material medica 74
GC-MS/MS Acetate buffered QuEChERS (Liu, Li, et al., 2016)
Green tea leaves 101
GC–MS/MS Modified QuEChERS (Hou et al., 2016)
Cowpea 171
GC–MS/MS
Modified QuEChERS, Multi-walled carbon nanotubes (MWCNTs)
(Han, Song, et al., 2016)
Rice and Wheat Flour 100
GC–MS/MS Modified QuEChERS
(Grande-Martínez et al., 2016)
Edible oils (olive, soya and
sunflower) 165 LC–MS/MS Modified QuEChERS, EMR (Dias et al., 2016)
Brown rice, red pepper and
mandarin orange 113 GC–MS/MS EN QuEChERS (Cho et al., 2016)
Green tea, ginseng, gingko leaves, saw palmetto, spearmint, and black pepper
227
GC–MS/MS Modified QuEChERS (Chen et al., 2016)
Matrix No. of pesticides Instrument Sample preparation Reference
Avocado, orange, spinach,
honey, and hazelnut 381 LC–HRMS Modified QuEChERS (Yang et al., 2015)
Green soybean 100
GC–MS/MS Modified QuEChERS with
Z-Sep
(Walorczyk et al., 2015b) Lupin, white mustard and
sorghum 100 GC-MS/MS and LC–
MS/MS
Modified QuEChERS, ChloroFiltr
(Walorczyk et al., 2015a)
Tomatoes 109
LC–MS/MS Modified QuEChERS (Golge and Kabak, 2015)
The vegetable and fruit samples 60
UHPLC/TOF–MS SPE cartridge (PSA) (Sivaperumal et al., 2015)
tomato, red pepper, sour cherry, dried apples, black currant powder, raisins, wheat flour, rolled oats, and wheat germ.
120
GC–MS/MS Modified QuEChERS (Rasche et al., 2015)
Pollen 253
LC–MS/MS Modified QuEChERS (Vazquez et al., 2015)
Soya-based nutraceutical
products 177 GC–MS/MS Modified QuEChERS (Palenikova et al., 2015)
Matrix No. of pesticides Instrument Sample preparation Reference
Dietary supplements from grape
seed extracts 130 GC–MS/MS Modified QuEChERS (Nieto-García et al., 2015)
Chinese medicines 107
GC-NCI-MS/MS Modified QuEChERS (Nie, Miao, et al., 2015)
green tea 100
LC–MS/MS Modified QuEChERS
(Martínez-Domínguez et al., 2015)
Grape, mango, drumstick, bitter gourd, capsicum, curry leaf, and okra
296
LC–MS/MS buffered ethyl acetate extraction
method
(Jadhav et al., 2015)
Salmon 185
GC–MS/MS Modified QuEChERS (Holmes et al., 2015)
Leek and garlic 213
GC–MS/MS Modified QuEChERS (He, Chen, et al., 2015)
Black, green, oolong, and white Teas
227
GC–MS/MS Modified QuEChERS (Hayward et al., 2015)
Tobacco 259
GC–MS/MS Modified QuEChERS (Khan et al., 2015)
Matrix No. of pesticides Instrument Sample preparation Reference
Tomato 57
LC–MS/MS Modified QuEChERS (Andrade et al., 2015)
Chinese cabbage and cucumber 238
LC–MS/MS Modified QuEChERS (Zhao, Feng, et al., 2014)
Tomato and tomato products 186
GC–MS/MS Column chromarography,
m-PFC
(Zhao, Huang, et al., 2014) tomato, potato, spring onion and
orange 210 GC–MS/MS Modified QuEChERS (Ucles et al., 2014)
Cucumber and tomato 101
Modified QuEChERS, MNPs (Li et al., 2014)
GC-MS/MS and LC-MS/MS can generally play a complimentary role for each other because some unique compounds are only amenable to one of the techniques. A wide range of multi-residual analysis using LC-MS/MS has been carried out, but with GC-MS/MS not many studies on multi-residual analysis (over 300 pesticides) were not performed (Chamkasem et al., 2013; Cho et al., 2016; He, Chen, et al., 2015; He, Wang, et al., 2015; Holmes et al., 2015) while 541 pesticides were reported to be GC amenable on GC-MS by Pang et al. (2009). Recent study on multiresidues in botanical samples identified 310 pesticides with GC-MS/MS but considered each isomer peak as an individual compound (Hayward et al., 2013). In addition, not many studies have focused on the optimization of GC-MS/MS to increase the number of the GC amenable pesticides. Therefore, several GC and MS/MS conditions (e.g. column, selection of precursor and product ions) still need to be optimized for maximization of the number of GC amenable pesticides without compromising sensitivity and selectivity. (Cho et al., 2016)
QuEChERS methodology
The QuEChERS methods is most widely used method in recently, has been readily accepted as “golden standard” in multiresidue analysis. Nowadays, the more than the half of the published papers has been cited the QuEChERS method, and most of them used QuEChERS method or the modified methods. The name of the QuEChERS is an acronym word from "Quick, Easy, Cheap, Effective, Rugged, and Safe” that explains perfectly all the advantages of this method. A single step acetonitrile extraction and salting out by liquid–liquid partitioning to remove residual water in the sample with MgSO4 followed by a
dispersive solid-phase extraction (dSPE) clean-up is a key process.(Walorczyk, 2008). This approach can allow plenty of samples in a short time and extract a large number of pesticides with satisfactory efficiencies.
It was developed by Michelangelo Anastassiades in the years 2001 and 2002 during his post-doctoral visit at the USDA , Pennsylvania (USA) in the research group of Steven Lehotay(http://quechers.cvua-stuttgart.de, 2011). The original method was presented in June 2002 at the European Pesticide Residue Workshop (EPRW), in the following year, the detailed method was firstly published in 2003 (Anastassiades, Lehotay, et al., 2003). To improve the recoveries of pH-dependent analytes, the original method was modified in 2004 by Lehotay, Maštovská, et al. (2005). In this study, they employed the acetate buffering to achieve a pH value of 6 for all samples. This modification have been adopted as the Association of Analytical Communities (AOAC) Official Method(Lehotay, 2007). In 2008, the Anastassiades modified again the method to citrate buffered methods, resulted in the European Standard EN 15662 (2008).
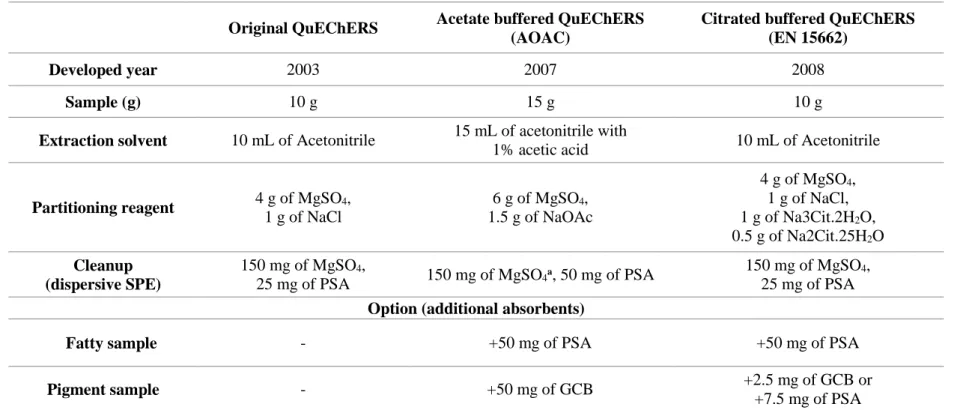
Table 2 summarized the details of the representative QuEChERS
methods. The original QuEChERS method was developed to allow the extraction of pesticide residues in fruits and vegetables having high ratio of water. Later, the original unbuffered method have been modified to AOAC methods in order to stabilization of acidic pesticides and protection of base-sensitive pesticides. The pH value in extraction procedure is approximately 4.8 due to strong acetate buffering. The citrate buffered method (EN 15662) was also introduced to adjust the pH in the first extraction/partitioning step to a compromise value of 5 to 5.5. In this range, most of the pesticides having the characteristics of acidic or alkaline-labile are sufficiently stabilized.
The one of the most innovative technology in QuEChERS methodology is the dSPE, which is easy and simple cleanup procedure. A sample extract is added to a centrifuge tube containing a relatively small amount of sorbent (e.g. PSA, C18, GCB) and the tube is shaken to increase distribute the SPE material and facilitate the clean-up process. Next, the separation of the sorbent is capable by centrifugation of the sample and the supernatant can be analyzed. The undesirable co-extracted compounds from the matrix are adsorbed to sorbents, the analytes of interest allow to remain in the liquid phase (Rejczak and Tuzimski, 2015).
Dispersive SPE has several advantages against classical solid phase extraction : (1) no need of SPE manifold and vacuum/pressure, (2) no conditioning step needed, (3) no problems with channeling, flow control, and drying-out, (4) no need to elute, (5) no evaporation needed, (6) No need of additional vessel for eluent collection, (7) less sorbent needed, (8) faster and cheaper, and (9) no experience to perform needed (Anastassiades, 2006).
Table 2. The representative QuEChERS methods.
Original QuEChERS Acetate buffered QuEChERS
(AOAC)
Citrated buffered QuEChERS (EN 15662)
Developed year 2003 2007 2008
Sample (g) 10 g 15 g 10 g
Extraction solvent 10 mL of Acetonitrile 15 mL of acetonitrile with
1% acetic acid 10 mL of Acetonitrile
Partitioning reagent 4 g of MgSO4,
1 g of NaCl 6 g of MgSO4, 1.5 g of NaOAc 4 g of MgSO4, 1 g of NaCl, 1 g of Na3Cit.2H2O, 0.5 g of Na2Cit.25H2O Cleanup (dispersive SPE) 150 mg of MgSO4, 25 mg of PSA 150 mg of MgSO4 a, 50 mg of PSA 150 mg of MgSO4, 25 mg of PSA
Option (additional absorbents)
Fatty sample - +50 mg of PSA +50 mg of PSA
Pigment sample - +50 mg of GCB +2.5 mg of GCB or
+7.5 mg of PSA
-MgSO4: magnesium sulfate, NaCl: sodium chloride, NaOAc: sodium sulfate, Na3Cit.2H2O: disodium hydrogencitrate sesquihydrate,
Na2Cit.25H2O: trisodium citrate dehydrate, PSA: primary-secondary amine, GCB: graphite carbon black
PSA absorbent is the key element in cleanup procedure. PSA is a weak anion exchanger that can remove sugars, fatty acids, polar organic acids, and some pigments, and some sugars (Koesukwiwat et al., 2008; Walorczyk and Gnusowski, 2009). Because the polar and acidic pesticides could retained by PSA, the EN 15662 suggested that acidic pesticides should be directly analysed from the raw extract without PSA clean-up. But the PSA have not much effect on removal of the color from chlorophyll and carotenes(Lehotay, Maštovská, et al., 2005).
Anhydrous magnesium sulfate (MgSO4) can act a moisture absorbent,
removing residual water remaining in an organic phase. It should be noticed that when the MgSO4 absorb the water, much of the heat is produced in
partitioning step. The produced heat can caused decomposition of thermally label pesticides. According to the particle size, there is a difference in types of heat release in my experience. In the case of powdered type MgSO4, strong heat
is released initially, while the semi-granule types of MgSO4 generate the heat
gradually. Geis-Asteggiante et al. (2012) reported that the use of an ice bath for reducing the temperature during the extraction had no significant effect on recoveries of captan, captafol, and folpet, probably due to inherent analytical difficulties more than temperature. However, it should be careful that in the case of the sample having high moisture contents, the centrifuge tube can explode or be broken by increased inner volume by high temperature in our experience. The temporarily storage in ice bath or dry ice prior to adding the MgSO4 can be useful to decrease the temperature in the extraction tube.
Additional absorbent can be applied with PSA and MgSO4 in cleanup
step. The graphite carbon black (GCB) removes chlorophyll and pigments from the extracts in dispersive SPE, but it is well known that planar pesticides can
also strongly retains by GCB (Lehotay, Mastovska, et al., 2005)(Li et al., 2009). According to visible green color, the different amounts (2.5 and 7.5 mg) of GCB can be applied (EN 15662). The excessive addition of GCB in dSPE procedure cause the losses of planar of aromatic pesticides such as thiabendazole, hexachlorobenzene, and pentachlorobenzene (Walorczyk, 2008; Wong et al., 2010). Mol et al. (2007) have reported that the addition of toluene solvent which is planar solvent in cleanup step increased the recoveries of planar pesticides while the co-extracts was also increased. Although other sorbents such as CarbonX and ChloroFiltr has been also introduced, the similar phenomenon showing unacceptable recoveries in certain analytes was observed as more chlorophyll is removed(Han, Matarrita, et al., 2016; Morris and Schriner, 2015; Walorczyk et al., 2015b). The multi-walled carbon nanotubes (MWCNTs) also are a relatively new type of nanotube material that was reported to be a good sorbent for the purpose of removal of chlorophylls and pigments in vegetables and teas (Guan et al., 2011; Han et al., 2017; Ravelo-Pérez et al., 2008; Zhang et al., 2016; Zhao et al., 2012)
The use of C18 (octadecylsilyl-derivatized silica)) also can eliminate long-chain fatty compounds, sterols, and other nonpolar interferences like a lipid. Co-extracted lipids in the extracts can be eliminate to a high degree by a
freezing-out step or a C18 clean-up (EN 15662). The other sorbents such as Z-Sep and Z-Z-Sep Plus also can be applied to remove for the lipid. These alternatives products are commercially available are offered by Supelco. The Z-Sep is a sorbent based on modified silica gel with zirconium oxide and the Z-Sep Plus sorbent consists of both zirconia and C18 dual bonded on the same silica particles. These innovative dispersive phases demonstrate ability to extract more fat and pigment than conventional PSA and C18 sorbents and
show greater recovery with better reproducibility (Kiljanek et al., 2016; Li et al., 2015; Lozano et al., 2014; Rajski et al., 2013). Other novel commercially available sorbents is EMR-Lipid (Enhanced Matrix Removal of Lipids) from Agilent. The structure of EMR-Lipid is not well known, and it does not function as a solid adsorbent in dSPE, but it dissolves to saturation in extract solution, and its mechanism is known to involve both size exclusion and hydrophobic interactions (Han, Matarrita, et al., 2016). The manufacturer claims that EMR-Lipid selectively removes lipids from QuEChERS extracts of fatty foods (Kaczynski et al., 2017) (Han, Matarrita, et al., 2016)
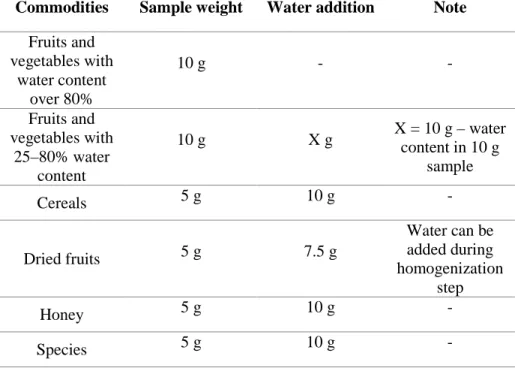
In the case of the dry commodities such as cereals, dried fruits or tea require the presoaking of samples by addition of water prior to extraction in order to weaken interactions of pesticides with the matrix. As seen Table 3, the EN 15662 standards suggested that different volume of water as well as sample weight should be added according to commodities in order to compensate the moisture contents (2008).
Table 3. The EN 15662 method guidelines for the addition of water into commodities with low water content.
Commodities Sample weight Water addition Note
Fruits and vegetables with water content over 80% 10 g - - Fruits and vegetables with 25–80% water content 10 g X g X = 10 g – water content in 10 g sample Cereals 5 g 10 g - Dried fruits 5 g 7.5 g Water can be added during homogenization step Honey 5 g 10 g - Species 5 g 10 g - 41
Validation of analytical method
Analytical method must be prove to be secure the reliability of results so that the data can have confidence from test client. For these reasons, method validation and verification are essential requirements of accreditation to ISO/IEC 17025 and ISO 15189 (NATA, 2012). Through the validation procedure, new or modified methods get recognition in its suitableness for its intended purpose. The quality, reliability, and consistency of analytical results could be judged by the results from method validation. Therefore, analytical methods need to be validated, verified, or revalidated in the following instances (Huber, 2010); in the case of the initial use in routine analysis, a transferring a method to another laboratory, and whenever the conditions or method parameters for which the method has been validated change and the change is outside the original scope of the method. In this paragraph, various validation parameters are summarized and compared on the basis of comprehensive international and national guidelines on the requirements of analytical methods and validation protocols.
Accuracy/Trueness
International Conference for Harmonization (ICH) defines the accuracy of an analytical procedure expresses the closeness of agreement between the value which is accepted either as a conventional true value or an accepted reference value and the value found. It is usually determined (average of a replicated set of trials) by recovery test. Recovery is defined as the amount measured as a percentage of the amount of analyte(s) (active substance and relevant metabolites) originally added to a sample of the appropriate matrix, which contains either no detectable level of the analyte or a known detectable level. Recovery experiments provide information on both precision and trueness (bias), and thereby the accuracy of the method (OECD, 2007). The use of certified reference materials or reference method of known uncertainty can be also used for estimate the accuracy. The method of fortification of spiked samples should be described (Fong 1999).
Precision/ Repeatability/Reproducibility
Precision is defined as the closeness of agreement between independent test results obtained under stipulated (predetermined) conditions. The measure of precision usually is expressed in terms of imprecision and computed as standard deviation of the test result. Less precision is determined by a larger standard deviation (Bratinova et al., 2009). There is two kinds of terms expressing the precision (repeatability and reproducibility). The repeatability defined as the closeness of agreement between mutually independent test results obtained with the same method on identical test material, in the same laboratory by the same operator using the same equipment within short intervals of time, while the reproducibility refers to the closeness of agreement between independent
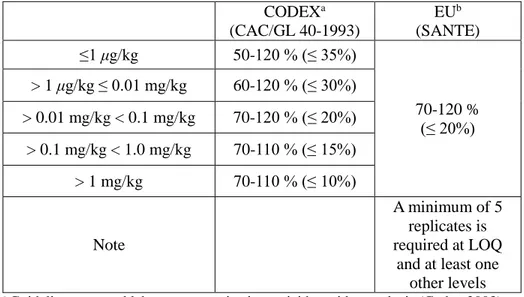
results obtained with the same method on identical test material obtained but under different conditions (OECD, 2007; Unsworth, 2010). The different criteria to validate the accuracy/trueness and precision/repeatability is summarized in Table 4
Table 4. The criteria of accuracy or trueness in representative
organizations. The criteria indicate range of mean recovery, % (relative standard deviation, %). CODEXa (CAC/GL 40-1993) EUb (SANTE) ≤1 μg/kg 50-120 % (≤ 35%) 70-120 % (≤ 20%) > 1 μg/kg ≤ 0.01 mg/kg 60-120 % (≤ 30%) > 0.01 mg/kg < 0.1 mg/kg 70-120 % (≤ 20%) > 0.1 mg/kg < 1.0 mg/kg 70-110 % (≤ 15%) > 1 mg/kg 70-110 % (≤ 10%) Note A minimum of 5 replicates is required at LOQ
and at least one other levels a Guidelines on good laboratory practice in pesticide residue analysis (Codex 2003), b Guidance document on analytical quality control and method validation procedures
for pesticides residues analysis in food and feed (European Commission, 2015).
Detection limit/Limit of quantitation (LOQ)/ Limit of quantitation (LOD) The different definitions is being used in the terms of detection limit/Limit of quantitation (LOQ)/ Limit of quantitation (LOD). According to the several guideline, concepts are presented as follows.
1) EU (SANTE guideline)(European Commission, 2015)
- LOD: The terms of the LOD is not explicitly defined, while the LOQ is defined as the minimum concentration or mass of the analyte that can be quantified with acceptable accuracy and precision. It should be apply to the complete analytical method. The LOQ can be set by lowest spike level meeting the method performance criteria for trueness and precision (mean recovery 70-120% with ≤ 20% of RSD). Also, the LOQ should be lower than those maximum residue limit (MRL).
2) CODEX(Codex 2003)
- LOD: smallest concentration where the analyte can be identified. Commonly defined as the minimum concentration of analyte in the test sample that can be measured with a stated probability that the analyte is present at a concentration above that in the blank sample.
- LOQ: Smallest concentration of the analyte that can be quantified is also called to LOQ. The LOQ is commonly defined as the minimum concentration of analyte in the test sample that can be determined with acceptable precision (repeatability) and accuracy under the stated conditions of the test.
3) OECD guideline (OECD, 2007)
- LOD: the lowest amount of an analyte in a sample that can be detected but not necessarily quantitated as an exact value. At the limit of detection, a positive identification can be achieved with reasonable and/or previously determined confidence in a defined matrix using a specific analytical method. The LOD is typically not required. However, if needed for a refined
assessment (or some other purpose), an explanation of how the LOD was derived should be provided.
- LOQ: defined from a regulatory perspective as the lowest concentration tested at which an unambiguous identification of the analyte can be proven and at which an acceptable mean recovery with an acceptable relative standard deviation (RSD) is obtained, also referred to as the LOD or Lowest Limit of Method Validation (LLMV). The LOQ should be low enough to achieve the intended purpose of the method. From an analytical perspective, 6-10 times the standard deviation of the noise provides an estimate of the LOQ, which is then verified by the fortification experiments.
Calibration curve and linearity
Calibration refer to the capacity of detection to produce an acceptable correlation between the instrumental response and the quantity of the analyte in the sample. There was no strictly criteria on linearity in general. But, most of guideline insisted that the analyte concentration to be measured should be within the defined dynamic range of the instrument (Unsworth, 2010). The representative criteria on calibration is presented as follows:
1) EU (SANTE guideline)(European Commission, 2015)
-The lowest calibration level (LCL) must be equal to, or lower than, the calibration level corresponding to the reporting limit (RL). The RL must not be lower than the LOQ. Multi-level calibration is preferred. The use of weighted linear regression (1/X) is recommended, rather than linear regression.
2) CODEX (Codex 2003)
- For linear calibration: regression coefficient for analytical standard solutions (r) ≥ 0.99, the SD of residuals (Sy/x) ≤ 0.1 3). In the case of
screening method, for linear calibration, the regression coefficient should be (r) ≥ 0.98, SD of residuals ≤ 0.2. For polynomial function (r) ≥ 0.95
3) OECD guideline (OECD, 2007)
- Calibration refers to the ability of a detection system to produce an acceptable, well defined, correlation between the instrumental response and the concentration of the analyte in the sample. The analyte concentration to be measured should be within the defined dynamic range of the instrument. The analytical calibration should extend over a range appropriate to the lowest and highest nominal concentration of the analyte in relevant analytical solutions. Either duplicate determinations at three or more concentrations or single determinations at five or more concentrations should be used.