The Pattern of Ventricular Repolarization
during Therapeutic Hypothermia
by
Sun Mi Kim
Major in Medicine
Department of Medical Sciences
The Graduate School, Ajou University
The Pattern of Ventricular Repolarization
during Therapeutic Hypothermia
by
Sun Mi Kim
A Dissertation Submitted to The Graduate School of
Ajou University in Partial Fulfillment of the Requirements
for the Degree of Master of Medicine
Supervised by
Seung Jea Tahk, M.D., Ph.D.
Major in Medicine
Department of Medical Sciences
The Graduate School, Ajou University
This certifies that the dissertation
of Sun Mi Kim is approved.
SUPERVISORY COMMITTEE
Seung-Jea Tahk
Joon-Han Shin
Gyo-Seung Hwang
The Graduate School, Ajou University
December, 20th, 2011
i - ABSTRACT –
The Pattern of Ventricular Repolarization during
Therapeutic Hypothermia
Therapeutic hypothermia (TH) is used in neuroprotection following cardiac arrest. Accidental hypothermia has been itself known to cause prolongation of the corrected QT interval (QTc). QTc prolongation can cause polymorphic ventricular tachycardia (VT) and ventricular fibrillation (VF). The interval from the peak to the end of the T wave (TpTe) indicates myocardial transmural dispersion of repolarization (TDR) and increased TDR may create electrophysiological conditions for reentry. We investigate the effect of TH on the pattern of ventricular repolarization including the QTc and TpTe. We investigate 63 patients undergoing TH following cardiac arrest at our hospital between January 2009 and October 2011. We excluded 43patients from the study because of atrial fibrillation, or when T waves were flat or the end of T waves were indefinite. We measured the QTc with Bazett’s formula and the TpTe in 20 patients (15 males, 5 females; 50.7 ± 11.4years). The TpTe was also expressed as relative to the duration of QT ([TpTe/QT]x100%), and the corrected value for heart rate (TpTe/√RR). These parameters were obtained from the precordial lead V4 and V6
of ECG on arrival at the hospital, during TH, and after rewarming to the normal temperature. The QTc became prolonged in all cases during TH and recovered to near baseline after cessation of TH (baseline: 459 ± 30 ms, TH: 539 ± 50 ms, rewarmed: 467 ± 86 ms; p<0.001). While the change of the TpTe/√RR (cTpTe) was not significant at lead V4 (baseline: 127 ±
ii
p=0.601), the [TpTe/QTe] x 100(%) was significantly decreased during TH relative to baseline measurement at lead V4 (baseline: 27 ± 5%, TH: 23 ± 5%; p=0.013) and lead V4 (baseline: 25 ± 4%, TH: 21 ± 4%; p=0.009). In present study, although the TDR was not increased during TH, delay of repolarization was demonstrated with the QTc prolongation. If recurrent ventricular arrhythmia is occurred, the early afterdepolarization (triggered activity) might be the more important mechanism of ventricular arrhythmia during TH than the reentry. As the QTc prolongation per se carries potential for refibrillation, close ECG monitoring is needed during TH.
iii
TABLE OF CONTENTS
ABSTRACT ··· ⅰ TABLE OF CONTENTS ··· ⅲ LIST OF FIGURES ··· ⅳ LIST OF TABLES ··· v I. INTRODUCTION ··· 1 II. METHODS ··· 3 A. Study Subjects ··· 3B. ECG Recordings and Analyses ··· 3
C. Statistical Analyses ··· 4 III. RESULTS ··· 5 IV. DISCUSSION ··· 13 V. CONCLUSION ··· 16 REFERENCES ··· 17 국문요약 ··· 21
iv
LIST OF FIGURES
Fig. 1. ECG parameters ··· 4
Fig. 2. The change of QTc interval according to body temperature ··· 7
Fig. 3. Time course of corrected QT interval (QTc) and the corrected value of the interval from the peak to the end of the T wave for heart rate (TpTe/√RR) at lead V4 and V6 ··· 9
Fig. 4. Time course of the relative value of the interval from the peak to the end of the T wave to the QT interval ([TpTe/QT]x100%) at lead V4 and V6 ··· 10
Fig. 5. J wave during therapeutic hypothermia and normalized ECG on recovery state, and V-fib with prominent J wave during therapeutic hypothermia ··· 12
v
LIST OF TABLES
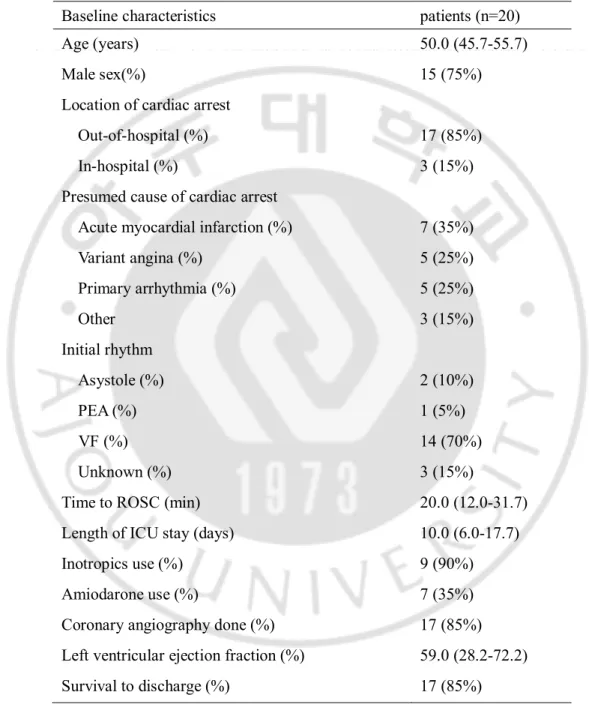
Table 1. Baseline characteristics given as number and % or the median and interquartile range (IQR; 25-75) ··· 6
Table 2. Quantitative change in ECG findings (mean ± SD) ··· 7
1
-I. INTRODUCTION
Therapeutic hypothermia (TH) has become an important procedure in survivors from out-of-hospital cardiac arrest to improve neurological prognosis according to the current guidelines by the International Liaison Committee on Resuscitation (ILCOR) (Nolan et al, 2002) and the European Resuscitation Council (ERC) (Wenzel et al, 2005). However, an increased number of arrhythmias have been reported during accidental hypothermia. Hypothermia decreases spontaneous depolarization of the cardiac pacemaker cells, prolongs action potential duration (of both the depolarization and repolarization), slows myocardial impulse conduction, and results in abnormal repolarization (Mallet, 2002). Classic and well-known electrocardiographic manifestations of hypothermia include the presence of J (Osborn) waves, prolonged PR, QRS, QT intervals, and atrial arrhythmias (Shaikh et at, 2005). The effects of TH on cardiac electrical activity after cardiac arrest are not yet fully known. Only a few studies evaluated the effect of TH after cardiac arrest on arrhythmia and corrected QT interval (Khan et al, 2010; Storm et al, 2011). QT prolongation is caused by delayed ventricular repolarization and usually leads to an increase in the degree of temporal dispersion of refractory periods (Han and Goel, 1972).Such increased dispersion results in prolongation of the vulnerable period and early afterdepolarization can occur at low membrane potential (Schwartz and Wolf, 1978).
Myocardial transmural dispersion of repolarization (TDR) has been associated with reentrant arrhythmias in animal studies (Xia et al, 2005) and the interval from the peak to the end of the T wave (Tpeak-Tend interval, or TpTe) has been proposed to represent repolarization dispersion in the heart (Antzelevitch, 2001).A prolonged TpTe has been
2
-associated with arrhythmic events in various clinical conditions (Watanabe et al, 2004; Yan and Antzelevitch, 1998; Castro et al, 2006), but little is known about TpTe in the TH following cardiac arrest. The purpose of the present study is to evaluate the possible effect of TH on the pattern of ventricular repolarization represented by the QTc interval and the TpTe.
3
-II. METHODS
A. Study subjects
This is an observational study from the Department of Cardiology and the Department of Emergency medicine at Ajou University Hospital. Patients were included if they sustained cardiac arrest, and received therapeutic hypothermia during 12~24 hours after resuscitation between January 2009 and Octorber 2011. The resuscitation was performed in conformance with the current guidelines of advanced cardiac life support of the American Heart Association and the European Resuscitation Council. The hypothermia treatment started as soon as possible after 1st 12-lead electrocardiogram (ECG) was taken. Patients were
excluded if they had atrial fibrillation, bundle branch block, or when T waved were flat or the end of T waves were indefinite. A total of 63 were screened and 43 were excluded based on the above criteria, ending up with inclusion of 20 patients in the study.
B. ECG recordings and analyses
A digital 12-lead standard ECG was obtained using a MAC 5000 digital ECG apparatus (GE Marquette Medical Systems, Milwaukee, WI, USA) just after resuscitation or admission, during TH, and after rewarming. QT interval at the lead II and the interval from the peak to the end of the T wave (TpTe) at the lead V4 and V6 were measured manually on each patient (Figure 1). The corrected QT interval (QTc) with Bazett’s formula (QT interval/√RR) was also calculated from QT interval. TpTe was expressed as the absolute value (TpTe), the relative value to the duration of QT interval ([TpTe/QT)x100%), and the corrected value for the heart rate (TpTe/√RR).
4
-C. Statistical analyses
SPSS 12.0 (SPSS inc., Chicago, Illinois, USA) statistical software was used for all calculations. Data are shown as the mean ± standard deviation (SD) or the median and interquartile range for continuous variables and as percentages for categorical variables. Analysis of time variance among serial ECGs was conducted with Friedman test and Wilcoxon’s signed ranks test. P-values of less than 0.05 were considered to indicate a statistically significant difference.
Fig.1. ECG parameters. This is highlighting the common parameters measured when assessing the QT/QTc interval and the interval from the peak to the end of the T wave.
5
-III. RESULTS
The study population consists of 20 patients, and the mean age was 50.7 ± 11.4years with a majority of out-of-hospital cardiac arrest (OHCA) patients (85%). In 14 patients the initial rhythm was ventricular fibrillation (VF), and cardiac arrest related to coronary disease was 60% (acute myocardial infarction: 35%, variant angina: 25%). Coronary angiography was performed at 17 patients in order to find the cause of cardiac arrest. Detailed characteristics for all patients in the study are given in Table 1.
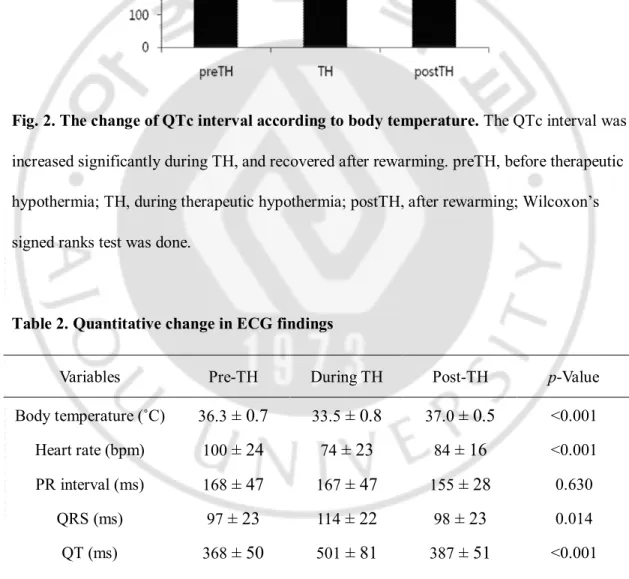
ECG was taken during TH at mean body temperature (33.5 ± 0.8˚c). The average heart rate (HR) during hypothermia was 74 ± 23 beats per minute (bpm), decreasing from baseline average of 100 ± 24 bpm (p<0.001). The changes of PR interval was not significant (p=0.630), but the QRS duration was increased significantly during TH (97 ± 23 vs. 114 ± 22, p=0.014). The QTc interval was prolonged significantly in all cases during TH and recovered to near baseline after cessation of TH (459 ± 30 vs. 539 ± 50 vs. 467
± 86
, Figure 2).6
-Table 1. Baseline characteristics given as number and % or the median and interquartile range (IQR; 25-75).
PEA: pulseless electrical activity, VF: ventricular fibrillation, ROSC: return of spontaneous circulation, ICU: intensive care units
Baseline characteristics patients (n=20)
Age (years) 50.0 (45.7-55.7)
Male sex(%) 15 (75%)
Location of cardiac arrest
Out-of-hospital (%) 17 (85%)
In-hospital (%) 3 (15%)
Presumed cause of cardiac arrest
Acute myocardial infarction (%) 7 (35%)
Variant angina (%) 5 (25%) Primary arrhythmia (%) 5 (25%) Other 3 (15%) Initial rhythm Asystole (%) 2 (10%) PEA (%) 1 (5%) VF (%) 14 (70%) Unknown (%) 3 (15%)
Time to ROSC (min) 20.0 (12.0-31.7)
Length of ICU stay (days) 10.0 (6.0-17.7)
Inotropics use (%) 9 (90%)
Amiodarone use (%) 7 (35%)
Coronary angiography done (%) 17 (85%) Left ventricular ejection fraction (%) 59.0 (28.2-72.2) Survival to discharge (%) 17 (85%)
7
Fig. 2. The change of QTc interval according to body temperature. The QTc interval was increased significantly during TH, and recovered after rewarming. preTH, before therapeutic hypothermia; TH, during therapeutic hypothermia; postTH, after rewarming; Wilcoxon’s signed ranks test was done.
Table 2. Quantitative change in ECG findings
TH, therapeutic hypothermia; QT, QT interval; QTc, corrected QT interval; Friedman test was done.
Variables Pre-TH During TH Post-TH p-Value Body temperature (˚C) 36.3
± 0.7
33.5± 0.8
37.0± 0.5
<0.001 Heart rate (bpm) 100± 24
74± 23
84± 16
<0.001 PR interval (ms) 168± 47
167± 47
155± 28
0.630 QRS (ms) 97± 23
114± 22
98± 23
0.014 QT (ms) 368± 50
501± 81
387± 51
<0.001 QTc (ms) 459± 30
539± 50
467± 86
<0.0018
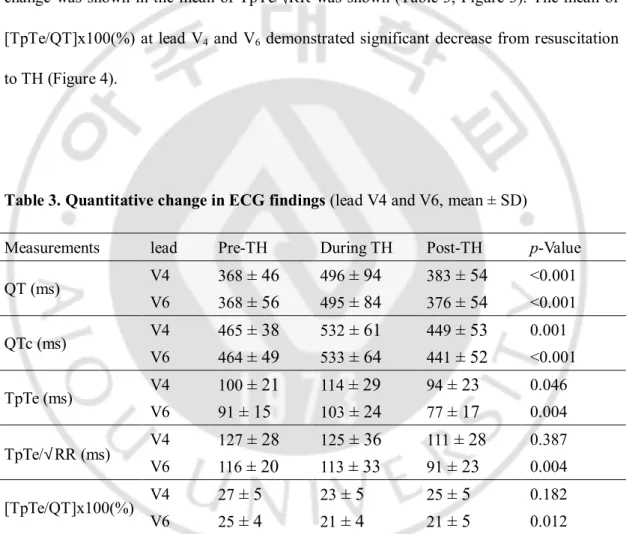
-The mean of QTc at lead V4 during TH was significantly prolonged as compared to
before TH, but there was no significant difference in the mean of TpTe/√RR (Table 3, Figure 3). Similarly at lead V6, the changes of the mean of QTc was significant, but no significant
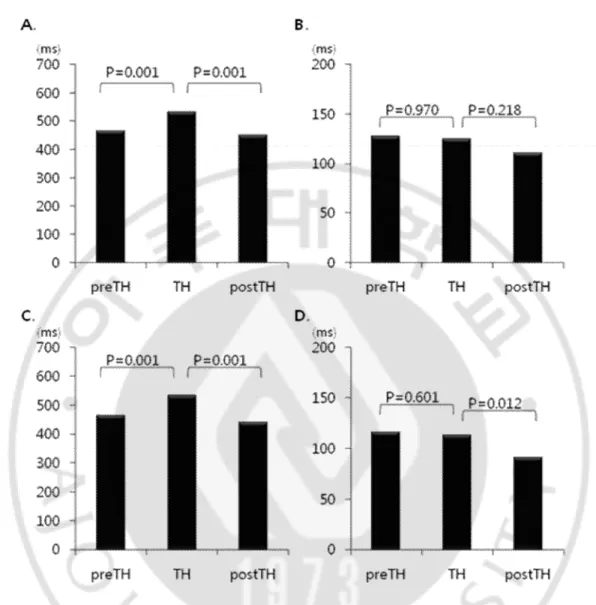
change was shown in the mean of TpTe/√RR was shown (Table 3, Figure 3). The mean of [TpTe/QT]x100(%) at lead V4 and V6 demonstrated significant decrease from resuscitation
to TH (Figure 4).
Table 3. Quantitative change in ECG findings (lead V4 and V6, mean ± SD)
QT, QT interval; QTc, corrected QT interval; TpTe, the interval from the peak to the end of the T wave; TpTe/√RR, the corrected value of the interval from the peak to the end of the T wave for heart rate; [TpTe/QT]x100(%), the relative value of the interval from the peak to the end of the T wave to the QT interval; TH, therapeutic hypothermia; Friedman test was done.
Measurements lead Pre-TH During TH Post-TH p-Value QT (ms) V4 368
± 46
496± 94
383± 54
<0.001 V6 368± 56
495± 84
376± 54
<0.001 QTc (ms) V4 465± 38
532± 61
449± 53
0.001 V6 464± 49
533± 64
441± 52
<0.001 TpTe (ms) V4 100± 21
114± 29
94± 23
0.046 V6 91± 15
103± 24
77± 17
0.004 TpTe/√RR (ms) V4 127± 28
125± 36
111± 28
0.387 V6 116± 20
113± 33
91± 23
0.004 [TpTe/QT]x100(%) V4 27± 5
23± 5
25± 5
0.182 V6 25± 4
21± 4
21± 5
0.0129
-Fig. 3. Time course of corrected QT interval (QTc) and the corrected value of the interval from the peak to the end of the T wave for heart rate (TpTe/√RR) at lead V4
and V6. A. QTc in lead V4; B. TpTe/√RR in lead V4; C. QTc in lead V6; D. TpTe/√RR in
- 10 -
Fig. 4. Time course of the relative value of the interval from the peak to the end of the T wave to the QT interval ([TpTe/QT]x100%) at lead V4 and V6. A. [TpTe/QT]x100% in lead V4; B. [TpTe/QT]x100% in lead V6; TH, therapeutic hypothermia; Wilcoxon’s signed
- 11 -
The one case showed non-sustained ventricular tachycardia (VT) during rewarming process, and another case showed non-sustained VT on holter monitoring on 6th day after
admission. Both of them were treated by primary percutaneous coronary intervention due to ST segment elevation myocardial infarction (STEMI).
The only one case showed ventricular fibrillation during hypothermia and that case was confirmed as variant angina by ergonovine provocation test. The ECG showed prominent J wave during TH, and it disappeared on normalized body temperature (Figure 5). VF was developed with prominent J wave during TH, and then ST change was not observed. QTc was significantly prolonged in this case (pre-TH; 467ms, TH; 665ms, post-TH; 428ms), and TpTe/√RR was also increased at lead V4 (pre-TH; 132ms, TH; 158ms, post-TH; 128ms) and
V6 (pre-TH; 119ms, TH; 171ms, post-TH; 115ms). But the change of [TpTe/QT]x100%
during was less significant than QTc or TpTe/√RR in lead V4 (pre-TH; 29%, TH; 27%,
post-TH; 29%) and V6 (pre-TH; 26%, TH; 27%, post-TH; 26%). The measurements of this case
- 12 -
Fig. 5. J wave during therapeutic hypothermia and normalized ECG on recovery state, and V-fib with prominent J wave during therapeutic hypothermia. J wave during TH (A) and normalized ECG on recovery state (B) was noted on 12-lead ECG, and V-fib with prominent J wave during TH (C) was detected on rhythm strip ECG.
- 13 -
IV. DISCUSSION
In general, if central body temperature decreases, a decrease of heart rate, spontaneous depolarization of pace-maker cells, myocardial impulse conduction and increase of the action potential duration is the normal response. The observations, based on these changes at the ECG level, are prolonged PR interval, expanded QRS and increased QT interval (Aslam et al, 2006; Polderman and Herold, 2009). Following these conditions, the monitored findings of prolonged QTc in this study could be expected, and the mean prolongation with QTc of 539ms is clearly higher than the normal range in the literature. Surprisingly, malignant or life-threatening arrhythmias such as Torsade de pointes or sustained ventricular tachycardia were not documented, and ventricular fibrillation was noted during TH in only one case although QTc prolongation was significant in all cases.
An increased TpTe has previously been shown to be associated with an increase in arrhythmic events under various conditions (Castro et al, 2006; Yamaguchi et al, 2003; Couderc et al, 2009). A study by Wolk et al, who evaluated TpTe during ventricular pacing in 6 VT-inducible patients and 7 VT-non-inducible patients found that the V3-V4 TpTe during sinus rhythm and the V2-V3 TpTe during ventricular pacing was significantly prolonged in the VT-inducible group, as compared to the VT-non-inducible group (Wolk and Kulakowski, 2001). Savelieva et al. also reported significant prolongation of TpTe in patients with myocardial infarction associated with lethal arrhythmia as compared to patients with no lethal arrhythmias (Savelieva et al, 1998). It has been suggested that transmural dispersion of repolarization is best measured in the precordial leads since these provide the
- 14 -
most accurate transmural information, V3 and V4 are in closest proximity to the ventricular myocardium and may be expected to provide the most accurate approximate of TDR.
In present study, QTc, TpTe /√RR, and [TpTe/QT]x100(%) were measured and calculated in precordial lead V4 and V6. We selected lead V4 due to aforementioned study
results, and lead V6 as it may best reflect the transmural axis of the left ventricle (Gupta et al,
2008). The mean of TpTe/√RR at lead V4 and V6 were not increased significantly during TH of this study. This might mean that TH didn’t affect myocardial transmural dispersion of repolarization as much as it delayed ventricular repolarization which was demonstrated with the QTc prolongation. If ventricular tachyarrhythmia is occurred during TH, the early afterdepolarization (triggered activity) might be more important mechanism of ventricular arrhythmia than the reentry.
Gupta el al. demonstrated TpTe/QT ratio as an electrocardiographic index of arrhythmogenesis (Gupta et al, 2008). They showed TpTe/QT ratio remains constant between the heart rates from 60 to 100 bpm and the mean value of approximately 0.21 in the precordial leads in healty individuals. Interestingly, the TpTe/QT ratio is significantly greater in the patients at risk for arrhythmic event such as those with long QT syndrome, Brugada syndrome, short QT syndrome, and also in patients with organic heart disease such as acute myocardial infarction. Functional reentry is the underlying mechanism for arrhythmogenesis associated with an increased TpTe/QT ratio. In present study, the TpTe/QT ratio was elevated (0.27
± 0.05 at lead V
4, 0.
25± 0.04 at lead V
6)
on baseline ECG as compared tohealthy individuals (TpTe/QT; 0.21) on the result of the above study, and it represents the patients might have the arrhythmogenic state of various clinical conditions. The shortened TpTe/QT ratio when the body temperature was decreased to 33.5˚C showed that an increased
- 15 -
myocardial TDR might have not persisted but normalized due to hypothermia. It could explain very low incidence of lethal ventricular arrhythmia in this study.
There are several limitations to the present study. This study was based on a small sample size. And we measured all parameters manually in this study although automatic measurement system has developed, since the accuracy of automatic measurements was questionable in many cases.
- 16 -
V. CONCLUSION
The change of TpTe/√RR was not significant and TpTe/QT ratio was decreased significantly during TH. The therapeutic hypothermia might not be dangerous about lethal arrhythmia than people considered, but the QTc prolongation per se carries potential for refibrillation. Therefore close ECG monitoring is needed during therapeutic hypothermia.
- 17 -
REFERENCES
1. Antzelevitch C. Tpeak-Tend interval as an index of transmural dispersion of repolarization. Eur J Clin Invest 31:555-557, 2001
2. Aslam AF, Aslam AK, Vasavada BC, Khan IA. Hypothermia: evaluation, electrocardiographic manifestations, and management. Am J Med 119:297–301, 2006
3. Castro Hevia J, Antzelevitch C, Tornes Barzaga F, Dorantes Sanchez M, Dorticos Balea F, Zayas Molina R, Quinones Perez MA, Fayad Rodriguez Y. Tend and Tpeak-Tend dispersion as risk factors for ventricular tachycardia/ventricular fibrillation in patients with the Brugada syndrome. J Am Coll Cardiol 47:1828-1834, 2006
4. Couderc JP, Kaab S, Hinterseer M, McNitt S, Xia X, Fossa A, Beckmann BM, Polonsky S, Zareba W. Baseline values and sotalol induced changes of ventricular repolarization duration, heterogeneity, and instability in patients with a history of drug-induced Torsades de Pointes. J Clin Pharmacol 49:6-16, 2009
5. Gupta P, Patel C, Patel H, Narayanaswamy S, Malhotra B, Green JT, Yan GX. Tp-e/QT ratio as an index of arrhythmogenesis. J Electrocardiol 41:567-574. 2008
- 18 -
Arch Intern Med 129:749-755, 1972
7. Khan JN, Prasad N, Glancy JM. QTc prolongation during therapeutic hypothermia: are we giving it the attention it deserves? Europace 12:266–270, 2010
8. Mallet ML. Pathophysiology of accidental hypothermia. QJM 95:775-785,. 2002
9. Nolan JP, Deakin CD, Soar J, Bottinger BW, Smith G. European Resuscitation Council Guidelines for resuscitation 2005: Section 4. Adult advanced life support. Resuscitation 67: S39-S86, 2005
10. Nolan JP, Morley PT, Vanden-Hoek TL, Hickey RW (ALS Task Force), Kloeck WGJ, Billi J, Bottiger BW, Morley PT, Nolan JP, Okada K, Reyes C, Shuster M, Steen PA, Weil MH, Wenzel V (PLS Task Force), Carli P: Therapeutic hypothermia after cardiac arrest—advisory statement by Advanced Life Support Task Force of the International Liaison Committee on Resuscitation. Circulation 108:118–121, 2002
11. Polderman KH, Herold I. Therapeutic hypothermia and controlled normothermia in the intensive care unit: practical considerations, side effects, and cooling methods. Crit Care Med 37:1101–1120, 2009
12. Savelieva I, Yag YG, Yi G, Guo X, Camm AJ, Malik M. Comparative reproducibility of QT, QT peak, and T peak- T end intervals and dispersion in normal subjects with hypertrophic cardiomyopathy. Pacing Clin Electrophysiol 21:2376-2381, 1998
- 19 -
13. Schwartz PJ, Wolf S. QT interval prolongation as predictor of sudden death in patients with myocardial infarction. Circulation 57:1074-1077, 1978
14. Shaikh N, Mustafa S, Gowda RM, Khan IA. Electrocardiographic features of hypothermia. Cardiology 103:118-119, 2005
15. Storm C, Hasper D, Nee J, Joerres A, Schefold JC, Kaufmann J, Roser M. Severe QTc prolongation under mild hypothermia treatment and incidence of arrhythmia after cardiac arrest-A prospective study in 34 survivors with continuous Holter ECG. Resuscitation 82:859-862, 2011
16. Watanabe N, Kobayashi Y, Tanno K, Miyoshi F, Asano T, Kawamura M, Mikami Y, Adachi F, Ryu S, Miyata A, Katagiri T. Transmural dispersion of repolarization and ventricular tachyarrhythmias. J Electrocardiol 37:191-200, 2004
17. Wolk R, Stec S, Kulakowski P. Extrasystolic beats affect transmural electrical dispersion during programmed electrical stimulation. Eur J Clin Invest 31:293-301, 2001
18. Xia Y, Liang Y, Kongstad O, Holm M, Olsson B, Yuan S. Tpeak-Tend interval as an index of global dispersion of ventricular repolarization: evaluations using monophasic action potential mapping of the epi- and endocardium in swine. J Interv Card
- 20 -
Electrophysiol 14:79-87, 2005
19. Yamaguchi MF, Shimizu MF, Ino HF, Terai H, Uchiyama K, Oe K, Mabuchi T, Konno T, Kaneda T, Mabuchi H. T wave peak-to-end interval and QT dispersion in acquired long QT syndrome: a new index for arrhythmogenicity. Clin Sci (Lond) 105:671-676, 2003
20.
Yan GX, Antzelevitch C. Cellular basis for the normal T Wave and the electrocardiographic manifestations of the long-QT syndrome. Circulation 98:1928-1936, 1998- 21 - - 국문요약 -
치료적 저체온 요법에서 심실 재분극 패턴 변화
아주대학교 대학원 의학과 김 선 미 (지도교수: 탁 승 제) 치료적 저체온 요법 (Therapeutic hypothermia, TH)은 심정지 환자에서 자연순환 회복 후 허혈에 의한 신경손상을 막기 위해 도입되었다. 사고성 저체온 환자를 통한 연구에서 저체온 자체가 QT 간격 연장을 유발한다는 것은 이미 알려져 있다. 교정 QT 간격 연장은 다형성 심실빈맥과 심실 세동을 일으킬 수 있다. T파의 정상에서 T파의 종말점까지의 간격을 TpTe 라고 하며, 심근의 재분극이 전층에서 분산하는 것 (transmural dispersion of repolarization, TDR)을 반영하는데, TDR의 증가는 회귀를 잘 일으키는 전기생리학적 조건을 형성하게 된다. 이에 저자들은 교정 QT간격 및 TpTe를 측정하여 치료적 저체온 요법이 심실 재분극 패턴에 미치는 영향을 연구하고자 하였다. 2009년 1월부터 2011년 10월까지 아주대학교병원 순환기내과 및 응급의학과에 심정지로 입원하여 치료적 저체온 요법을 시행받은 63명의 환자를 대상으로 하였다. 이 중 43명이 제외되었는데, 심방 세동이 있거나 T wave가 평편하여 구분이 불확실한 경우였다. 20명의 환자에서 Bazett공식으로 교정한 QT간격 및 TpTe를 측정하였다. TpTe의 경우 QT간격에 대한 비 ([TpTe/QTe]x- 22 - 100(%)) 및 심박수로 교정 (TpTe/√RR)한 값 또한 구하였다. 이러한 측정값 및 계산값은 병원 내원 직후 또는 자연순환 회복 직후, 저체온 요법 중, 정상 체온 회복 후 각각 표준 12유도 심전도를 시행하여 전흉부 유도 V4와 V6에서 측정하고 계산하였다. 모든 환자에서 저체온 요법을 시행하는 중에 시행한 심전도에서 교정 QT간격의 증가가 관찰되었고, 이는 정상 체온 회복 후 시행한 심전도에서는 거의 정상치까지 돌아온 것을 확인할 수 있었다 ((baseline: 459 ± 30 ms, TH: 539 ± 50 ms, rewarmed: 467 ± 86 ms; p<0.001). 반면에 TpTe/√RR 값은 기저치에서 저체온요법을 진행하는 사이에 V4유도 (baseline: 127 ± 28 ms, TH: 125±36ms; p=0.970)와 V6유도 (baseline: 116 ± 20 ms, TH: 113 ± 33 ms; p=0.601)에서 모두 유의한 변화를 나타내지 않았으며, QT간격에 대한 TpTe의 비 ([TpTe/QTe] x 100(%))는 V4유도 (baseline: 27±5%, TH: 23±5%; p=0.013)와 V6유도 (baseline: 25 ± 4%, TH: 21 ± 4%; p=0.009) 모두에서 기저치에 비해 저체온 요법 중 오히려 감소하는 경향을 보였다. 본 연구에서 저체온 요법 시행 중에 나타나는 재분극의 지연은 교정 QT간격 증가로 확인할 수 있었으나, TpTe에 관한 지표로 표현되는 심근의 TDR은 증가하지 않았다. 이를 통해 반복적으로 치명적인 심실 부정맥이 저체온 요법 중에 나타난다면 회귀 (reentry)보다는 조기 후탈분극 (early afterdepolarization)이 좀더 중요한 기전으로 작용할 것이라고 생각해 볼 수 있다. 본 연구 결과를 통해 치료적 저체온 요법이 기존에 생각했던 것보다 심장 전기생리학적인 위험성이 덜할 것이라고 판단해 볼 수 있으나, 교정 QT간격 증가 자체만으로도 심실 세동이 다시 발생할 가능성이 있으므로 저체온 요법 중에 지속적인 심전도 감시는 필요할 것으로 생각된다. 핵심어: Tpeak-Tend interval, 치료적 저체온 요법, 교정 QT간격, 심정지
![Fig. 4. Time course of the relative value of the interval from the peak to the end of the T wave to the QT interval ([TpTe/QT]x100%) at lead V 4 and V 6](https://thumb-ap.123doks.com/thumbv2/123dokinfo/4678064.1758/18.799.103.719.128.487/fig-time-course-relative-value-interval-interval-tpte.webp)

