의학 박사학위 논문
Inhibitory mechanism of 3, 4, 5 - trimethoxy
cinnamic acid thymol ester on melanogenesis
아 주 대 학 교 대 학 원
의 학 과
Inhibitory mechanism of 3, 4, 5 - trimethoxy
cinnamic acid thymol ester on melanogenesis
지도교수 강 원 형
이 논문을 의학 박사학위 논문으로 제출함.
2003 년 2 월
아 주 대 학 교 대 학 원
의 학 과
황 재 성
-ACKNOWLEDGEMENT- 본 논문이 완성되기까지 부족한 제게 항상 세심한 지도와 격려를 아끼지 않으신 강원형 교수님께 깊은 감사를 드립니다. 또한 지도해주신 이기범 교수님, 김형일 교수님, 이은소 교수님, 주일로 교수님, 김유찬 교수님, 윤 경한 교수님께 깊은 감사를 드립니다. 미진한 학업의 기회를 주신 ㈜태평양의 서경배 사장님과, 이옥섭 원장님, 심영철 소장님, 강학희 소장님, 태평양 제약의 이우영 사장님께 깊이 감사 드립니다. 학업과 업무를 병행하는 중에 배려해 주시고 관심과 격려를 보내주신 장이섭 소장님과 이병곤 팀장님께도 깊이 감사드립니다. 본 논 문의 씨앗이 되어주신 문성준 팀장님, 노호식님, 안수미님께도 감사드립니 다. 또한 무엇보다도 제 공백을 메꾸어 주고, 저와 함께 본 논문의 실험을 같이 해주신 신현정, 최현정님께 많은 감사를 드립니다. 부족한 논문을 흔 쾌히 교정해 주시고 보완해주신 이진선 박사님, 이태룡 팀장님께도 감사 드립니다. 멀리서도 관심을 가지고 지켜봐주시는 김종일 소장님께 감사드 립니다. 항상 관심을 가져주시고 격려해주시는 서울대 은사이신 안태인 교수님, 정구흥 교수님께도 감사드립니다. 오늘날까지 걱정스레 지켜봐주시고 격려해 주시는 어머님께 감사의 마음 드립니다. 누님과 동생 그리고 가까이서 저대신 아들역할을 해주는 매형 과 매제에게도 감사한 마음 전합니다. 또한, 항상 격려해 주시는 장인, 장모님 처가 식구들에게도 깊은 감사를 드립니다. 이외에도 제가 잊고있는 여러 분들에게 감사드립니다.많은 분 들의 도움으로 제가 있음을 다시 생각하며, 항상 옆에 있는 벗, 민진선과 아들 석영에게 작은 결실과 사랑함을 전합니다.
Inhibitory mechanism of 3,4,5-trimethoxy
cinnamic acid thymol ester on melanogenesis
by
Jae Sung Hwang
A Dissertation Submitted to The Graduate School of Ajou University
in Partial Fulfillment of the Requirements for the Degree of
DOCTOR OF PHILOSOPHY
Supervised by
Won Hyoung Kang, M.D., Ph.D.
Department of Medical Sciences
The Graduate School, Ajou University
-ABSTRACT-
Inhibitory mechanism of 3,4,5-trimethoxy cinnamic
acid thymol ester on melanogenesis
Jae Sung Hwang
Department of Medical Sciences The Graduate School, Ajou University (Supervised by Professor Won Hyoung Kang)
Purpose: Various pigmentary disorders show the accumulation of excessive amount
of epidermal melanin pigments. These hyperpigmented dermatoses include melasma, age spots or liver spots, and actinic damage (i.e. due to solar ultraviolet irradiation). Unfortunately, current therapies are inadequate for these conditions. A series of gallic acid derivatives were synthesized and examined for their inhibitory activities on melanin synthesis. Among the series, 3, 4, 5-trimethoxy cinnamic acid thymol ester (TCTE) was most effective in reducing melanin synthesis with low toxicity. This study was designed to figure out the inhibitory mechanism of TCTE on melanogenesis.
synthetic derivatives of ga llic acid were used. Melan-a melanocytes were used for measurement of melanin content and cell viability. Human epidermal equivalent (melanoderm) was used for melanin synthesis assay. Guinea pigs were used to measure the effects of TCTE on UVB- induced melanogenesis in vivo. To investigate the effect of TCTE on tyrosinase, melan-a melanocytes were used for in situ and in
vitro tyrosinase assay. In order to find out the effects of TCTE on the melanogenic
protein expression, western blot and RT-PCR against tyrosinase, tyrosinase related protein-1 (TRP-1), tyrosinase related protein-2 (TRP-2) and Mitf were done. To investigate the effect of TCTE on the cAMP-dependent signaling pathway, cellular cAMP content and extracellular signal-regulated kinases (ERKs) were checked.
Results: Among the twelve test compounds TCTE was most effective on inhibition
of melanin synthesis (IC50 = 8 µM), at which concentration the cytotoxicity was low (IC50 > 300 µM). Melanin synthesis decreased by 75% with 30 µM TCTE treatment for 72 hrs without affecting cell growth. The inhibitory effects of melanin synthesis were also shown in reconstitute human epidermis model and in brown guinea pigs with UVB- induced hyperpigmentation model by topical application (0.1 and 1% TCTE, respectively).
Tyrosinase activity decreased by 80% with 30µM TCTE treatment for 72 hrs without affecting cell growth. The inhibition of tyrosinase activity was dose-dependent. From the in vitro tyrosinase assay using cell extract, TCTE does not act as a direct inhib itor of tyrosinase. Treatment of melan-a melanocytes with TCTE
blocked the increase in tyrosinase activity by forskolin, cAMP or 3- isobutyl-1-methtyl- xanthine (IBMX). TCTE decreased the expression of tyrosinase and TRP-1 through down regulation of tyrosinase and TRP-1 mRNA expression without any effect on TRP-2 expression. cAMP immunoassays showed that intracellular level of cAMP was unaffected in cells treated with TCTE. Mitf level was revealed to be significantly decreased with 30 µM TCTE treatment for 72 hrs by western blotting. Phosphorylation of extracellular signal-regulated kinase 1/2 (ERK1/2) were induced by TCTE treatment and blocked with specific MEK inhibitor, PD98059.
Conclusion: The results of this study suggest that TCTE can be a good candidate for
depigmenting agent. TCTE inhibited melanin synthesis by reducing the expression of tyrosinase and TRP-1 at the transcriptional level in melan-a melanocytes. The reduced expression of tyrosinase and TRP-1 was brought about through the enhanced degradation of Mitf in melan-a melanocytes. Furthermore, it seems that enhanced degradation of Mitf was seemed to be associated with the activation of ERK1/2 at least in part.
Key Words: Melanogenesis, 3,4,5-trimethoxy cinnamic acid thymol ester (TCTE), melan-a melanocytes, Mitf, ERK1/2, Tyrosinase, TRP-1
TABLE OF CONTENTS
TITLE PAGE … … … 1 ABSTRACT … … … . 2 TABLE OF CONTENTS … … … 5 LIST OF FIGURES … … … . 8 LIST OF TABLES … … … 1 0 LIST OF ABBREVIATIONS … … … 11 I. INTRODUCTION … … … . 1 3 A. Skin vs epidermis: structural relations … … … . … ..13B. Melanogenesis … … … 1 5 1. Biosynthetic pathway … … . . … … … 1 5 2. Tyrosinase … … … . . … … … 1 7 3. Tyrosinase related protein-1 … … … … . … … … ..21
4. Tyrosinase related protein-2 … … … . … … … ..22
C. Regulation of melanogenesis … … … . … … … ..23
1. cAMP-dependent pathway … … … . … .23
2. PKC-β dependent pathway … … … 2 5 3. Mitf and MAPK … … … .26
D. Gallic acid and its biological function … … … .29
II. MATERIALS AND METHODS … … … ...32 A. Materials … … … .32 1. Compounds used in this study … … … 3 2 2. Melan-a melanocytes … … … ..35 3. Human epidermal equivalent (Melanoderm) … … … 3 5 4. Brown guinea pigs … … . . … … … 3 5 5. Reagents and suppliers … … … 3 6 B. Methods . … … … .37 1. Measurements of melanin content and cell viability … … … .37 2. Assay of cell proliferation … .. … … … ..37 3. Melanin assay using human epidermal equivalent (Melanoderm) … … ..38 4. Pigmentation assays: UVB- induced pigmentation in brown guinea pig … 39 5. In situ tyrosinase assay … … … 4 0 6. DOPA staining of gels (SDS-PAGE) for visualization of tyrosinase activity on gel .. … … … ... … … … ..40 7. Tyrosinase activity assay (cell extracts, in vitro) … … … . . … .41 8. cAMP measurement … … … . . … … … .42 9. Protein assay … … … 4 3 10. Western blot analysis … … . . … … … . . 4 4 11. RT-PCR analysis … … … . . … … … 4 5 12. Statistical analysis … … … 4 7
III. Results … … … .49
Part I. Screening and evaluation of gallic acid derivatives … … … ..49
1. Effects of gallic acid derivatives on melanin content and cell viability … … .49
2. Effect of TCTE on melan-a melanocyte proliferation … … … 4 9 3. Effect of TCTE on melanin synthesis in melan-a melanocytes … … … ..52
4. Effect of TCTE on melanin synthesis in Melanoderm model … … … ...52
5. Effect of TCTE on UVB- induced hyperpigmentation in brown guinea pigs ..56
Part II. Inhibition of melanin synthesis by TCTE through ERK activation in melan-a cells … … … .59
1. Effect of TCTE on tyrosinase activity in situ … … … .59
2. Effect of TCTE on tyrosinase activity (cell extracts, in vitro) … … … … … 59
3. Effects of TCTE on the expression of tyrosinase, TRP-1 and TRP-2 … … … 6 2 4. Effects of TCTE on the mRNA expression of tyr, trp-1, trp-2 and mitf … … .62
5. cAMP action is blocked by TCTE … … … ..62
6. Intracellular cAMP level after treatment with TCTE... … … … ..66
7. Effect of TCTE on Mitf expression in melan-a melanocytes … … … ..66
8. Effect of TCTE on ERK1/2 activation in melan-a melanocytes … … … .66
IV. Discussion … … … . … … … 7 0 V. Conclusion … … … .75
BIBLIOGRAPHY … … … .76 국문요약 … … … … … … 9 0
LIST OF FIGURES
Figure 1. Architecture of the skin … … … . . … … 1 3 Figure 2. Pathway for melanin biosynthesis in mammals … … … . … … … … 1 7 Figure 3. Promoter region within the tyrosinase Gene … … … 2 1 Figure 4. Structure of the MITF-M … … … 2 7 Figure 5. Model of signaling pathways involved in cAMP- induced melanogenesis 29 Figure 6. Effects of TCTE on the growth of melan-a melanocytes measured by MTT assay … … … ..51 Figure 7. Phenotypic appearance of melan-a melanocytes in the presence or absence of TCTE … … … . … … … 5 3 Figure. 8. Melanin contents of cultured melan-a melanocytes after treatment with
1-50µM TCTE … … … ...54 Figure 9. Effects of TCTE on human epidermal equivalent (Melanoderm) … … .55 Figure 10. Effect of TCTE on UVB- induced pigmentation in vivo … … … ...57 Figure 11. Histological analysis of guinea pig skin samples treated with TCTE … ..58 Figure 12. Effects of TCTE on tyrosinase activity in melan-a melanocytes … … … .60 Figure 13. Effects of TCTE on tyrosinase activity in a cell free system … … … … ..61 Figure 14. Western blot analysis of tyrosinase, TRP-1 and TRP-2 on melan-a melanocytes treated with TCTE … … … .63 Figure 15. RT-PCR results of tyrosinase, trp-1, trp-2, mitf and β-actin … … .. … … ..64 Figure 16. Effects of TCTE on tyrosinase activity induced by c-AMP … … … .65
Figure 17. Effects of TCTE on cAMP accumulation … … … 6 7 Figure 18. Western blot analysis of Mitf … … … .... … 68 Figure 19. Effects of TCTE on the activation of ERK1/2 by TCTE treatment … … .69
LIST OF TABLES
Table 1. Structures of synthetic compounds used in this study .. … … … . . … … 3 3 Table 2. Primer sequences used for RT-PCR analysis .. … … … . … … … 4 8 Table 3. Effects on melanin synthesis and viability of test compounds … .. … … … ..50
LIST OF ABBREVIATIONS
bHGH-ZIP Basic/helix- loop-helix/leucine zipper cAMP Adenosine 3’,5’-cyclic monophosphate CRE cAMP responsive element
CREB cAMP responsive element binding protein DHICA 5, 6-Dihydroxyindole-2-carboxylic acid DOPA L-3, 4-dihydroxyphenylalanine
DMEM Dulbecco’s modified Eagle’s medium DMSO Dimethylsulfoxide
EDTA Ethylenediaminetetraacetic acid ERKs Extracellular signal- regulated kinases FBS Fetal bovine serum
GAPDH Glyceraldehyde 3-phosphate dehydrogenase HQ Hydroquinone
IBMX Isobutylmethyl xanthine
LAMP-1 Lysosome-associated membrane protein-1 MAPK Mitogen-activated protein kinase
MOPS 3-(N-morpholino) propane sulfonic acid MITF Microphthalmia-associate transcription factor
MTT 3-(4, 5-dimethylthiazol-2-yl)-2,5-diphenyltetrazolium bromide PAGE Polyacrylamide gel electrophoresis
PBS Phosphate-buffered saline PKA Protein kinase A
PKC Protein kinase C
PMSF Phenylmethylsulfonylfluoride
RT-PCR Reverse transcription-polymerase chain reaction SDS Sodium dodecylsulfate
TBS Tris-buffered saline TCA Trichloroacetic acid
TPA 12-O-tetra-decanoylphorbol-13-acetate TRP-1 Tyrosinase related protein-1
I. INTRODUCTION
A. Skin vs epidermis: structural relations
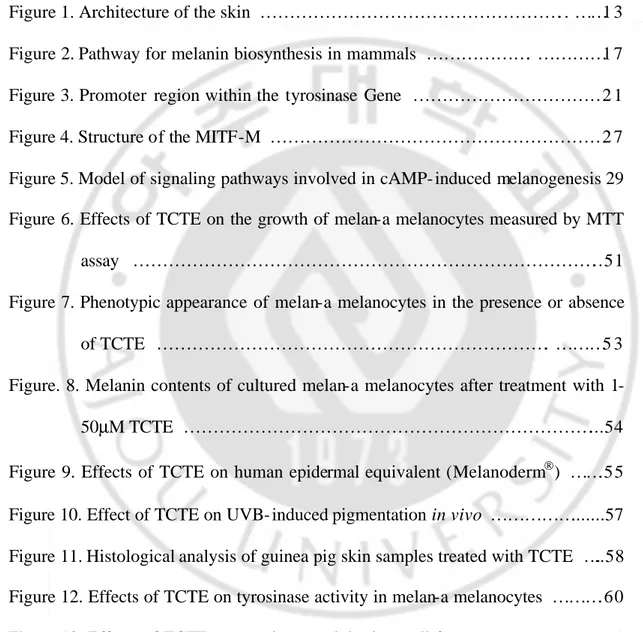
Skin is the largest organ of the body, of which functions are reducing water loss, providing protection against abrasive action, microorganisms. The epidermis is composed of several cell layers about 0.1 - 0.3 mm thick. From the external surface inwards, these layers are called stratum corneum, stratum granulosum, stratum spinosum (squamous cell layer) and basal layer1(Figure 1). Keratinocytes and melanocytes are the two major cell types within epidermis. Keratinocytes make up more than 90% of the epidermis. Melanocytes, which produce the pigment melanin, are scattered between the basal cells at the basal layer.
Figure 1. Architecture of the skin
Dermis
Stratum corneum Stratum granulosum
Stratum spinosum Basal layer
Melanocytes are typically highly dendritic cells that originate from the neural crest during embryo nic development. They subsequently migrate throughout the developing organism to three principal locations: the skin (at the epidermal/dermal border), the eyes (in the choroids and retina), and the hair bulbs.2 Epidermal melanocytes synthesize melanosomes that become ellipsoidal in shape and, more or less, uniformly pigmented by melanin deposited on an internal matrix of aligned filaments.
Melanosomes contain all the necessary machinery to synthesize melanin. Melanosomes and lysosomes may share common pathways in the endoplasmic reticulum (ER) since melanosomes possess lysosome-associated membrane protein 1 (LAMP-1). 3 When melanosomes first emerge (stages I and II), they are localized around the perinuclear regions, lacking many of the melanogenic proteins.2, 4 As melanosomes mature into stages III and IV, the coated vesicles containing melanogenic enzymes fuse with these premature melanosomes. Active melanogenesis within melanosomes leads to an increase in the opacity of the organelle as newly synthesized melanin is deposited. 2,4 The mature melanosomes are moved from the cell body of the melanocytes to its dendrites that are in contact with neighboring keratinocytes of the malpighian layer. The melanosomes move from the dendrites into the keratinocytes. There are three major theories about how melanosomes are acquired by keratinocytes: keratinocytes phagocytize bits of the melanosome containing dendrites; melanosomes are discharged by the dendrites into the intercellular space and subsequently phagocytized by keratinocytes; and the
dendrite and keratinocyte plasma membranes fuse to form cytoplasmic channel through which the melanosomes pass directly from the melanocyte into the keratinocyte.5 , 6 Upon incorporation into keratinocytes, melanosomes, which are considered to be specialized lysosomes, interact with lysosomes of the keratinocyte and are sequestered within them forming secondary lysosomes.7 As a general rule, melanosomes larger than approximately 1 µM in diameter are packaged singly in secondary lysosomes, whereas those smaller than 1 µM are sequestered in groups of varying size within a secondary lysosome.8 Within the basal layer of epidermis, one melanocyte is in contact with about 36 keratinocytes through its dendritic extensions.2
B. Melanogenesis
1. Biosynthetic pathway
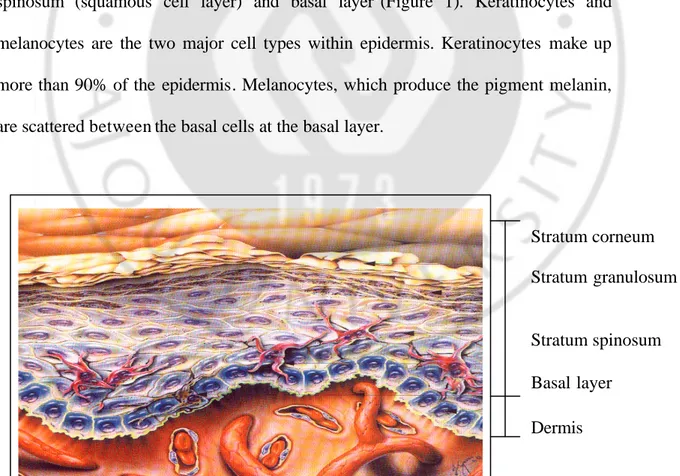
Melanogenesis involves a complex cascade of enzymatic reactions starting with the amino acid tyrosine as a substrate (Figure 2). L-Tyrosine is oxidized to L-3, 4-dihydroxyp henylalanine (DOPA), which is oxidized to DOPA-quinone, which rearranges to leucoDOPAchrome and then to DOPAchrome. In the presence of oxygen, DOPAchrome loses its carboxyl group to become 5,6-dihydroxyindole (DHI), which further oxidizes to indole-5, 6-quinone and then to melanochrome, a purple compound that polymerizes to melanin.9 A parallel but less understood pathway is that of pheomelanin (red or yellow melanin) synthesis, wherein
glutathione and/or cysteine are conjugated with DOPAquinone to form the alanyl-hydroxyl-benzothiazine subunits (figure 2). The synthesis of melanin polymer requires at least three enzymes: tyrosinase, tyrosinase-related protein-1 (TRP-1) and tyrosinase-related protein-2 (TRP-2). Among these three enzymes, tyrosinase is the key and rate- limiting one.
2. Tyrosinase
(A) Biochemical properties
Three key enzymes involved in melanin synthesis are tyrosinase (EC1.14.18.1) and tyrosinase related proteins 1 and 2 (TRP-1 and TRP-2) .10 Among them tyrosinase is the most critical and rate- limiting enzyme.11, 12 Tyrosinase catalyzes the
Figure 2. Pathway for melanin biosynthesis in mammals (Adopted from VJ
Hearing: Regulation of Melanin Formation from The Pigmentary system, edited by JJ Norduland, RE Boissy, VJ Hearing, RA King and J Ortonne New York. Oxford University Press, 1998. Chap. 28, pp 392)
first two steps in the biosynthetic pathway for melanin, hydroxylation of tyrosine to L-DOPA and oxidation of DOPA to Dopaquinone.13 L-DOPA is required as a cofactor and also serves as a substrate for tyrosinase.12, 14 The exact interaction sites on tyrosinase for the substrate and L-DOPA cofactor have not yet been identified. However, in vitro kinetic studies suggest that two separate binding sites exist for substrate and cofactor on tyrosinase. Binding of cofactor to tyrosinase is thought to induce a conformational change of tyrosinase, leading to an increased affinity of the enzyme for the substrate.15 Binding of two copper ions to histidine residues on the active catalytic sites of tyrosinase is required for catalytic activity.16
Tyrosinase cDNA sequences identified from patients with oculocutaneous albinism frequently display mutations in the catalytic region, often in the histidine rich sequences (amino acid residues 154 - 220 and 343 - 385).17 Tyrosinase is composed of 511 amino acids and can be divided into three domains: an inner domain, a transmembrane domain and a cytoplasmic domain.18 The inner domain, consisting of more than 90% of the protein, contains the catalytic region. The cytoplasmic domain is composed of approximately 30 amino acids. The relevant biological function of the cytoplasmic domain remained unclear until recent years. In a mutant mouse where the entire cytoplasmic domain of tyrosinase is missing, tyrosinase protein is incorrectly inserted into the plasma membrane, suggesting that this domain contains sequences for proper trafficking of tyrosinase into melanosomes.19 Subsequent mutagenesis experiments suggested that the di- leucine motif EXXQPLL (amino acid positions 491 to 497, where ‘X’ stands for any amino
acid) in the cytoplasmic domain is responsible for proper trafficking to melanosomes.20 In addition, phosphorylation of serine residues at amino acid positions 505 and 509 on the cytoplasmic domain of tyrosinase by protein kinase C-β (PKC-β) has been shown to regulate the activation of human tyrosinase.18 Tyrosinase is a glycoprotein synthesized as a precursor protein of 58 kDa. The nascent chain of tyrosinase is processed in the Golgi complex where sialic acid and neutral sugars are added through N- and O- glycosidic linkages. The enzyme is then packed into coated vesicles and delivered to melanosomes.21 Four types of tyrosinase were resolved by sodium dodecyl sulfate-polyacrylamide gel electrophoresis (SDS-PAGE), with molecular weights ranging between 65 kDa and 75 kDa, depending on glycosylation states.20 Proper glycosylation of tyrosinase was shown to be critical for melanogenesis because inhibition of glycosylation caused inhibition of melanogenesis.20 Proper folding of tyrosinase in the ER is crucial for the trafficking of tyrosinase into the Golgi apparatus and ultimately into melanosomes. Tyrosinase-negative albinism has been linked to mutations in tyrosinase which result in misfolding, retention in the ER and degradation of tyrosinase.22
(B) Genetic regulations
The entire mouse and human tyrosinase genomic DNA is 60-70kb and 50kb, respectively. The mouse tyrosinase gene was mapped to chromosome 7, the albino locus.23, 24 The human tyrosinase gene maps to chromosome 11 and shares up to 80%
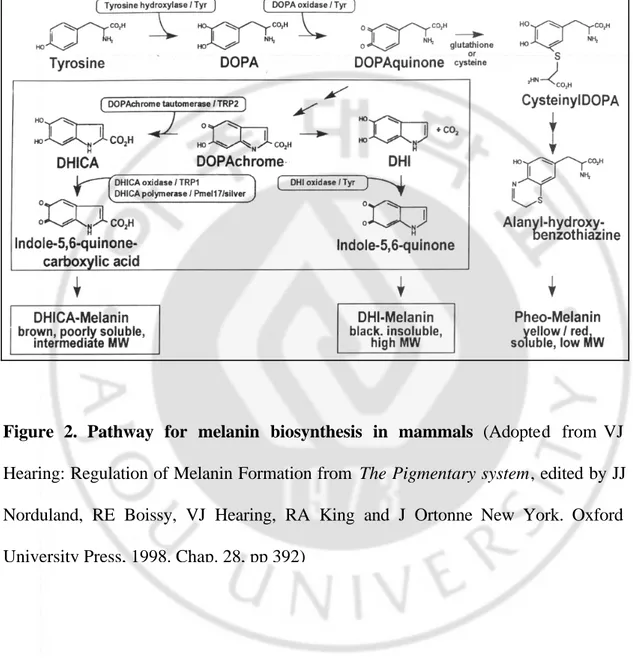
homology with its mouse homolog.25-28 The processed human tyrosinase mRNA is approximately 2.4kb and comprised of five exons and four introns.29 In the human tyrosinase gene, the transcription starts at 80 nucleotides upstream of the ATG translation start site. Interestingly, the canonical TATA box (TATAAA), which directs accurate initiation of gene transcription, is not found in the tyrosinase promoter region. But a TATA- like sequence (TATATA) has been identified approximately 32 nucleotides upstream of the transcription start site. Moreover, the initiator region (Inr) and non-consensus Sp-1 binding sites (GGTGGGAGTGGT) in the promoter region, implicated to function similarly to the TATA box when the TATA box is absent, are also identified within the human tyrosinase promoter region. The Inr includes an E-box motif (CATGTG), which is the binding site for a family of basic/helix- loop-helix/leucine zipper (bHLH-ZIP) transcription factors (Figure 3). 29,30
Figure 3. Promoter Region within the Tyrosinase Gene (Adopted from VJ
Hearing: Regulation of Melanin Formation from The Pigmentary system, edited by J.J Norduland, RE Boissy, VJ Hearing, RA King and J Ortonne New York. Oxford University Press, 1998. Chap. 28, pp 392)
3. Tyrosinase-related Protein 1 (TRP-1)
Two tyrosinase-related proteins, TRP-1 and TRP-2, were identified and shown to play important roles in melanogenesis.31, 32 TRP-1, TRP-2 and tyrosinase share up to 40% amino acid homology. Similar to tyrosinase, TRP-1 and TRP-2 contain a signal peptide, a transmembrane domain, and histidine- and cysteine-rich sequences.33 The conservation of nucleotide and amino acid sequences between these three melanogenic enzymes has led to an implication that they originated from a common ancestral gene.33, 34
TRP-1 maps to the brown locus on chromosome 4 in mice and spans about 18kb on the genome.35 The human homologous gene of TRP-1 maps to chromosome 9 and
spreads over 24 kb of the genomic DNA.35 The processed mRNA of human TRP-1 is composed of 7 exons and 6 introns. About 43% amino acid identity has been observed between tyrosinase and TRP-1 protein.33 TRP-1 is a glycosylated transmembrane protein imbedded in the melanosomal membrane. The function of TRP-1 in melanogenesis, especially in human melanogenesis, is not well elucidated. It has been proposed to display tyrosinase- like,35 DOPAchrome tautomerase,36 tyrosine hydroxylase,37 DOPA oxidase,38 melanosomal catalase,39 and DHICA oxidase enzymatic activities, all in mouse pigment cells.31,40 In contrast, human TRP-1 did not display DHICA oxidase activity in that transfected TRP-TRP-1 in human fibroblasts had no DHICA oxidase activity.41 These results suggest a difference in the function of mouse and human TRP-1. More recently TRP-1 was shown to influence tyrosinase activity by forming a complex and/or stabilizing tyrosinase in mouse melanocytes, although reports were contradictory as to whether TRP-1 increases or decreases tyrosinase activity.42,43 One group reported that expression of TRP-1 in mouse melanocytes increased the stability of tyrosinase and the level of pigment.42 On the other hand, another group reported that tyrosinase and TRP-1 were identified in a multimeric complex and dissociation of the complex resulted in a two-fold increase in tyrosinase activity.43
4. Tyrosinase related protein 2 (TRP-2)
TRP-2 maps to the slaty locus on chromosome 14 in mouse and chromosome 13 in human.44 Mouse and human TRP-2 share 84 % nucleotide identity.45 The entire
human TRP-2 genomic DNA is 55kb, the processed mRNA is composed of 8 exons and 7 introns and the protein is composed of 519 amino acids.34 TRP-2 is a glycoprotein similar to tyrosinase. Glycosylation is required for its normal function.46 The fully glycosylated TRP-2 has a molecular weight of about 75-80 kDa. In melanogenesis, it converts dopachrome to the carboxylated derivative 5, 6-dihydroxyindole-2-carboxylic acid (DHICA). It requires zinc for its enzymatic activity.47
C. Regulation of Melanogenesis
1. Cyclic AMP (cAMP)-dependent Pathway
(A) cAMP as a Secondary Messenger
cAMP is one of the first identified secondary messengers. cAMP is synthesized from ATP by adenylyl cyclase and degraded into AMP by cyclic AMP phosphodiesterase.48 Rapid synthesis and removal of intracellular cAMP allows modulation of the intracellular cAMP level within a very short period of time. The intracellular level of cAMP is regulated by a membrane-associate enzyme called adenylyl cyclase, which is activated upon the binding of cell surface receptors to their specific ligands via coupling with GTP-binding proteins.49, 50 Similar to PKC, cAMP plays a key role in diverse biological functions such as intermediary metabolism, cellular growth, differentiation and neuronal signaling.51, 52 cAMP-dependent protein kinase (PKA), a serine/threonine kinase consisting of two regulatory subunits and two catalytic subunits, was shown to mediate most of the
biological action of cAMP.50 PKA exists as an inactive form and binding of cAMP to the regulatory subunits releases the catalytic subunit and activates the enzyme. 50 Activation of PKA turns on/off the transcription of multiple genes such as somatostatin, enkephalin, c- fos, fibronectin and aromatase.53 Activation of these genes involves interaction between the cAMP-response element binding protein (CREB) and the cAMP-response element (CRE). CRE (TGACGTCA) is typically found within 100 nucleotides of the TATA box and CREB is activated in part through phosphorylation by the catalytic subunit of PKA.54 Dissociation of catalytic subunits from the regulatory subunits allows the translocation of the catalytic subunit to the nucleus.55
(B) Role of cAMP in pigmentation
cAMP has long been implicated as a key regulator of pigmentation. In murine melanoma cells, α-MSH, forskolin, isobutylmethyl xanthine (IBMX), or dibutyryl cAMP which raise the intracellular concentration of cAMP were shown to induce pigmentation and increases in tyrosinase mRNA, protein and activity.56-59 These cAMP- induced changes in tyrosinase were delayed by several days, 60 even though increase in cAMP occurred within 30 minutes of treatment.60 Consistent with this delayed response, protein synthesis appeared to be required for cAMP- induced pigmentation, since addition of cycloheximide blocked the α-MSH induced pigmentation in murine melanoma cells .60 In murine melanoma cells, the half- life of
tyrosinase was unaffected by cAMP, but the rate of tyrosinase gene transcription was upregulated, increasing the mRNA level.61 The transcription factor Mitf has been shown to mediate cAMP- induced tyrosinase gene transcription.62
2. Protein kinase C-β(PKC-β )-dependent pathways
In human melanocytes, α, β, ε, δ, and ζ isoforms of PKC have been shown to be expressed, and a critical role of PKC in pigmentation has become clear in the past decade.63, 64 It was first observed that addition of diacyl glycerol (DAG) to cultured human melanocytes caused a rapid increase in melanin content and this increase could be blocked by a PKC inhibitor.65 Moreover, topical application of active DAG species to guinea pig skin increased melanogenesis, while a DAG species not capable of activating PKC failed to do so.66 In melanocytes cultured from several donors of different complexion total PKC activity was found to correlate with total melanin content and the activity of tyrosinase paralleled the activity of PKC.67 Furthermore, immunoblots revealed that the level of PKC-β, but not the comparably expressed PKC-α, correlated with the total pigment content. 67 In an amelanotic human melanoma cell line NP-MM4 that has lost the expression of PKC-β but has tyrosinase protein, transfection of PKC-β cDNA activated the otherwise inactive tyrosinase, strongly suggesting that PKC-β was required to activate tyrosinase. 67 Subsequently, it was demonstrated that PKC-β phosphorylated two serine residues at
amino acid position 505 and 509 on the cytoplasmic domain of tyrosinase, which led to activation of tyrosinase.18
3. Microphthalmia-associated transcription factor (Mitf) and mitogen-activated protein kinase (MAPK)
(A) Mitf and its function
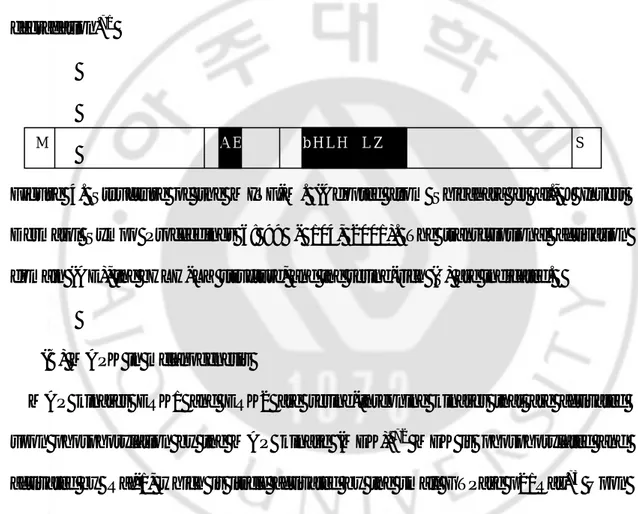
Mitf maps to the mi locus on chromosome 6 in mouse68, whereas the human homolog of the mouse mi gene, microphthalmia-associated transcription factor (MITF) maps to chromosome 3p12.3-p14.1.69 Mitf and MITF consist of 419 amino acid and share 94.4% amino acid identity. Mitf is predicted to contain a basic helix-loop- helix and a leucine- zipper (bHLH-LZ) structure (Figure 4.). The bHLH- LZ structure is required for DNA binding and dimerization.70
Mitf is a key transcription factor for the regulation of tyrosinase gene expression as well as for the tissue-specific expression of tyrosinase. Mitf interacts with the E-box motif present within the Inr, tyrosinase distal element (TDE) and M-E-box (Figure 3). The interactions between Mitf and the E-box present within the Inr and TDE are thought to govern tissue-specific expression of tyrosinase, whereas binding of Mitf to the E-box present within the M-box is believed to regulate the level of tyrosinase gene expression in response to extracellular stimuli.
Many growth factor signaling pathways have been implicated for regulation of Mitf at both protein and promoter levels. Most notably, steel factor/c-Kit signaling pathway was linked to phosphorylation of Mitf at Ser73 and Ser409 through
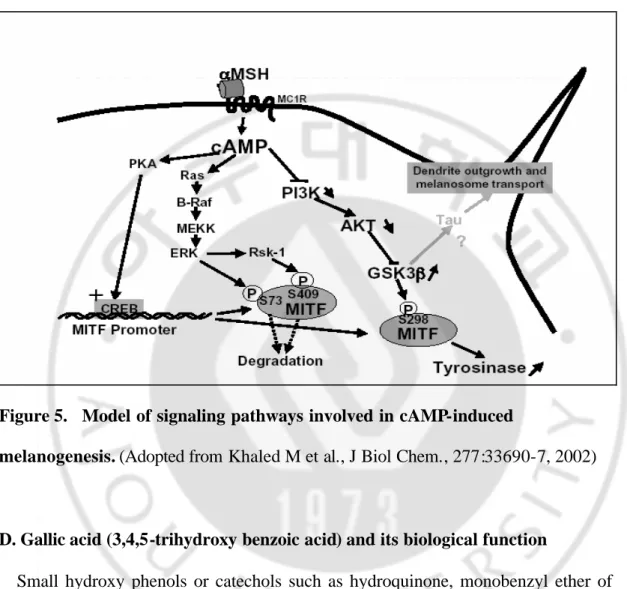
activation of MAP kinase and RSK-1, respectively. A recent study showed that phosphorylation of Mitf is also conducted at Ser298 through GSK3β. ERK-dependent phosphorylation of Mitf at Ser73 is essential for Mitf ubiquitination and degradation.71
Figure 4. Structure of the MITF-M. (Adopted from Shibahara et al., J Invest
Dermatol Sympo Proceedings 6: 99 - 104, 2001). The transcriptional activation domain (AE), the bHLH- LZ structure, and the serine-rich (S) are indicated.
(B) MAPK in melanogenesis
MAP kinases ERK1 and ERK2 are serine-threonine kinases that are activated upon phosphorylation by the MAP kinase (MEK). 72 MEK is phosphorylated and activated by Raf-1, which is itself activated by the small GTPase p21Ras.73 Upon activation, ERKs translocate to the nucleus where they phosphorylate and activate transcription factors involved in cell proliferation or differentiation, depending on the cell system.
In many cell types, cAMP has been reported to inhibit the MAP kinase pathway. However, it has been shown that cAMP up-regulation activates MAPK (ERK1, ERK2) in B16 melanoma cells and in normal human melanocytes.74, 75
Activation of MAPK in melanocytes is mediated by the activation of Ras GTPase M A E A b H L H L Z S
and the activation of B-Raf kinase75, a Raf isoform that is highly expressed in tissues of neural origin.
Recent studies have connected MAP kinases and melanocyte behavior. During melanocyte development, the cytokine steel factor (Sl) activates its receptor (c-kit) and this triggers the activation of MAPK. The steel factor action is thought to be a crucial event for later pigmentation since germline mutations at the locus encoding
c-kit or steel factor result in defects in melanocyte development.76 These findings
suggest that Mitf phosphorylation by MAPK is an important event in the regulation of melanocyte development. However, melanoma cell treatment with a specific inhibitor of the MAPK pathway, the MEK inhibitor PD98059 or the overexpression of dominant negative mutants of Ras and MEK induce melanogenesis due to an increase in tyrosinase expression. Similarly, overexpression of constitutive active mutants of Ras and MEK, inhibits tyrosinase expression and melanogenesis.77 These data reveal that sustained MAPK activation inhibit melanogenesis. In summary, although the phosphorylation of Mitf at Ser73 increases its intrinsic transcriptional activity, this phosphorylation also targets Mitf to the proteasome for its degradation. Consequently, the decrease in Mitf levels leads to a down-regulation of melanogenic enzymes expression and to an inhibition of melanogenesis.
Figure 5. Model of signaling pathways involved in cAMP-induced
melanogenesis. (Adopted from Khaled M et al., J Biol Chem., 277:33690-7, 2002)
D. Gallic acid (3,4,5-trihydroxy benzoic acid) and its biological function
Small hydroxy phenols or catechols such as hydroquinone, monobenzyl ether of hydroquinone and 4-Isopropylcatechol have been reported to cause depigmentation of the skin. But the use of these chemicals on hyperpigmentary disease of the skin has been restricted for the cytotoxic effects or side effects of them.78
Gallic acid (3,4,5-trihydroxy benzoic acid) is a naturally occurring small hydroxy phenols in plants and known to be an antioxidant.79, 80 Gallic acid is also known for inhibitor for human DNA polymerase81 and anti-HIV agent.82 It was reported that gallic acid inhibited the proliferation of metastatic tumor cells, such as P815 murine
mastocytoma, B16 murine melanoma and L5178 murine lymphoma cells.83It was also reported that gallic acid and methyl gallate inhibited 12-O-tetra-decanoylphorbol-13-acetate (TPA)- induced skin tumor formation.84 In the pigmentation, H2O2 has been reported to enhance the melanogenesis of B16 melanoma cells.85 There is a report that gallic acid and their esters have and protective effects on cell damage induced by hydroxyl radicals and hydrogen peroxides.85 In addition, the three gallate-propyl, octyl and dodecyl-are currently permitted for use as an antioxidant additives in food.86 Although there is no reports on the effects of the gallic acid on melanogenesis, the various biological effects of gallic acid suggest that it can have a potent regulatory effects of melanogenesis.
E. Purpose of this work
Various dermatologic disorders result in the accumulation of excessive levels of epidermal melanin pigments. Current therapies for hyperpigmented dermatoses include melasma, age spots or liver spots, and actinic damage (i.e. due to solar ultraviolet irradiation) are inadequate for these conditions. The U.S. FDA-approved pharmaceutical products containing 2-4% hydroquinone (HQ) are moderately efficacious, but HQ is considered to be cytotoxic to melanocytes and potentially mutagenic to mammalian cells.87
In spite of the lack of report on the effects of gallic acid on melanogenesis, it can be assumed to have a depigmentation effect of the skin as other small hydroxy phenols. In addition, a preliminary study showed that gallic acid had both melanin
inhibition activity and melanocyte cytotoxicity. This study was done to investigate the inhibitory effects of gallic acid and its derivatives on melanogenesis. Seven gallic acid derivatives and two cinnamic acid derivatives were synthesized including 3, 4, 5 - trimethoxy cinnamic acid thymol ester (TCTE), gallic acid thymol ester, trimethoxy gallic acid thymol ester, and etc. Every compound was tested for about cell viability and melanin synthesis in melan-a melanocytes. TCTE effectively inhibited melanin synthesis even at a concentration producing little cytotoxicity. Because this compound is neither an antioxidant nor direct tyrosinase inhibitor, further study was done to elucidate the inhibitory mechanism of TCTE.
II. MATERIALS and METHODS
A. Materials
1. Compounds used in this study
Twelve compounds were used for the in vitro screening of depigmenting potential in melan-a melanocytes. Gallic acid, 3, 4, 5-trimethoxy benzoic acid and thymol were obtained from Sigma (St. Louis, MO). We synthesized 5- methyl-2- (methylethyl) phenyl-3, 4, 5-trihydroxybenzoate, 5- methyl-2- (methylethyl) phenyl-4, dihydroxy- 3-methoxybenzoate, methyl-2- (methylethyl) phenyl-4- hydroxy-3, dimethoxybenzoate. methyl-2-(methylethyl)phenyl-3,4,trimethoxy benzoate, 5-methyl-2-(methylethyl)phenyl-3, 4, 5-triethoxy benzoate, 5- methyl-2- (methylethyl) phenyl-3, 4, 5-triprophoxybenzoate, 6- methyl-3- (methylethyl)-3, 4, 5-tributhoxy benzoate, 5- methyl-2- (methylethyl) phenyl-3, 4, 5-trimethoxy cinnamate and 6-methyl-3- (methylethyl)-3, 4, 5-triemthoxy cinnamate.
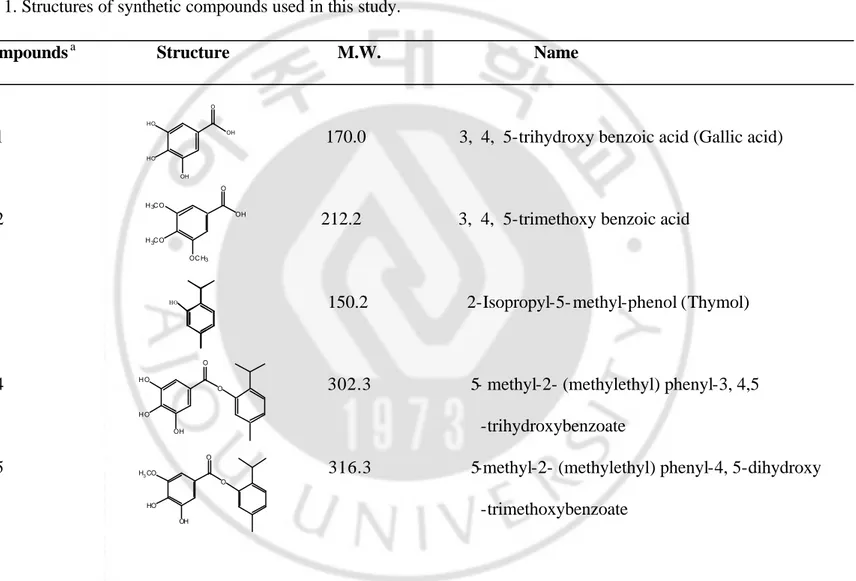
Table 1. Structures of synthetic compounds used in this study.
Compoundsa Structure M.W. Name
1 170.0 3, 4, 5-trihydroxy benzoic acid (Gallic acid)
2 212.2 3, 4, 5-trimethoxy benzoic acid
3 150.2 2-Isopropyl-5- methyl-phenol (Thymol)
4 302.3 5- methyl-2- (methylethyl) phenyl-3, 4,5 -trihydroxybenzoate
5 316.3 5-methyl-2- (methylethyl) phenyl-4, 5-dihydroxy -trimethoxybenzoate HO OH O HO HO OH OH O H3C O H3C O OC H3 O H O H O OH O O H3CO HO OH O
6 330.3 5-methyl-2- (methylethyl) phenyl-4-hydroxy- 3, 5-dimethoxybenzoate
7 344.4 5-methyl-2-(methylethyl)phenyl-3, 4, 5-trimethoxy benzoate
8 386.4 5-methyl-2-(methylethyl)phenyl-3, 4, 5-triethoxy benzoate
9 428.5 5-methyl-2- (methylethyl) phenyl-3, 4, 5-triprophoxybenzoate
10 470.6 5-methyl-2- (methylethyl)phenyl-3, 4, 5-tributhoxy benzoate
11 370.4 5-methyl-2- (methylethyl) phenyl-3, 4,5-trimethoxy cinnamate
[TCTE]
12 370.4 2-methyl-5- (methylethyl) phenyl-3, 4, 5-triemthoxy cinnamate O H3CO HO O CH3 O O H3CO H3CO O CH3 O O E t O E t O OE t O O OP r OP r PrO O O OB u OB u B uO O H3CO H3CO OCH3 O O H3CO H3CO OCH3 O O a
2. Melan-a melanocytes
Melan-a melanocytes are highly pigmented, immortalized normal murine melanocyte cell line derived from C57BL/6 mice. The melan-a melanocytes used in this study were obtained from Dr. Dorothy Bennett (St. George's Hospital, London, UK). Cells were grown and maintained at 37 °C in an atmosphere of 95 % air, 5 % CO2 in RPMI-1640 (Bio Whittaker, Walkersville, MA) supplemented to a final concentration of 10% heat- inactivated fetal bovine serum, 5 units/ml penicillin, 5 µg/ml streptomycin and 200 nM phorbol 12- myristate 13-acetate. Cells were passaged every 3 days with a maximal passage number of 33. Confluent monolayers of melanocytes were harvested with a mixture of 0.05 % trypsin, 0.53 mM EDTA (Gibco BRL, Grand Island, NY).
3. Human epidermal equivalent (Melanoderm)
Epidermal equivalents containing melanocytes (Melanoderm) were purchased from MatTek (Ashland, MA) and were maintained according to the manufacturer’s instructions. Briefly, melanoderm tissue samples were placed onto 6 well plates and maintained at 37 °C in an atmosphere of 95 % air, 5 % CO2 with change of media (long life maintenance medium supplied from MatTek) every two days.
4. Brown guinea pigs
used for the assessment of depigmentation effects of compounds on UVB- induced hyperpigmentation.
5. Reagents and supplies
L- [ring-3, 5-3H] tyrosine (46.7Ci per mmol) was purchased from Perkin- Elmer Life Sciences, Inc (Boston, MA). Fetal bovine serums were purchased from Hy Clone Laboratories (Logan, UT). cAMP assay kit was purchased from Molecular Probes (Eugene, Oregon). Trizol Reagent was purchased from Gibco BRL. All other chemicals, including bovine serum albumine, dihydorxyphenylalanine (L-DOPA), L-tyrosine, IBMX, phenylmethylsulfonyl fluoride (PMSF), streptomycin, Triton X-100, commassie blue, trichloroacetic acid (TCA) and 12-O-tetradecanoylphorbol 13-acetate (TPA) were purchased from Sigma (St. Louis, MO).
B. Methods
1. Measurements of melanin content and cell viability
To measure the effects of compounds on melanin synthesis and cell viability, the melan-a melanocytes were used. Measurement of melanin content and cell number in melan-a melanocytes were performed as described previously88 with minor modifications. The cells (1x10⁵) were seeded into 24 well plate, test compounds were treated in triplicate. Medium was changed daily and after 4 days of culture, the cells were lysed with 1ml of 1 N NaOH. For analysis, 200 µl of each crude cell extracts were transferred into 96-well plates. Relative melanin content was measured at 400 nm with an enzyme- linked immunosorbent assay (ELISA) reader (Bio-Tex instruments). Cell viability was determined by the crystal violet assay. The culture medium was removed from the 24-well culture plates and replaced with 0.5 ml of 0.1% crystal violet in 10% ethanol per well. The plates were stained for 5 min at room temperature and rinsed four times. Crystal violet retained by adherent cell was extracted with 1ml of 95% ethanol. Absorbance was determined at 540 nm using ELISA reader. The inhibition concentration which 50% of the melanin content reduction (depig. IC50) and 50% of the cell number reduction (cytotox. IC50) were measured on each compounds (Table 3).
2. Assay of cell proliferation
cultured with 1 – 50 µM TCTE for 0 - 72 hrs. The proliferation of melan-a melanocytes was measured using a modified methylthiazoletetrazolium (MTT) assay. The cells (1x 10⁴) were plated on a 96-well multi-plate (Falcon, No3072) at 1 x 10⁴ cells per well and allowed to attach overnight. The cells were treated with different concentrations of compound daily for 3 days. MTT solution (2 mg/ml) was added to each well and incubated for a further 3 hr, following that the medium was removed and formazan crystals were solubilized in dimethylsulfoxide (DMSO) with gentle shaking. Cell proliferation was monitored at various stages by measuring the amount of formazan dye at 540 nm with an enzyme- linked immunosorbent assay (ELISA) reader (Bio-Tex instruments, Winooski, VT)
3. Melanin assay using human epidermal equivalent (Melanoderm)
To know the effects of TCTE on melanin synthesis in human epidermis model, Melanoderm was used for melanin assay. Epidermal equivalents containing melanocytes (Melanoderm) were from MatTek (Ashland, MA) and were maintained according to the manufacturer’s instructions. Briefly, melanoderm tissue samples were placed onto 6 well plates and media (long life maintenance medium supplied from MatTek) were changed every 2 days. TCTE, Kojic acid and dimethylsulfoxide (DMSO) were treated onto melanoderm tissues every 2 days for 2 weeks. At days 10 and 14, melanoderm tissues were washed with PBS two times and homogenized with glass homogenizer (Kontes, Vineland, NJ). Proteinase K was added to the
homogenized samples and incubated at 45 °C overnight. Proteinase K was added again and incubated at 45 °C for 12 hrs. 30 % H2O2 was added to the homogenate and incubated 30 min at 80 °C. After extraction with chloroform: methanol (2:1), centrifuged at 1,000 x g for 10min. Supernatant was transferred to 96 well plate and read absorbance at 405nm with ELISA reader.
4. Pigmentation assays in UVB-induced hyperpigmentation using brown guinea pig
UVB- induced hyperpigmentation is elicited on the backs of brown guinea pigs weighing about 500 g each using a modification of the method of Imokawa et al.88 Guinea pigs were anesthetized with pentobarbital (30 mg/kg) and 12 separate areas (1 cm diametric circle) on the black of each animal are exposed to UVB radiation (Waldmann UV 800, Herbert Waldmann GmbH&E, Philis TL/12 lamp emitting 280-305 nm). The UVB intensity was 2mW/cm2 and the total energy dose of UVB is 500 mJ/cm2 per exposure. Group of 4 animals are used in experiment. The animals are exposed to UVB radiation once a week for 3 consecutive weeks. 1% TCTE (26.9 mM) was used for this study because usually it needs ten times concentration of drugs than in vitro model for the lower penetration efficiency of drugs into the skin for the stratum corneum barrier. Test agents were then topically applied to the hyperpigmented areas (10 µl/circle) two times a day for 8 weeks from next day of the UV irradiation. The degree of pigmentation was assessed as the L-value measured
with a chromameter (CR-300, Minolta, Japan) every two weeks from the beginning of application. Skin biopsy was done at the treated sites and stained with hematoxylin & eosin (H&E) for general histology and fontana- masson (F-M) for melanin staining.
5. In situ tyrosinase assays
Tyrosinase activity in melan-a melanocytes in situ was determined as described previously.90 Cells were seeded into 48well culture dishes at 2 x 10⁵ cells per well and allowed to attach overnight. The medium was then exchanged with compound under investigation. Medium was changed daily. 24 hrs before the termination of the experiment, medium was supplemented with 2 µCi [3H] tyrosine per ml. At the end of experiments, cells were collected for protein assay, and the radiolabeled medium was assayed for the presence of 3H2O using the charcoal absorption method.91
6. DOPA staining of gels (SDS-PAGE) for the visualization of tyrosinase activity on gel
Cell extracts were subjected to SDS gel electrophoresis as described elsewhere.92 Briefly, cells were removed and pelleted by centrifugation at 100 x g for 5 min, and the pellets were sonicated in 0.05 M sodium phosphate buffer (pH 6.8) containing 0.1mM PMSF and 1.0 % Triton X-100. The resulting homogenates was left at 4 °C for 1hour to release proteins from the melanosome membrane and was then
centrifuged at 10,000 x g for 15 min at 4 °C. The supernatant (20 – 50 micrograms) was separated by 10% Tris-Glycin Gel (1 mm-thickness, 10 wells, Invitrogen, Carlsbad, CA). Electrophoresis was carried out at 200 volt constant with Tris-glycin SDS running buffer (25 mM Tris base, 192 mM glycine, 0.1% SDS, pH 8.3)
The relative in situ enzymatic activity of tyrosinase in the SDS gel after electrophoresis was visualized by first placing the gel in 0.5M sodium phosphate buffer (pH 6.8) for 15 min. Gels were then incubated in 0.1M sodium phosphate buffer (pH 6.8) containing 0.2 % L-DOPA at 37 °C.
7. Tyrosinase activity assay (cell extracts, in vitro)
To investigate whether the inhibitory effects of TCTE on melanin synthesis was derived from the reduction of tyrosinase activity, the effects of TCTE on tyrosinase activity was checked in situ and visualized by DOPA reaction on gels after SDS-PAGE. After seeding the melan-a melanocytes, TCTE was treated and tyrosinase activity was measured after 72 hrs. Tyrosinase activity was measured according to Pomerantz et al.90 In brief, cells were harvested in buffer containing 80 mM PO43- (pH 6.8)/1% TRITON X-100, 10 mM PMSF and 100 ng/ml aprotinin, and 5 µM okadaic acid. Then tyrosinase was extracted by placing the samples on ice for 1-3 hrs. The cell lysates were clarified by spinning the samples at 14,000 rpm for 15 minutes at 4 °C. Protein concentration was determined by Bradford protein assay. Proteins (5-20 µg) were incubated with reaction mixture containing 2.3 µM L-tyrosinase, 23 µM
L-dihydroxyphenylalanine (L-DOPA), 5 µCi L-[3,5-3H]-tyrosine and 200µl of 80 mM PO43- (pH 6.8) at 37°C for 1 - 4 hrs depending on the basal pigment level of cells. The reaction was stopped by adding 250 µl of cold 0.2 % BSA and 500 µl of cold 10 % trichloroacetic acid (TCA). TCA precipitable proteins containing 3 H-tyrosine-incorporated proteins were pelleted by centrifugation at 14,000 rpm for 15 minutes at 4 °C. The pellet was discarded and the supernatant was further reacted with activated charcoal [50 % in 80 mM PO43- (pH 6.8), Sigma] to remove non- incorporated free 3
H-tyrosine. Radioactivity in the charcoal-treated supernatant was measured in a liquid scintillation counter. To determine non-specific background radioactivity, parallel lysates boiled for 15 minutes in the presence of 2 µl of 2- mercaptoethanol before the first reaction was used as baseline. The activity of tyrosinase was expressed as cpm of 3H-H2O released/µg protein/hour. The background radioactivity was subtracted from the total radioactivity.
8. cAMP measurement
To investigate the effects of TCTE on cAMP level, the amount of intracellular cAMP was measured after exposing melan-a melanocytes to 15 and 30 µM TCTE. To measure intracellular cAMP levels, cAMP assay kit (Molecular probe) was used according to the instructions by the manufacturer. Briefly, cells were plated into 6 well plates at 2 x10⁶ cells per well and allowed to attach overnight. The media were then removed from each well, and the cells were incubated for 40 min in fresh
FBS-free medium containing compound, following which the reactions were stopped with 10% trichloroaceticacid (TCA) and homogenized. The resulting suspensions were centrifuged for 10 min at 1,500 x g and supernatants were extracted with water-saturated diethyl ether and repeat at least 3 times, and the water phase was heated to 70 °C for 5 min to remove the residual ether. The extracted cAMP contents and reconstituted cAMP standard were measured by addition cAMP acetylcholinesterase tracer and cAMP antiserum into 96 well plates, and incubated for 18 hrs at room temperature. After washing the plate five times with PBS buffer, the plate was developed by 200µl of Ellman’s reagent (Cayman, Ann Arbor, MI) with gently shaking for 60-90 min, followed by reading at 405 nm in ELISA reader. The Contents of the cAMP sample was determined by comparing the absorbance of the sample with those of the cAMP standards.
9. Protein Assay
Concentration of protein lysates was determined by Bradford protein assay as described by elsewhere.93 Briefly, Bradford Reagent (5×, from BioRad) was diluted with deionized water to its working concentration. A small portion of the protein sample was added to 100 µl of phosphate-buffered saline (PBS) in a test tube. The protein sample was then mixed with 1 ml of the diluted Bradford Reagent and transferred into a plastic cuvet (BioRad), followed by OD595 measurement in an UV-160 spectrometer (Shimadzu, JAPAN). Concentration of the protein sample was
determined by comparing the OD595 value of the sample with those of the bovine albumin (BSA) standards.
10. Western blot analysis
The levels of tyrosinase, TRP-1, TRP-2, Mift, phospho ERKs and total ERKs were determined by immunoblot analysis as described previously.92 Briefly, melan-a melanocytes (100 mm culture dish) were scraped with 100µl of lysis buffer containing 80 mM PO43- (pH 6.8) /1 % triton X-100, PMSF (10 mM) (Sigma), aprotinin (100 ng/ml) (Sigma) and okadaic acid (5 µM) (Sigma). Scraped lysates were placed at 4°C for 1-3 hrs to extract membrane-bound proteins. Cell lysates were then clarified by spinning the samples at 4°C for 15 minutes at 12,000 rpm. The supernatant was saved and the pellet was discarded. Protein concentrations were determined by Bradford protein assay as described above. Proteins (10-20 µg) were separated by 10% NuPAGET M Bis- Tris Gel (1 mm- thickness, 10 wells, Invitrogen, Carlsbad, CA) with MOPS running buffer [50 mM 3-(N-morpholino) propane sulfonic acid, 50 mM Tris base, 15 mM SDS, 1 mM EDTA]. The proteins were transferred to nitrocellulose membranes using XCell IIT M Blot Module (NOVEX, Sandiego, CA), blocked with 5 % milk in PBS/0.1% Tween-20 at room temperature for 1 hour with shaking and incubated with specific primary antibodies at 4°C overnight. Antibodies were prepared in 5% milk in PBS/0.1% Tween-20 at the following dilutions: 1:200 polyclonal antibody against tyrosinase (M-13, Santa Cruz
Biotech, Santa Cruz, CA), 1 : 200 polyclonal antibody against TRP-1 (G-17, Santa Cruz Biotech), 1 : 200 polyclonal antibody against TRP-2 (αPEP-8, obtained form Dr. VJ Hearing), 1 : 1000 monoclonal antibody against actin (I-19, Santa Cruz), 1:1000 monoclonal antibody against phospholylated ERK (Cell signaling, technology, Beverly, MA), 1 : 1000 monoclonal antibody against total ERK and 1 : 200 monoclonal antibody against microphthalmia (NeoMarkers, Inc., fremont, CA). Antibody incubated blots were washed with PBS/ 0.1% Tween-20 for three times, 10 minutes each, followed by incubation with the corresponding secondary antibodies (1 : 1000 for the donkey anti- goat, or 1 : 1000 for the goat anti- mouse) (Santa Cruz Biotech) at room temperature for 1 hour. Blots were washed eight times for 5 minutes each with PBS/ 0.1% Tween-20 before ECL chemiluminescent detection of the proteins (ECL Plus Western blotting detection system, from Amersham Life Science, England ). Equal loading of each lane was verified by staining the membrane with Ponceau S solution (0.1% Ponceau S, 5% acetic acid) for 5 minutes, followed by destaining with deionized water until background became white.
11. RT-PCR analysis (tyrosinase, trp-1, trp-2, mitf and β - actin)
In order to exa mine whether TCTE affects tyrosinase and TRP-1 expression at the gene levels, melan-a melanocytes were treated with 15 and 30 µM TCTE for 48 hrs. RT-PCR analysis was done on tyrosinase, TRP-1, TRP-2 and Mitf transcription. Total cellular RNA was extracted from melan-a melanocytes using Trizol Reagent
(Gibcol BRL) according to the manufacturer’s instruction. Briefly, after incubation with stimulator and test compounds for 48 hrs, melan-a melanocytes were washed with PBS and lysed directly in culture dish by addition of 1 ml Trizoland removed into microtubes and incubated for 5 min at room temperature. The upper phase containing RNA was separated by the addition of chloroform and shaking vigorous ly for 15 seconds. The aqueous phase and organic phase were separated by centrifugation at 14,000 rpm for 15 minutes at 4°C. The RNA containing aqueous phase was transferred to a fresh tube and incubated with 0.5 ml of isopropyl alcohol at room temperature for 10 minutes to precipitate RNA. The RNA pellet was washed with 70% methanol, air dried briefly and reconstituted in RNase-free H2O. UV absorbance at 260 nm and 280 nm was measured with aliquots of RNA preparation for the determination of RNA content and purity. RT-PCR was performed to determine the level of tyrosinase, TRP-1 and TRP-2 gene expression. RNA-PCR was carried out using Takara’s One Step RNA PCR kit (Takara Schuzo Co., Japan) according to manufacturer’s instruction. From each sample, 100 ng of RNA was reversed-transcribed and then amplified the cDNA for detecting tyrosinase, TRP-1, TRP-2 and β-actin gene expression. Total reaction volume was 50µl per each sample containing 5 mM MgCl2, 1 mM dNTP, 0.8 units/㎕ RNase inhibitor, 0.1 units/㎕ AMV RTase, 0.1 units/㎕ AMV-optimized Taq, 20 pmol upstream and downstream PCR specific primers. The reaction was carried out in the thermocycler (GeneAmpT M PCR system 9700, Perkin Elmer, Foster City, CA) under the condition of 50 ºC for
30 min and 90 ºC for 30 sec for revere-transcription, and immediately followed PCR amplifications performed for 15 cycles under the optimal condition that 30 sec denaturation at 94 ºC, 30 sec annealing at 58 ºC and 1.5 min extension at 72 ºC. The amplified PCR products were electrophoresed on 1.2 % agarose gel and stained with 1µg/ml of ethidium bromide solution. The sequence of oligonucleotide primers used in this work for murine tyrosinase, TRP-1, TRP-2, Mitf and β-actin are shown in Table 2.
12. Statistical analysis
All experiments were performed three or four times and duplicate determinations were made for each treatment in each experiment. The results are expressed as the mean + standard deviation (SD). Some data are obtained from 2-3 separate experiments, others from single representative experiment. The statistical analysis of the results was performed using the two-tailed t-test.
Table 2. Primer sequences used for RT-PCR analysis
Target RNA Primer Sequence
Tyrosinase backward: 5’-GCAAAAGAATGCTGCCCACC-3’, forward: 5’-ATGTCCCTCCATATTTCAGAGCC-3’ TRP-1 backward: 5’-TATTGAGGCTCTGAGACGTGGGG-’3
forward: 5’-CTCCTTGTGGCAATGACAAATTG-3’ TRP-2 backward: 5’-TTCAGCACGCCATCCAAGGTCATG-3’
forward: 5’-GAGAAGCTCCCCTCATTAAACCTG-3’
Mitf backward: 5’-CGGGTAACGTATTTGCCATTTG3’
forward: 5’-GCCTGAAACCTTGCTAGGCTGG3’
β-actin backward: 5’-CTCCTTAATGTCACGCACGATTTC-3’ , forward: 5’-GTGGGGCTGCCCCAGGCACCA-3’
III. RESULTS
Part I. Screening and evaluation of gallic acid derivatives
1. Effects of gallic acid derivatives on melanin content and viability
The cytotoxic effect of gallic acid was reduced with the substitution of hydroxyl group with methyl group. The effects and cytotoxicity was significantly enhanced with the length of side chain (Table 3). Among them TCTE was most effective in lowering melanogenesis and cytotoxicity.
2. Effect of TCTE on melan-a melanocytes proliferation
TCTE had a strong inhibition on melanogenesis and a low cytotoxicity. There were no growth inhibition effects of TCTE until 30 µM and showed slight growth inhibition effects (22%) at 50 µM treatment at 48 hrs. About 40% growth inhibition was showed with 50 µM TCTE treatment at 72 hrs (Figure 6).
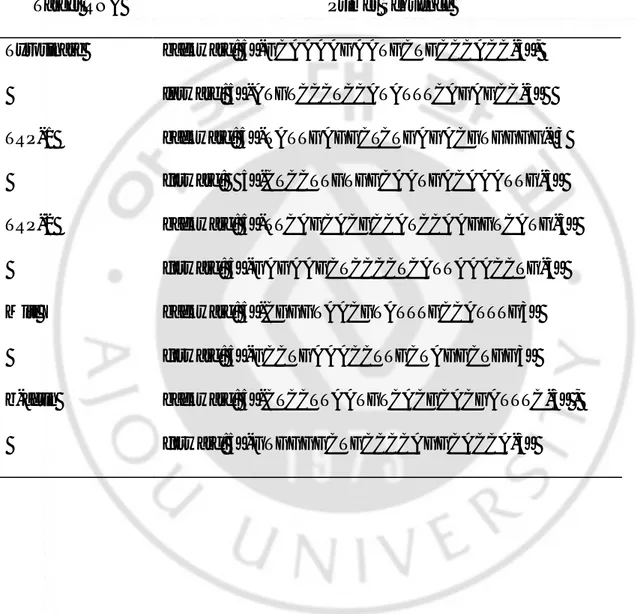
Table 3. Effects on melanin synthesis and viability of test compounds
Melan-a melanocytes Compounds
Depig. IC50(µM)a Cytotox. IC50(µM)b
Gallic acid 35 40
3,4,5-trimethoxy benzoic acid >80 >80
Thymol >300 >300
5- methyl-2- (methylethyl) phenyl-
3, 4,5-trihydroxybenzoate 25 40
5-methyl-2- (methylethyl) phenyl-
4, 5-dihydroxy -trimethoxybenzoate 35 53
5-methyl-2- (methylethyl) phenyl-4-
Hydroxy -3, 5-dimethoxybenzoate 23 >200
5-methyl-2-(methylethyl)phenyl-3,4,5
-trimethoxy benzoate 26 120
5-methyl-2-(methylethyl)phenyl-3,4,5
-triethoxy benzoate 30 >300
5-methyl-2- (methylethyl) phenyl
-3, 4,5-triprophoxybenzoate 12 >200
5-methyl-2- (methylethyl)phenyl-3,4,5-tributhoxy
benzoate 8 >300
5-methyl-2- (methylethyl) phenyl
-3, 4, 5-trimethoxycinnamate [TCTE] 10 >300 6-methyl-3- (methylethyl)phenyl
-3,4,5-trimethoxy cinnamate 10 >300
a
A concentration at which 50% melanin was redued.
b
0 0 . 4 0 . 8 1 . 2 1 . 6 2 0 24 48 72 Incubation time (hr) Absorbance at 540nm
Figure. 6. Effects of TCTE on the growth of melan-a melanocytes measured by MTT assay. Melan-a melanocytes were seeded into 96 wells and treated with DMSO
(˜), 1(¢), 15(p), 30(r) and 50(¿) µM TCTE for 24, 48 and 72 hrs, as described in the materials and methods. The values are the average of nine determinations + SD. *P<0.01
3. Effects of TCTE on melanin synthesis in melan-a melanocytes
When melan-a melanocytes were exposed to TCTE at doses (15 µM) causing no cytotoxicity for 48 hrs, a distinct reduction in pigmentation was observed. The melanins in dendrite or cytosol on melan-a melanocytes were significantly reduced compared with control (Figure 7, Figure 8. A). The dose-dependent inhibitory actions on melanin formation by TCTE were observed at 1, 15 and 30 µM for 96 hrs. The melanin synthesis was inhibited 57, 74 at 15, 30 µM respectively (Figure 8). There was no growth inhibitory effect at this condition. To investigate whether trimethoxy benzoic acid and thymol, the building blocks of TCTE also have inhibitory effect, these compound also tested separately. These compound showed no inhibitory effect of pigmentation with 30 µM treatment for 96hrs (Figure 8). This means that the inhibitory effect of TCTE is unique characteristic of this compound.
4. Effects of TCTE on melanin synthesis in Melanoderm model
When Melanoderm tissues were cultured in media, pigmentation was induced naturally (figure 9). There were no significant changes in melanin content in every treatment group at day 10. At day 14, melanin synthesis was decreased to 73% and 63% (tissue 1 and 2, respectively) with TCTE treatment compared with vehicle. Melanin content was decreased to 80% and 77% (tissue 1 and 2, respectively) control by kojic acid treatment at day 14.
Figure 7. Phenotypic appearance of melan-a melanocytes in the presence or absence of TCTE. Melan-a melanocytes were seeded onto 60 mm2 culture dishes and exposed to 15 µM TCTE (TCTE) or vehicle (V) for 48 hrs (upper row). The cells were examined by the phase-contrast microscopy (200 x). An identical field was viewed by bright- field optics to show dendritic and pigmented melanocytes (lower row, 200 x)
Figure. 8. Melanin contents of cultured melan-a melanocytes after treatment with TCTE. Melan-a melanocytes (1x 10⁵) were grown in 24-well plates. After incubation with 1, 15, 30 µM TCTE for 5 days, melanin content was subsequently measured as described in the Materia l and Methods (A) Photomicrograph of melan-a melanocytes treated with control (D), TCTE (T), trimethoxy benzoic acid (TMB, 30 µM) and thymol (30 µM). (B) Total melanin content was expressed as % vehicle treated group. Results are the means of three independent experiments+ S.D. * < 0.01 compared to vehicle. 94 9 8 98 81 91 96 100 8 8 2 6 4 3 9 2 1 0 0 0 . 0 2 0 . 0 4 0 . 0 6 0 . 0 8 0 . 0 1 0 0 . 0 1 2 0 . 0 C T15 T30 TMB Thymol * * % control A B C T1µM T15µM T30µM TMB Thymol * P < 0.01
TCTE KA Control
Tissue 1 Tissue 2
Figure 9. Effects of TCTE on human epidermal equivalent (Melanoderm). Kojic acid (1%) and TCTE (0.1%, 2.69 mM) were treated topically onto Melanoderm every 2 days for 2 weeks. (A) Photography of Melanoderm cultures. TCTE, TCTE 0.1%; KA, Kojic acid 1%; Control, DMSO. (B) After treatment, melanin was measured as described in Material and Methods.
14.8 12.4 15.9 14.5 16.8 22.1 0 5 1 0 1 5 2 0 2 5
TCTE Kojic acid C o n t r o l
Melanin content ( µ g/mg protein) D a y 1 0 D a y 1 4 Day 3 Day 7 Day10 Day14 22.2 19.8 23.3 21.9 24.2 29.5 0 5 1 0 1 5 2 0 2 5 3 0 3 5
TCTE Kojic acid C o n t r o l
Melanin content ( µ g/mg protein) D a y 1 0 D a y 1 4 Tissue 1 Tissue 2 (A) (B)
5. Effects of TCTE on UVB-induced hyperpigmentation in guinea pigs
L-values, which indicate the degree of pigmentation before and after up to 8 weeks of daily topical application of 1% TCTE, are shown in Fig. 10. The initial L-value of UVB- induced hyperpigmentation before topical application of TCTE was between 45.1 and 47.0. After 8 weeks, the hyperpigmentation was lightened by TCTE treatment (L- value 54.8), as compared with the vehicle treated area (L- value 49.0)(Figure 10). Melanin deposition was reduced in 1% TCTE treatment group shown by Fontana-Masson staining (Figure 11).
43 45 47 49 51 53 55 57 0 2 4 6 8 weeks L value (dark<-->light)
Figure 10. Effect of TCTE on UVB-induced pigmentation in vivo. Tanning was
induced on brown guinea pigs with irradiation of UVB (500 mJ/cm2). 1% TCTE (<) and vehicle (¡) were treated daily for 8 weeks. The degree of pigmentation (L-value) was measured with chromameter every two weeks. Data were expressed as mean L-value + S.D, and t-test for the statistical analysis of the data (* P<0.05 vs. control)
Control 1% TCTE
Figure 11. Histological analysis of guinea pig skin samples treated with TCTE.
Brown guinea pigs were treated as described in Fig. 20 and biopsies were taken at the eight weeks of treatment. H&E (a, b) and F-M (c, d) staining were done on the skin section. F-M staining of skin sections revealed reduction in melanin deposition at TCTE treated sites (d):
a
b
Part II. The inhibition mechanism of TCTE on melanin synthesis
1. Effect of TCTE on tyrosinase activity in situ
Tyrosinase activity was reduced to 20 and 40 % control after 15 and 30 µM TCTE treatment, respectively (Figure 12. A).
SDS-PAGE and DOPA staining of TCTE treated cell homogenates showed DOPA-reactive band in the position corresponding to 70 – 80 kDa, which was considered to be tyrosinase. The reactivity of such a tyrosinase band from treated cells was much weaker than that of control (Figure 12. B). The reactivity almost completely disappeared at 30 µM TCTE treatment.
2. Effects of TCTE on a tyrosinase activity (Cell extracts, in vitro)
To know whether TCTE inhibit tyrosinase directly or not, tyrosinase activity assay was done in a cell free system. TCTE did not reduce tyrosinase activity directly in a cell free system (Figure 13).
A
B
C 15µM 30µM
Figure 12. Effects of TCTE on tyrosinase activity in melan-a melanocytes.
Melan-a melanocytes were seeded into 24 well culture dishes at 1x 10⁵ cells per well and were treated with 1, 15, 30 µM TCTE for 72h. (A) During the last 24h, cells were incubated in medium containing [3H] tyrosine, and at the end of this time, tyrosinase activities were determined as described in Material and Methods. Values are the averages of three determinations + SD. * P<0.01 (B) Detergent extracts from control and TCTE-treated cells were electrophoresed on SDS polyacrylamide gels. After electrophoresis, the gels were incubated in L-DOPA to visualize tyrosinase. C, control; 15 µM, TCTE 15 µM; 30 µM, TCTE 30 µM.
0.0 20.0 40.0 60.0 80.0 100.0 120.0 3 H 2 O release(% control)
*
*
C 30µM 15µM 1µM0.0 20.0 40.0 60.0 80.0 100.0 120.0 Control TCTE 3 H 2 O release (% control)
Figure 13. Effects of TCTE on tyrosinase activity in a cell free system. Melan-a
melanocytes were seeded into 60 mm2 culture dishes and cultured for 24 hrs. Cells were removed from flasks, and detergent solubilized tyrosinase extracts were prepared and assayed for tyrosinase activity at 30 µM as described in Materials and Methods.