저작자표시-비영리-변경금지 2.0 대한민국 이용자는 아래의 조건을 따르는 경우에 한하여 자유롭게 l 이 저작물을 복제, 배포, 전송, 전시, 공연 및 방송할 수 있습니다. 다음과 같은 조건을 따라야 합니다: l 귀하는, 이 저작물의 재이용이나 배포의 경우, 이 저작물에 적용된 이용허락조건 을 명확하게 나타내어야 합니다. l 저작권자로부터 별도의 허가를 받으면 이러한 조건들은 적용되지 않습니다. 저작권법에 따른 이용자의 권리는 위의 내용에 의하여 영향을 받지 않습니다. 이것은 이용허락규약(Legal Code)을 이해하기 쉽게 요약한 것입니다. Disclaimer 저작자표시. 귀하는 원저작자를 표시하여야 합니다. 비영리. 귀하는 이 저작물을 영리 목적으로 이용할 수 없습니다. 변경금지. 귀하는 이 저작물을 개작, 변형 또는 가공할 수 없습니다.
Evaluation of Ocular Pulse Amplitude-related
Parameters measured by Dynamic Contour
Tonometry and Ocular Blood Flow Analyzer
by
Eoi Jong Seo
Major in Medicine
Department of Medicine
Evaluation of Ocular Pulse Amplitude-related
Parameters measured by Dynamic Contour
Tonometry and Ocular Blood Flow Analyzer
by
Eoi Jong Seo
A Dissertation Submitted to The Graduate School of
Ajou University in Partial Fulfillment of the Requirements
for the Degree of
Master of Medicine
Supervised by
Jae Hong Ahn, M.D.
Major in Medicine
Department of Medicine
The Graduate School, Ajou University
February, 2016
This certifies that the dissertation
of Eoi Jong Seo is approved.
SUPERVISORY COMMITTEE
Jae Hong Ahn
Koung Hoon Kook
Jae Ho Cho
The Graduate School, Ajou University
December, 18th, 2015
- ABSTRACT -
Evaluation of Ocular Pulse Amplitude-related Parameters measured
by Dynamic Contour Tonometry and Ocular Blood Flow Analyzer
We performed this study to evaluate ocular rigidity-related factor (ORF) derived from ocular pulse amplitude (OPA) measurements with regard to the severity of glaucoma.
This study was conducted in 31 eyes of 31 normal and 38 eyes of 38 normal tension glaucoma (NTG) patients with cross-sectional and retrospective design. OPA was measured using dynamic contour tonometry (DCT). Pulse amplitude (PA), pulse volume (PV), and pulsatile ocular blood flow (POBF) were measured using ocular blood flow analyzer (OBFA). Intraocular pressure (IOP) was measured by Goldmann applanation tonometry (GAT), DCT and OBFA. ORF was calculated from OPA and PV, measured with both devices, based on the Friedenwald equation. ORF = [log (DCT IOP + OPA) - log DCT IOP]/PV. The severity of glaucoma was estimated by both mean deviation (MD) of visual field (VF) tests and retinal nerve fiber layer (RNFL) thickness of Stratus optical coherence tomography (OCT) in medically treated NTG patients.
PA, PV and POBF was not significantly different between groups. The calculated ORF of NTG patients did not differ from that of normal subjects. OPA showed significant correlation with IOP measured by both GAT and DCT but PA did not. OPA and POBF correlated
significantly with the spherical equivalent of refractive error but not with central corneal thickness and blood pressure. Both POBF and ORF were significantly correlated with IOP measured by all the three devices. Although OPA and POBF did not correlate with glaucoma severity, ORF showed significant correlation with MD of VF and RNFL thickness measured by OCT in NTG patients.
Although both OPA and POBF significantly correlated with IOP level, they did not correlate with the severity of glaucoma. ORF, derived from measurements of ocular pulse amplitude, could be related to the severity of glaucoma in treated NTG patients.
Key words: Dynamic contour tonometry, Ocular blood flow analyzer, Ocular pulse
TABLE OF CONTENTS
ABSTRACT··· i
TABLE OF CONTENTS ··· iii
LIST OF TABLES ··· iv
LIST OF FIGURES ··· v
Ⅰ. INTRODUCTION ··· 1
Ⅱ. MATERIALS AND METHODS ··· 3
Ⅲ. RESULTS ··· 6
Ⅳ. DISCUSSION ··· 18
Ⅴ. CONCLUSION ··· 22
REFERENCES ··· 23
LIST OF TABLES
Table 1. Descriptive statistics of enrolled subjects··· 7
Table 2. Correlations between IOP or OPA-derived parameters and systemic or other ocular parameters in total patients ··· 10
Table 3. Correlations between OPA-derived parameters and IOP measurements in total patients ··· 12
Table 4. Correlations between IOP or OPA-derived parameters and indices of glaucomatous damages in normal tension glaucoma patients ··· 14
LIST OF FIGURES
Fig. 1. Inter-relationship of OPA and ORF with IOPs and OBFA measured parameters in total patients ···13
Fig. 2. Relationship between ORF and the parameters indicating glaucoma severity which is MD in Humphrey visual field test and RNFL thickness in Cirrus OCT test in NTG subgroup analysis and total patients ···17
I. INTRODUCTION
In addition to intraocular pressure (IOP) (Collaborative Normal-Tension Glaucoma Study Group, 1998), hemodynamic disturbances are thought to be related to the pathogenesis of glaucomatous optic neuropathy in NTG patients (Fontana et al, 1998; Stalmans et al, 2008; Schulzer et al, 1990). Pulsatile ocular blood flow (POBF), measured using a pneumatic applanation tonometer, has been reported to be related to the pathogenesis of glaucoma (Fontana et al, 1998; Kerr et al, 1998; Kerr et atl, 2003) and is derived from measurements of cyclic changes of IOP, called ocula r pulse amplitude (OPA). OPA is thought to be generated by systemic blood pressure differences during the cardiac cycle, but its correlation with systemic hemodynamic parameters has been reported to be negligible (Grieshaber et al, 2009; Choi et al, 2012) because it can be affected by many other factors, including IOP(Kaufmann et al, 2006), vascular resistance (Stalmans et al, 2009), choroidal thickness(De Moraes et al. 2009), autoregulation (Aykan et al, 2010), and ocular rigidity (Dastiridou et al, 2009). These confounding factors generating OPA have been suggested to be related to the pathogenesis of glaucoma. Additionally, ocular rigidity has been considered to be one of the important factors related to the individual susceptibility of the optic nerve head to glaucomatous damage(Agrawal et al, 1991; Ebneter et al, 2009) and is determined by the pressure/volume relationship within the eyeball (Friedenwald, 1937). Non-invasive methods for ocular rigidity measurements have been reported using devices that can measure ocular pulsatile components (Hommer et al, 2008; Wang et al, 2013). However, ocular rigidity measured by these methods has shown contradictory results in relation to glaucoma,
and estimated rigidity coefficients differed from those measured by invasive methods during cataract surgery (Pallikaris et al, 2005).
In this study, we compared ocular pulse amplitude measured by both DCT and ocular blood flow analyzer (OBFA) in terms of their relationship with other ocular and systemic parameters. Additionally, the ocular rigidity-related factor (ORF) was calculated from both DCT and OBFA measurements, based on previous studies that adopted non-invasive methods (Hommer et al, 2008; Wang et al, 2013). Then, we evaluated ocular pulsatile components and ORF in relation to glaucoma severity in normal tension glaucoma (NTG) patients.
II.
MATERIALS AND METHODS
This study was of a cross-sectional and retrospective design. The medical records of subjects who visited the glaucoma clinic at the Department of Ophthalmology of Ajou University Hospital from August 2012 to October 2012 were reviewed. Initially, there were 146 eyes of 79 patients who had Pascal Dynamic Contour Tonometry (DCT, Swiss Microtechnology AG, Switzerland) and ocular Blood-Flow Analyzer (Paradigm Medical, USA) measurements and measurements of blood pressure within 30 min. The present study conformed to the Declaration of Helsinki and was approved by the Institutional Review Board of Ajou University Hospital. Comprehensive ophthalmic examinations including medical history, visual acuity, spherical equivalent (SE) of refractive error, slit lamp biomicroscopy, and fundus examinations were performed. Central corneal thickness (CCT) was measured using ultrasonic pachymetry (DGH-500; DGH Technology, USA) and IOP was measured using Goldman applanation tonometry (GAT). IOP and OPA were measured using DCT. Average IOP, PA, PV, and POBF were measured using OBFA. VF tests (Humphrey Field Analyzer; Carl Zeiss Meditec, USA), red-free RNFL photography (AFC-210; NIDEK, Japan), and optical coherence tomography (OCT; Cirrus HD-OCT; Carl Zeiss Meditec) were carried out within 3 months before or after OPA and PA measurements in all subjects.
Patients were defined as normal when they had IOP less than 22 mmHg with GAT, normal VF test results, no sign of RNFL defect or optic disc findings corresponding to glaucoma on stereoscopic red-free RNFL photography. NTG patients who had a
gonioscopically open angle, showed at least two reproducible VF test results compatible with glaucoma, based on the Anderson criteria (Budenz, 1997), and RNFL defects corresponding to VF defects noted on OCT and/or red-free RNFL photography, were included. IOP measurements in all NTG patients were less than 22 mmHg at each visit before and after treatment.
Systolic BP (SBP) and diastolic BP (DBP) were measured using a brachial full-auto sphygmomanometer on the upper right arm after the subject had been seated for at least 3 min. Patients were asked to refrain from any physical activities that could affect BP. BP was taken twice and the lower value was used for the analysis. Mean arterial pressure (MAP) was estimated from the equation, MAP = [2 DBP + SBP]/3 (Razminia et al, 2004). Mean ocular perfusion pressure (MOPP) was calculated from the equation, MOPP = 2/3[DBP +1/3(SBP-DBP)] – GAT IOP (Sehi et al, 2005). ORF was calculated based on the Friedenwald equation (Friedenwald, 1937) with modification:
ORF = (log IOP1 - log IOP2)/(V1- V2)
where IOP2 is DCT IOP, IOP1 is DCT IOP plus OPA measured by DCT, and V1-V2 is PV measured by OBFA. OBFA estimates PV from pressure change in the eyeball assuming individual patients have a standard ocular rigidity coefficient (Silver et al, 1994), so the ocular rigidity estimated in our study may not represent the actual value. Thus, we called our estimated coefficient of ocular rigidity the “ocular rigidity-related factor.”
manufacturers. DCT measurements were always followed by OBFA measurement and each measurement had at least 5 minute of time interval to minimize interference. DCT measurements for which the quality score (Q) was > 3 and OBFA measurements that were documented as incomplete or results in tests with high variance comments were excluded. Unreliable visual field (VF) tests (> 25% fixation loss, false negatives, and false positives) were excluded from our analysis. OCT images showing poor centration and signal strength < 7 were also excluded. Patients who had previous intraocular surgery, refractive surgery, and laser surgery involving argon laser peripheral iridotomy were also excluded.
Statistical analyses for descriptive statistics, differences between the two devices, and correlations between parameters were conducted using the SPSS software (ver. 20.0; SPSS Inc., Chicago, IL, USA). One eye was selected at random using random number generators from a uniform distribution in SPSS software if both eyes of a patient met the inclusion criteria.
III.
RESULT
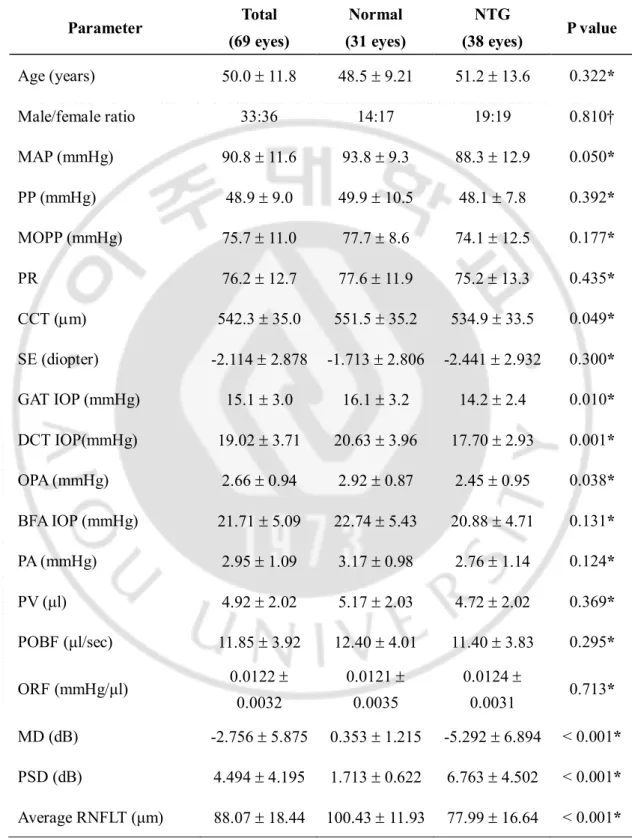
Among total 79 patients, 10 patients were excluded from final analysis. 8 patients excluded due to unreliable OBFA result and 2 patients showed unreliable DCT result. Ultimately, 69 eyes in 69 patients were included in the analysis. Of them, 31 eyes of 31 patients and 38 eyes of 38 patients were divided into the normal and NTG groups, respectively. IOP measurements by the three devices were lower in the NTG group than in normal patients (p < 0.05), likely because all NTG patients were using topical IOP-lowering medications (average number of meds = 1.7 ± 1.1). OPA was also lower in the NTG group. There were no significant differences in the ocular pulsatile component measurements by OBFA (PA, PV, and POBF) or ORF between normal and NTG groups (Table 1).
Table 1. Descriptive statistics of enrolled subjects. Parameter Total (69 eyes) Normal (31 eyes) NTG (38 eyes) P value Age (years) 50.0 ± 11.8 48.5 ± 9.21 51.2 ± 13.6 0.322* Male/female ratio 33:36 14:17 19:19 0.810† MAP (mmHg) 90.8 ± 11.6 93.8 ± 9.3 88.3 ± 12.9 0.050* PP (mmHg) 48.9 ± 9.0 49.9 ± 10.5 48.1 ± 7.8 0.392* MOPP (mmHg) 75.7 ± 11.0 77.7 ± 8.6 74.1 ± 12.5 0.177* PR 76.2 ± 12.7 77.6 ± 11.9 75.2 ± 13.3 0.435* CCT (mm) 542.3 ± 35.0 551.5 ± 35.2 534.9 ± 33.5 0.049* SE (diopter) -2.114 ± 2.878 -1.713 ± 2.806 -2.441 ± 2.932 0.300* GAT IOP (mmHg) 15.1 ± 3.0 16.1 ± 3.2 14.2 ± 2.4 0.010* DCT IOP(mmHg) 19.02 ± 3.71 20.63 ± 3.96 17.70 ± 2.93 0.001* OPA (mmHg) 2.66 ± 0.94 2.92 ± 0.87 2.45 ± 0.95 0.038* BFA IOP (mmHg) 21.71 ± 5.09 22.74 ± 5.43 20.88 ± 4.71 0.131* PA (mmHg) 2.95 ± 1.09 3.17 ± 0.98 2.76 ± 1.14 0.124* PV (μl) 4.92 ± 2.02 5.17 ± 2.03 4.72 ± 2.02 0.369* POBF (μl/sec) 11.85 ± 3.92 12.40 ± 4.01 11.40 ± 3.83 0.295* ORF (mmHg/μl) 0.0122 ± 0.0032 0.0121 ± 0.0035 0.0124 ± 0.0031 0.713* MD (dB) -2.756 ± 5.875 0.353 ± 1.215 -5.292 ± 6.894 < 0.001* PSD (dB) 4.494 ± 4.195 1.713 ± 0.622 6.763 ± 4.502 < 0.001* Average RNFLT (μm) 88.07 ± 18.44 100.43 ± 11.93 77.99 ± 16.64 < 0.001*
*, T-test; †, Fisher’s exact test Values are presented in mean ± SD.
BFA, blood flow analyzer; CCT, central corneal thickness; DCT, dynamic contour tonometry; GAT, Goldmann applanation tonometry; IOP, intra ocular pressure; MAP, mean arterial pressure; MD, mean deviation; MOPP, mean ocular perfusion pressure; NTG, normal tension glaucoma; OPA, ocular pulse amplitude; ORF, Ocular rigidity-related factor; PA, pulse amplitude measured by BFA; POBF, pulsatile ocular blood flow measured by BFA; PP, pulse pressure; PR, pulse rate; PSD, pattern standard deviation; PV, pulse volume measured by BFA; RNFLT, retinal nerve fiber layer thickness; SD, standard deviation; SE, spherical equivalent.
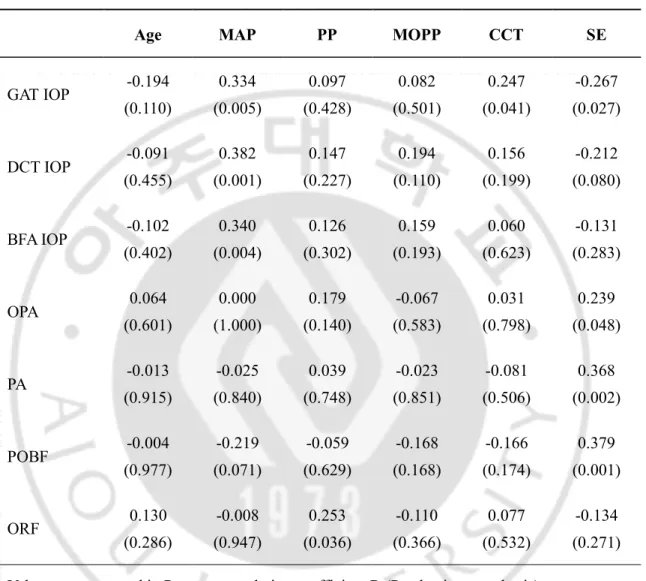
As shown in Table 2, all IOPs measured by each device were positively correlated with MAP, but PP and MOPP were not correlated with IOPs measured by all devices. OPA, PA and POBF were not correlated with MAP, PP, and MOPP whereas ORF significantly correlated with PP. CCT correlated positively with GAT IOP (r = 0.247, p = 0.041) but not with DCT IOP (r = 0.156, p = 0.199) and with OBFA IOP (r = 0.060, p = 0.623). CCT did not correlate significantly with OPA, PA, POBF, or ORF. SE of refractive error was significantly correlated with OPA, PA and POBF but not with ORF (Table 2).
Table 2. Correlations between IOP or OPA-derived parameters and systemic or other ocular parameters in total patients.
Age MAP PP MOPP CCT SE
GAT IOP -0.194 (0.110) 0.334 (0.005) 0.097 (0.428) 0.082 (0.501) 0.247 (0.041) -0.267 (0.027) DCT IOP -0.091 (0.455) 0.382 (0.001) 0.147 (0.227) 0.194 (0.110) 0.156 (0.199) -0.212 (0.080) BFA IOP -0.102 (0.402) 0.340 (0.004) 0.126 (0.302) 0.159 (0.193) 0.060 (0.623) -0.131 (0.283) OPA 0.064 (0.601) 0.000 (1.000) 0.179 (0.140) -0.067 (0.583) 0.031 (0.798) 0.239 (0.048) PA -0.013 (0.915) -0.025 (0.840) 0.039 (0.748) -0.023 (0.851) -0.081 (0.506) 0.368 (0.002) POBF -0.004 (0.977) -0.219 (0.071) -0.059 (0.629) -0.168 (0.168) -0.166 (0.174) 0.379 (0.001) ORF 0.130 (0.286) -0.008 (0.947) 0.253 (0.036) -0.110 (0.366) 0.077 (0.532) -0.134 (0.271) Values are presented in Pearson correlation coefficient R (P value in parenthesis).
BFA, blood flow analyser; CCT, central corneal thickness; DCT, dynamic contour tonometry; GAT, Goldmann applanation tonometry; IOP, intraocular pressure; MAP, mean arterial pressure; MOPP, mean ocular perfusion pressure; OPA, ocular pulse amplitude measured by DCT; ORF, ocular rigidity-related factor; PA, pulse amplitude measured by BFA; POBF, pulsatile ocular blood flow measured by BFA; PP, pulse pressure; SE, spherical equivalent.
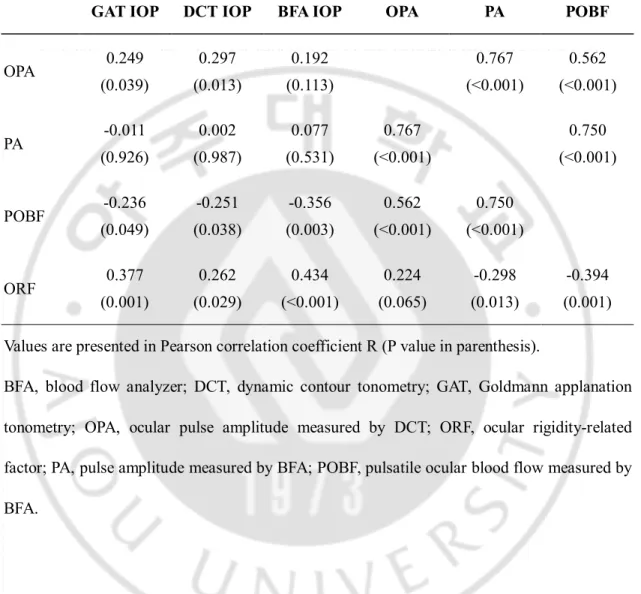
As shown in Table 3, DCT OPA correlated positively with GAT and DCT IOPs, and showed a significant correlation with PA (r = 0.753, p < 0.001) and POBF (r = 0.512, p < 0.001) measured by OBFA. In contrast, OBFA PA was not significantly correlated with any IOP measurements by the three devices. POBF showed a negative correlation with IOPs (r = -0.236 to -0.356, p < 0.05) but a positive correlation with OPA (r = 0.562, p < 0.001) and PA (r = 0.750, p < 0.001). ORF correlated positively with all IOPs (r = 0.262 to 0.434, p < 0.03), but negatively with PA (r = -0.298, p = 0.013) and POBF (r = -0.394, p = 0.001). Those inter-relationship of OPA and ORF with other parameters such as IOPs and OBFA measured factors are diagrammatically described in Fig. 1.
Table 3. Correlations between OPA-derived parameters and IOP measurements in total patients.
GAT IOP DCT IOP BFA IOP OPA PA POBF
OPA 0.249 (0.039) 0.297 (0.013) 0.192 (0.113) 0.767 (<0.001) 0.562 (<0.001) PA -0.011 (0.926) 0.002 (0.987) 0.077 (0.531) 0.767 (<0.001) 0.750 (<0.001) POBF -0.236 (0.049) -0.251 (0.038) -0.356 (0.003) 0.562 (<0.001) 0.750 (<0.001) ORF 0.377 (0.001) 0.262 (0.029) 0.434 (<0.001) 0.224 (0.065) -0.298 (0.013) -0.394 (0.001) Values are presented in Pearson correlation coefficient R (P value in parenthesis).
BFA, blood flow analyzer; DCT, dynamic contour tonometry; GAT, Goldmann applanation tonometry; OPA, ocular pulse amplitude measured by DCT; ORF, ocular rigidity-related factor; PA, pulse amplitude measured by BFA; POBF, pulsatile ocular blood flow measured by BFA.
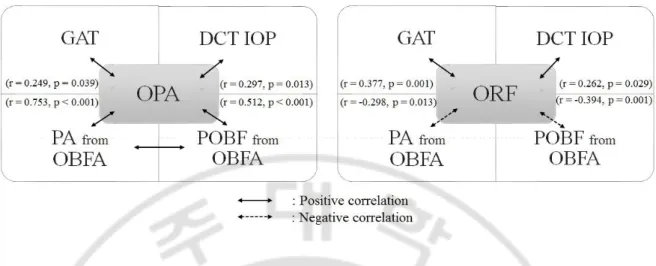
Fig. 1. Inter-relationship of OPA and ORF with IOPs and OBFA measured parameters in total patients. OPA showed statistically significantly positive relationship (straight line) with GAT, DCT IOP, PA, and POBF. PA and POBF showed positive correlation, too (left). ORF showed significantly positive correlation with GAT and DCT IOP but negative correlation (dashed line) with PA and POBF (right). Pearson correlation coefficient R and P values were described in parenthesis. DCT, dynamic contour tonometry; GAT, Goldmann applanation tonometry; IOP, intraocular pressure; OBFA, ocular blood flow analyzer; OPA, ocular pulse amplitude measured by DCT; ORF, ocular rigidity-related factor; PA, pulse amplitude measured by OBFA; POBF, pulsatile ocular blood flow measured by OBFA.
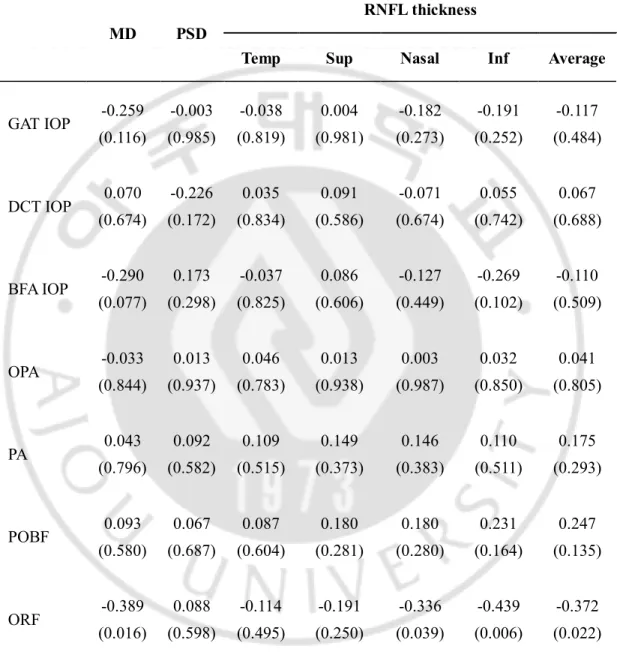
In a subgroup analysis in the NTG group, OPA, PA and POBF did not show any significant correlation with MD, PSD, or RNFL thickness parameters. ORF was correlated significantly with nasal (r = -0.336, p = 0.039), inferior (r = -0.439, p = 0.006), and average (r = -0.372, p = 0.022) RNFL thickness. ORF showed a significant correlation with the MD determined by VF tests (r = -0.389, p = 0.016), but POBF did not (Table 4). Although correlation between ORF and RNFL thickness could not be evaluated in total patients because most of normal subjects did not take OCT exam, ORF was significantly correlated with MD by VF tests (r = -0.246, p = 0.042) in total patients. Diagrammatical relationship between ORF and the parameters indicating glaucoma severity is described in Fig. 2.
Table 4. Correlations between IOP or OPA-derived parameters and indices of glaucomatous damages in normal tension glaucoma patients.
MD PSD
RNFL thickness
Temp Sup Nasal Inf Average
GAT IOP -0.259 (0.116) -0.003 (0.985) -0.038 (0.819) 0.004 (0.981) -0.182 (0.273) -0.191 (0.252) -0.117 (0.484) DCT IOP 0.070 (0.674) -0.226 (0.172) 0.035 (0.834) 0.091 (0.586) -0.071 (0.674) 0.055 (0.742) 0.067 (0.688) BFA IOP -0.290 (0.077) 0.173 (0.298) -0.037 (0.825) 0.086 (0.606) -0.127 (0.449) -0.269 (0.102) -0.110 (0.509) OPA -0.033 (0.844) 0.013 (0.937) 0.046 (0.783) 0.013 (0.938) 0.003 (0.987) 0.032 (0.850) 0.041 (0.805) PA 0.043 (0.796) 0.092 (0.582) 0.109 (0.515) 0.149 (0.373) 0.146 (0.383) 0.110 (0.511) 0.175 (0.293) POBF 0.093 (0.580) 0.067 (0.687) 0.087 (0.604) 0.180 (0.281) 0.180 (0.280) 0.231 (0.164) 0.247 (0.135) ORF -0.389 (0.016) 0.088 (0.598) -0.114 (0.495) -0.191 (0.250) -0.336 (0.039) -0.439 (0.006) -0.372 (0.022) Values are presented in Pearson correlation coefficient R (P value in parenthesis).
IOP, intraocular pressure; OPA, ocular pulse amplitude; GAT, Goldmann applanation tonometry; DCT, dynamic contour tonometry; BFA, blood flow analyzer; Inf, inferior;
MD, mean deviation; ORF, Ocular rigidity related factor; PA, pulse amplitude measured by BFA; POBF, pulsatile ocular blood flow measured by BFA; PSD, pattern standard deviation; RNFL, retinal nerve fiber layer; Sup, superior.
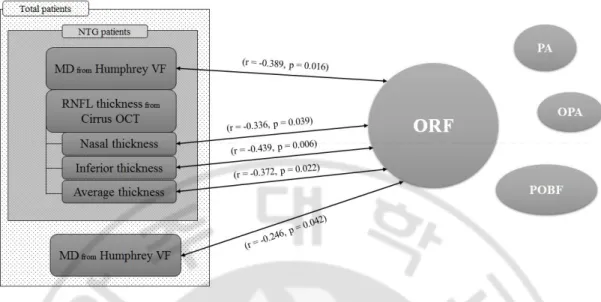
Fig. 2. Relationship between ORF and the parameters indicating glaucoma severity which is MD in Humphrey visual field test and RNFL thickness in Cirrus OCT test in NTG subgroup analysis and total patients. ORF showed significantly negative correlation (straight line) with MD from Humphrey VF and nasal, inferior and average RNFL thickness in cirrus OCT in NTG subgroup analysis. In total patients, ORF showed significantly negative correlation with MD from Humphrey VF. Pearson correlation coefficient R and P values were described in parenthesis. Other parameters such as PA, OPA or POBF did not show any clinically significant relationship. MD, mean deviation; OCT, optical coherence topography; OPA, ocular pulse amplitude measured by dynamic contour tonometry; ORF, ocular rigidity-related factor; PA, pulse amplitude measured by ocular blood flow analyzer; POBF, pulsatile ocular blood flow measured by ocular blood flow analyzer; RNFL, retinal nerve fiber layer; VF, visual field test.
IV.
DISCUSSION
Ocular rigidity was estimated by Jonas Friedenwald in enucleated human eyes using the Schiotz tonometer; the mean coefficient was 0.0215 mmHg/µL (Wang et al, 2013). In a study using the same Schiotz tonometry, glaucoma patients (0.0143) showed lower scleral rigidity than normal subjects (0.0217) (Agrawal et al, 1991). In another report, axial length of the eye was measured by laser interferometry before and after acetazolamide intake in normal and glaucoma patients; the shortening of axial length was significantly smaller in the glaucoma group even though the IOP reduction was similar. This was interpreted as indirect evidence supporting increased ocular rigidity in glaucoma patients (Ebneter et al, 2009). Recently, two groups introduced non-invasive measurements of ocular rigidity using ocular pulsatile components based on Friedenwald’s equation, but reported contradictory results (Hommer et al, 2008; Wang et al, 2013). Hommer et al.(Hommer et al, 2008) measured OPA using an OBF system and fundus pulse amplitude (FPA) by laser interferometry. In the equations, they substituted ΔV for FPA assuming that it was proportional to the change in ocular volume during the cardiac cycle. The calculated OR coefficient of the POAG group (0.0454) was significantly higher than that of normal subjects (0.0427). Wang et al. (Wang et al, 2013) measured OPA by DCT and pulsatile choroidal blood flow (ChBFp) using laser Doppler flowmetry. They replaced ΔV with ChBFp assuming it represented the true change in choroidal volume in the subfoveal area. The equation was ChBFp = (systolic ChBF – diastolic ChBF)/systolic ChBF. The calculated ocular rigidity coefficient of the OAG group (0.188) was significantly lower than that of the OHT (0.235) and normal (0.230) groups. The
calculated ocular rigidity coefficients in both studies had arbitrary units. A recent manometric measurement of ocular rigidity showed that the mean ocular rigidity coefficient of patients undergoing cataract surgery was 0.0126 mmHg/µL (Pallikaris et al, 2005), which was similar to our results (Table 1). In our results, the ORF of treated NTG patients (0.0124 mmHg/µL) was not significantly different from that of normal subjects (0.0121 mmHg/µL; Table 1). The ORF of NTG patients would be expected to be higher than that of normal subjects because higher ORF correlated significantly with more glaucomatous damage, considering the RNFL thickness determined by OCT measurement and MD by VF test in our study (Table 4); however, it was not found to be so. It is possible that IOP-lowering therapy may have influenced the results because ORF correlated significantly with IOP level in our study (Table 3) and previous manometric studies also showed that ocular rigidity increased with increasing IOP(Dastiridou et al, 2009). Ocular rigidity-estimating methods using ocular pulsatile components may have an intrinsic limitation in that they cannot measure specific responses of important regions related to glaucoma pathogenesis: the lamina cribrosa or peripapillary sclera, for example. Recent research adopting a finite element model suggested regional differences in the response to mechanical stress related to glaucoma (Coudriller et al, 2012; Detorakis et al, 2013). Although the characteristics of ocular rigidity coefficients differed according to the estimating method used, they may represent different aspects of the same ocular property that connects the hemodynamic factors with biomechanical ones in the pathogenesis of glaucoma (Detorakis et al, 2013). Glaucomatous damage may be associated with increased ocular rigidity, representing global stiffness of the eyeball, because a higher value indicates greater IOP elevation for a given
change in ocular volume (Ebneter et al, 2009; Hommer et al, 2008). In contrast, a lower rigidity of a specific region, such as the posterior sclera including the foveal area, may be interpreted as weaker scleral support for the optic nerve axons in the lamina cribrosa (Wang et al, 2013).
Generally, lower OPA has been reported to be associated with more severe glaucomatous damage (Stalmans et al, 2008; Vulsteke et al, 2008). However, neither DCT OPA nor OBFA PA showed any significant correlation with parameters representing glaucomatous damage in our study (Table 4). Although POBF in glaucoma patients is lower than in normal subjects (Fontana et al, 1998; Kerr et al, 1998), little information is available regarding a correlation between POBF and structural or functional changes in glaucoma. POBF in treated glaucoma patients was not correlated with VF or OCT parameters in one study (Aydin et al, 2003). In our study, although POBF did not show any significant correlation with parameters representing glaucomatous damage, ORF was correlated significantly with some OCT parameters and VF defect in NTG patients. This suggests that higher ocular rigidity may be associated with greater glaucomatous damage in NTG patients. We derived ORF based on previous reports speculating that OPA and PV might represent change of IOP and ocular volume during measurement respectively. PV was calculated from PA measured by OBF device and PA seemed not to be influenced by IOP in this study (Table 3), so we thought PV might represent ultrashort term change of ocular volume during measurement. This can be a major limitation of our study. We did not measure the axial length of the eyeball and included NTG patients treated with IOP-lowering topical medications because of the retrospective design of this study. This may be a
limitation because OPA and POBF can be influenced by various factors, including axial length (Kaufmann et al, 2006; Dastiridou et al, 2013) and IOP (Kerr et al, 2003; Dastiridou et al, 2009). IOP lowering medications could influence on the comparison of ORF between normal and glaucoma patients. However, a recent investigation of ocular rigidity using manometric method during cataract surgery showed that rigidity coefficient of treated glaucoma patients (0.0220 ± 0.0053 mL-1) was not significantly different from that of normal subjects (0.0222 ± 0.0039 mL-1) (Dastiridou et al, 2013). In addition, decrement of ocular rigidity depending on decreasing IOP after medications might be minimal within narrow range of IOP between 10 to 21 mmHg in our study as shown in a study conducted by Dastiridou et al (Dastiridou et al, 2009). We did not repeat measurements to determine diurnal variations in the parameters investigated. If these parameters had been measured at different times of the day and diurnal curves generated, our results would be more reliable. Finally, the small number of patients in our study may make it difficult to determine correlations between ocular pulsatile components and systemic or other ocular parameters due to the ranges of ocular and systemic variables being insufficient to be stratified for evaluation.
V. CONCLUSION
In conclusion, in treated NTG patients, it seems that increased ocular rigidity may be related to the severity of glaucoma. ORF, introduced in this study, should be further validated in other clinical settings. Moreover, the clinical implications of POBF and ORF in glaucoma pathogenesis should be investigated further in untreated NTG and glaucoma of various types.
REFERENCES
1. Agrawal KK, Sharma DP, Bhargava G, et al. Scleral rigidity in glaucoma, before and during topical antiglaucoma drug therapy. Indian J Ophthalmol 1991;39(3):85-6. 2. Aydin A, Wollstein G, Price LL, et al. Evaluating pulsatile ocular blood flow analysis
in normal and treated glaucomatous eyes. Am J Ophthalmol 2003;136(3):448-53. 3. Aykan U, Erdurmus M, Yilmaz B, et al. Intraocular pressure and ocular pulse amplitude
variations during the Valsalva maneuver. Graefes Arch Clin Exp Ophthalmol 2010;248(8):1183-6.
4. Budenz DL: Atlas of Visual Field. Baltimore. Lippincott-Raven Publishers, pp 143-194. 1997.
5. Choi J, Lee J, Park SB, et al. Factors affecting ocular pulse amplitude in eyes with open angle glaucoma and glaucoma-suspect eyes. Acta Ophthalmol 2012;90(6):552-8. 6. Collaborative Normal-Tension Glaucoma Study Group: The effectiveness of intraocular
pressure reduction in the treatment of normal-tension glaucoma. Am J Ophthalmol 1998;126(4):498-505.
7. Coudrillier B, Tian J, Alexander S, et al. Biomechanics of the human posterior sclera: age- and glaucoma-related changes measured using inflation testing. Invest Ophthalmol Vis Sci 2012;53(4):1714-28.
8. Dastiridou AI, Ginis H, Tsilimbaris MK, et al. Ocular rigidity, ocular pulse amplitude, and pulsatile ocular blood flow: the effect of axial length. Invest Ophthalmol Vis Sci 2013;54(3):2087-92.
9. Dastiridou AI, Ginis HS, De Brouwere D, et al. Ocular rigidity, ocular pulse amplitude, and pulsatile ocular blood flow: the effect of intraocular pressure. Invest Ophthalmol Vis Sci 2009;50(12):5718-22.
10. Dastiridou AI, Tsironi EE, Tsilimbaris MK, et al. Ocular Rigidity, Outflow Facility, Ocular Pulse Amplitude, and Pulsatile Ocular Blood Flow in Open-Angle Glaucoma: A Manometric Study. Invest Ophthalmol Vis Sci. 2013;54(7):4571–4577
11. De Moraes CG, Reis AS, Cavalcante AF, et al. Choroidal expansion during the water drinking test. Graefes Arch Clin Exp Ophthalmol 2009;247(3):385-9.
12. Detorakis ET, Pallikaris IG. Ocular rigidity: biomechanical role, in vivo measurements and clinical significance. Clin Experiment Ophthalmol 2013;41(1):73-81.
13. Ebneter A, Wagels B, Zinkernagel MS. Non-invasive biometric assessment of ocular rigidity in glaucoma patients and controls. Eye (Lond) 2009;23(3):606-11.
14. Fontana L, Poinoosawmy D, Bunce CV, et al. Pulsatile ocular blood flow investigation in asymmetric normal tension glaucoma and normal subjects. Br J Ophthalmol 1998;82(7):731-6.
15. Friedenwald J. Contribution to the theory and practice of tonometry. Am J Ophthalmol 1937;20:985-1024.
16. Grieshaber MC, Katamay R, Gugleta K, et al. Relationship between ocular pulse amplitude and systemic blood pressure measurements. Acta Ophthalmol 2009;87(3):329-34.
17. Hommer A, Fuchsjager-Mayrl G, Resch H, et al. Estimation of ocular rigidity based on measurement of pulse amplitude using pneumotonometry and fundus pulse using laser interferometry in glaucoma. Invest Ophthalmol Vis Sci 2008;49(9):4046-50.
18. Kaufmann C, Bachmann LM, Robert YC, et al. Ocular pulse amplitude in healthy subjects as measured by dynamic contour tonometry. Arch Ophthalmol 2006;124(8):1104-8.
19. Kerr J, Nelson P, O'Brien C. A comparison of ocular blood flow in untreated primary open-angle glaucoma and ocular hypertension. Am J Ophthalmol 1998;126(1):42-51. 20. Kerr J, Nelson P, O'Brien C. Pulsatile ocular blood flow in primary open-angle
glaucoma and ocular hypertension. Am J Ophthalmol 2003;136(6):1106-13.
21. Pallikaris IG, Kymionis GD, Ginis HS, et al. Ocular rigidity in living human eyes. Invest Ophthalmol Vis Sci 2005;46(2):409-14.
22. Razminia M, Trivedi A, Molnar J, et al. Validation of a new formula for mean arterial pressure calculation: the new formula is superior to the standard formula. Catheter Cardiovasc Interv 2004;63(4):419-25.
23. Schulzer M, Drance SM, Carter CJ, et al. Biostatistical evidence for two distinct chronic open angle glaucoma populations. Br J Ophthalmol 1990;74(4):196-200.
24. Sehi M, Flanagan JG, Zeng L, et al. Relative change in diurnal mean ocular perfusion pressure: a risk factor for the diagnosis of primary open-angle glaucoma. Invest Ophthalmol Vis Sci 2005;46(2):561-7.
25. Silver DM, Farrell RA. Validity of pulsatile ocular blood flow measurements. Surv Ophthalmol 1994;38 Suppl:S72-80.
26. Stalmans I, Harris A, Fieuws S, et al. Color Doppler imaging and ocular pulse amplitude in glaucomatous and healthy eyes. Eur J Ophthalmol 2009;19(4):580-7. 27. Stalmans I, Harris A, Vanbellinghen V, et al. Ocular pulse amplitude in normal tension
and primary open angle glaucoma. J Glaucoma 2008;17(5):403-7.
28. Vulsteke C, Stalmans I, Fieuws S, et al. Correlation between ocular pulse amplitude measured by dynamic contour tonometer and visual field defects. Graefes Arch Clin Exp Ophthalmol 2008;246(4):559-65.
29. Wang J, Freeman EE, Descovich D, et al. Estimation of ocular rigidity in glaucoma using ocular pulse amplitude and pulsatile choroidal blood flow. Invest Ophthalmol Vis Sci 2013;54(3):1706-11.
- 국문요약 -
Dynamic contour tonometry와 안혈류 분석계로 측정한 안구
박동 크기 연관 인자들에 대한 분석
아주대학교 대학원 의학과 서 의 종
(지도교수: 안 재 홍)
안구 박동 크기(Ocular pulse amplitude, OPA) 측정으로부터 계산한 안구 경성도 관련 인자를 녹내장의 중증도 측면에서 평가하였다.
정상안압 녹내장 환자군과 정상인의 각각 38명 38안, 31명 31안을 대상으로 후향적 단면연구를 진행하였다. 안구 박동 크기는 dynamic contour tonometry(DCT)로 측정하였으며, 안혈류 측정계를 이용해 박동 크기(pulse amplitude, PA), 박동 부피(pulse volume, PV), 박동성 안혈류(pulsatile ocular blood flow, POBF)를 측정하였다. 안압은 골드만 압평안압계, DCT, 안혈류 측정계를 이용해 계측하였다. 안구경성도 관련 인자는 DCT와 안혈류 측정계에서 계측한 안구 박동 크기와 박동 부피를 이용해 Friedenwald 방정식에 의거해 계산하였다. 안구 경성도 관련인자 = [log (DCT IOP + OPA) - log DCT IOP]/PV. 치료중인 정상안압 녹내장 환자군에서의 녹내장 중증도는 시야검사에서의 평균 편차값과 빛 간섭 단층촬영에서의 망막 신경섬유층 두께로 평가하였다.
녹내장 환자군에서 안압과 안구 박동 크기는 대조군보다 유의하게 낮았다. 정상안압 녹내장 환자군에서 계산된 안구 경성도 관련 인자는 대조군과 유의한 차이가 없었다. 안구 박동 크기는 골드만 압평안압계와 DCT로 측정한 안압과 유의한 연관성을 보였으나, 박동 크기는 그렇지 못했다. 안구 박동 크기와 박동성 안혈류는 굴절 오류의 구면 대응치와 유의한 상관관계를 보였지만, 중심각막 두께와 혈압은 그렇지 못했다. 박동성 안혈류와 안구 경성도 관련 인자는 세 가지의 기계로 측정한 안압과 모두 연관성을 보였다. 안구 박동 크기와 박동성 안혈류가 녹내장 중증도과 유의한 관계를 보이지 못하였음에도 불구하고, 안구 경성도 관련 인자는 정상안압 녹내장 환자군에서 시야검사에서의 평균 편차와 빛 간섭 단층촬영에서의 망막 신경섬유층 두께와 유의한 연관관계를 나타냈다. 안구 박동 크기와 박동성 안혈류가 안압수치와 유의성을 보였음에도 불구하고, 녹내장 중증도와 유의한 관계를 나타내지는 못했다. 그러나 안구 박동 크기 측정으로부터 계산한 안구 경성도 관련 인자의 경우, 치료중인 정상안압 녹내장 환자에서 녹내장 중증도와 연관될 수 있는 지표가 될 수 있다.