저작자표시-비영리-동일조건변경허락 2.0 대한민국 이용자는 아래의 조건을 따르는 경우에 한하여 자유롭게 l 이 저작물을 복제, 배포, 전송, 전시, 공연 및 방송할 수 있습니다. l 이차적 저작물을 작성할 수 있습니다. 다음과 같은 조건을 따라야 합니다: l 귀하는, 이 저작물의 재이용이나 배포의 경우, 이 저작물에 적용된 이용허락조건 을 명확하게 나타내어야 합니다. l 저작권자로부터 별도의 허가를 받으면 이러한 조건들은 적용되지 않습니다. 저작권법에 따른 이용자의 권리는 위의 내용에 의하여 영향을 받지 않습니다. 이것은 이용허락규약(Legal Code)을 이해하기 쉽게 요약한 것입니다. Disclaimer 저작자표시. 귀하는 원저작자를 표시하여야 합니다. 비영리. 귀하는 이 저작물을 영리 목적으로 이용할 수 없습니다. 동일조건변경허락. 귀하가 이 저작물을 개작, 변형 또는 가공했을 경우 에는, 이 저작물과 동일한 이용허락조건하에서만 배포할 수 있습니다.
Assessment of coronary artery plaque
progression using 64 slice multi-detector
computed tomography (MDCT)
by
Eun Young Kim
Major in Medicine
Department of Medical Sciences
The Graduate School, Ajou University
Assessment of coronary artery plaque
progression using 64 slice multi-detector
computed tomography (MDCT)
by
Eun Young Kim
A Dissertation Submitted to The Graduate School of
Ajou University in Partial Fulfillment of the Requirements
for the Degree of Master of Medicine
Supervised by
Doo Kyoung Kang, M.D.
Major in Medicine
Department of Medical Sciences
The Graduate School, Ajou University
This certifies that the dissertation
of Eun Young Kim is approved.
SUPREVISORY COMMITTEE
Doo Kyoung Kang
Joo Sung Sun
So Yeon Choi
The Graduate School, Ajou University
December 14rd, 2012
i - ABSTRACT-
Assessment of coronary artery plaque progression using 64 slice
multi-detector computed tomography (MDCT)
Background: Coronary artery disease (CAD) is one of the leading cause of death. So the
effective method for early detection of subclinical CAD and the prevention of developing acute coronary syndrome were emphasized for many years. Coronary MDCT is non-invasive technique, and enable to detect of non-calcified atherosclerotic plaque and assess the plaque composition. Also coronary MDCT is an effective tool for assessment of serial change in plaque volume and then it would be used as a surrogate endpoint in clinical trials testing the efficacy of anti-atherosclerotic therapy.
Objectives: To evaluated the progression of atherosclerotic plaque during follow-up interval and its association with cardiovascular risk profile.
Materials and Methods: Fifty-six patients who had plaque detected on repeated 64-slice
multi-detector computed tomography (MDCT) with a mean interval of 25 ± 10 months were enrolled in this retrospective study. Calcified plaque volume was measured using non-contrast calcium scoring CT. Non-calcified plaque volume was measured using non- contrast-enhanced coronary CT angiography (CTA) and a commercially available plaque analysis tool. Changes in calcified and non-calcified plaque volumes and cardiovascular risk factors were assessed over time using the Wilcoxon signed-rank test. Absolute and relative changes in plaque volume were also compared using the Mann–Whitney test, and the association between rapid plaque progression and cardiovascular risk factors was determined using
ii logistic regression analysis.
Result : Diameter of the stenosis, length and calcified and non-calcified plaque volumes of
the lesions (p < 0.001) increased significantly on follow-up CT. Absolute and relative annual changes in plaque volumes were significantly greater (p < 0.001) in non-calcified plaque (median, 22.7 mm3 and 90.4%) than in calcified plaque (median, 0.7 mm3 and 0%).
Cardiovascular risk factors were significant predictors of progression of non-calcified plaque. In particular, obesity (BMI > 25 kg/m2), smoking history, and high-density lipoprotein
(HDL) level were independent predictors of both rapid absolute (odds ratios [ORs], 2.41, 4.39, and 0.94, respectively) and relative (OR, 6.82, 5.48, and 0.87, respectively) annual changes in non-calcified plaque volume in a multivariate analysis. However, the progression of calcified plaque was not associated with any cardiovascular risk factors.
Conclusion: Coronary plaque volume increased significantly on follow-up CT, but the rate
of progression was greater for non-calcified plaque than for calcified plaque. Additionally, cardiovascular risk factors were independently associated with the rapid progression of non-calcified plaque volume as assessed by MDCT but not associated with the progression of calcified plaque.
Keywords: Coronary CT angiography, coronary artery calcium, atherosclerotic plaque,
iii
TABLE OF CONTENTS
ABSTARCT ··· i
TABLE OF CONTENTS ··· iii
LIST OF FIGURES ··· iv
LIST OF TABLES ··· v
I. INTRODUCTION ··· 1
II. MATERIALS AND METHODS ··· 3
A. PATIENT ··· 3 B. CLINICAL COVARIATES ··· 3 C. CARDIAC MDCT ACQUISITION ··· 4 D. CARDIAC MDCT ANALYSIS ··· 5 E. STATISTICAL ANALYSIS ··· 6 III. RESULTS ··· 8 III. DISCUSSION ··· 19 III. CONCLUSION ··· 23 REFERENCES ··· 24 국문요약 ··· 29
iv
LIST OF FIGURES
Fig. 1. Plaque lesion progression in the left mid ascending coronary artery at baseline and 20 month follow up in an 43 year-old male patient. ··· 17
v
LIST OF TABLES
Table 1. Clinical Characteristics of Subject ··· 9
Table 2. Change of Cadiovascular Risk Profiles on Baseline and Follow Up ··· 10
Table 3. Change In Coronary Artery Lesion at Baseline and Follow Up ··· 13
Table 4. Predictors of Rapid Plaque Progression, Univariate Analysis ··· 15
Table 5. Predictors of Rapid Plaque Progression in Multiple Logistic Regression Analysis ··· 16
1
I. INTRODUCTION
Coronary heart disease (CHD) is a leading cause of death. Therefore, the effective method for early detection of subclinical CHD and monitoring of coronary atherosclerotic plaque has been emphasized(Clouse, 2006; Ardehali et al., 2007). Traditionally, coronary angiography is considered the gold standard method to measure the extent of the atherosclerotic plaque (de Feyter et al., 1991). However, this method only depicts the luminal image and is limited to determine plaque composition and to explain the broad spectrum of compensatory coronary arterial remodeling. So currently, the techniques that provide arterial wall imaging by intracoronary cross-sectional visualization, such as intravascular ultrasound (IVUS) and multi-detector CT (MDCT) are preferred for studying atherosclerotic CHD. Serial assessment of coronary atherosclerotic plaque has contributed to the understanding of the natural history and pathophysiology of CHD (Hoffmann et al., 2006). However, IVUS is invasive and therefore not suitable for monitoring progression/regression of coronary plaque (Mintz and Maehara, 2009; Papadopoulou et al., 2011). However, coronary CT angiography (CTA) is a non-invasive technique and additionally enables detection of non-calcified plaque compared with non-contrast CT, which detects only calcification (Cordeiro and Lima, 2006; Leber et al., 2006; Motoyama et al., 2009). Therefore, non-invasive repeated CTA could play a surrogate role in assessing the changes in coronary atherosclerotic plaque burden. Furthermore, defining the relationship between cardiovascular risk factors and changes in plaque burden by serial CTA would facilitate risk modification in patients with coronary plaque detected by MDCT. Thus, the purpose of our study was to assess the serial changes in
2
coronary plaque volume and stenosis severity during follow-up and to assess its association with cardiovascular risk factors.
3
II. MATERIALS AND METHODS
A. Patient
By reviewing the contrast-enhanced coronary CTA dataset between April 2007 and March 2011, we retrospectively identified 168 patients who underwent MDCT examinations more than twice. With the exception of patients who underwent percutaneous coronary angioplasty (n = 11) and coronary artery bypass graft (n = 5), the MDCT data of the remaining 152 patients were reviewed. Finally, 56 patients who had plaque detected on CT were enrolled in this retrospective study. This study was approved by the institutional review board of our institute, which waived the need for informed consent due to its retrospective nature.
B. Clinical Covariates
The pretest probability of CHD in patients based on presenting age, sex, and symptoms was estimated (Gibbons et al., 2003). Cardiovascular risk factors were obtained by reviewing medical charts at the time of baseline and follow-up MDCT examinations for all study participants. Body mass index (BMI) was calculated from measured weight and height, and obesity was defined as BMI > 25 kg/m2. Hypertension was defined by a systolic blood
pressure of ≥ 140 mm Hg or diastolic pressure of ≥ 90 mm Hg or current antihypertensive treatment. Smoking was defined by current or previous daily cigarette use. Diabetes mellitus (DM) was defined as a confirmed diagnosis or use of any anti-diabetic medication at entry into the study. Hypercholesterolemia was defined by a total cholesterol ≥ 200 mg/dl or treatment with lipid-lowering medications, which were defined as ongoing statin treatment at
4
entry into the study. A family history of CHD was defined as previous symptomatic CHD treated with medication or coronary revascularization therapy in a first-degree relative (<55 years of age for males and <65 years of age for females). Finally, 10-year CHD risk based on the Framingham risk score and modified National Cholesterol Education Program (NCEP) risk category were calculated for each patient(Expert Panel on Detection and Treatment of High Blood Cholesterol in, 2001; Grundy et al., 2004).
C. Cardiac MDCT Acquisition
Baseline and follow-up MDCT data were acquired using a Brilliance 64-slice CT (Philips Medical Systems, Eindhoven, The Netherlands). Non-enhanced imaging to calculate calcium score and volume was performed using 120 kV and 55 mAs with prospective gating. Contrast medium (Lomeron 400, Bracco, Milan, Italy) was injected intravenously at a rate of 4.5 mL/sec for all CTA examinations, followed by a 40 mL saline flush at 4 mL/sec. Scanning was initiated automatically 6 sec after a threshold of 150 Hounsfield units (HU) was achieved in the region of interest in the descending aorta. CTA was performed with a detector collimation of 64 × 0.625 mm, a 400 msec gantry rotation, a pitch of 0.2, an effective tube current of 600–900 mAs with ECG modulation, and a tube voltage of 120 kV. If the patient had a rapid heart beat (≥70 bpm), but no contraindications, they received an oral beta-blocker (50–100 mg metoprolol) 1 h before the examination. Additionally, sublingual nitroglycerin (0.4 mg) was administered 1 min before image acquisition to dilate the coronary arteries, assuming no contraindications. Reconstructions were performed
5
routinely at the 75% phase of the R-R interval period. If we could not reconstruct an adequate image for analysis, additional cardiac cycles were explored
D. Cardiac MDCT Analysis
MDCT data were transferred to a workstation (Extended Brilliance workspace; Philips Medical Systems) for post-processing. Oblique multi-planar reformations (MPRs), maximum intensity projection, curved MPRs along the axis of each vessel, two-dimensional map images, and the volume-rendered technique were reconstructed on the dedicated workstation. Semi-automated software identified and defined at least three contiguous pixels (area, 1.03 mm2) with a density of > 130 HU as calcified plaque to calculate the Agatston
calcium scores and calcified plaque volume. Datasets were transferred to an image processing work station (Aquarius, TeraRecon, San Mateo, CA, USA) to evaluate non-calcified plaque volume on both the baseline and follow-up CTA. After the lesion was identified by two observers by consensus, the analysis was performed by an experienced observer (E.Y. Kim) blinded to patient name and the study date. In the first step, stenosis diameter was measured using the ratio of the average diameter between the site of maximal luminal narrowing and reference sites. The reference sites were defined as segments without detectable plaque, proximal and distal to and as close as possible to the respective coronary lesion. In cases in which it was difficult to set both proximal and distal references, the better side of the segment was used as the reference site. In the second step, lesion length was measured from the proximal to the distal shoulder of the plaque. Finally, in the third step, the plaque was characterized by color coding based on the CT value (HU). Referring to
6
published studies (Schroeder et al., 2004; Bauer et al., 2009; Soeda et al., 2011), the software color codes of the non-calcified coronary plaque were classified into low attenuation plaque (0–50HU), considering lipid-rich plaque, intermediate attenuation plaque (51–120 HU), considering fibrous plaque, and then the volume of each component was measured. The color coding area was manually adjusted to include the full thickness of the vessel wall and to exclude surrounding tissue, such as myocardium, atrium, and coronary veins. In addition, the contrast-enhanced coronary artery lumen CT values of the lesion segments at the baseline and follow-up CTA were recorded. Non-evaluable segments due to motion artifacts were excluded from analysis. A re-analysis was performed 3 months after the original analysis to assess intra-observer agreement.
E. Statistical Analysis
The Microsoft Excel 2007 (Microsoft Corp., Redmond, WA, USA) software package was used for data collection. Continuous measures are presented as means ± standard deviation or medians with 95% confidence interval (CI). Comparison between baseline and follow-up was performed using the paired t-test for continuous variables and the chi-square test for categorical data. Non-normally distributed continuous variables were compared by the Wilcoxon signed-rank test or Mann–Whitney test. Intra-observer agreement for each measurement was estimated using the intra-class correlation coefficient (ICC). The absolute annual changes in stenosis diameter, lesion length, and plaque volume were assessed by subtracting the values measured at the baseline CT from those measured at the follow-up CT for each plaque and dividing the difference by the elapsed time between the two
7
measurements. Relative (percentage) annual change was obtained by dividing the absolute annual change by the amount at the baseline scan. At that time, the cases without detectable plaque on both baseline and follow-up CT were considered no change (0%), whereas cases without visible plaque on only baseline CT were excluded from the annual relative change data. Logistic regression analysis was used to determine whether baseline clinical and laboratory variables were predictive of rapid plaque progression. Variables that achieved significance in a univariate analysis were then selected for testing in a stepwise multiple logistic regression analysis. For dichotomous dependent variables, median annual change values for each plaque volume were selected as a cut-off for rapid plaque progression. MedCalc (version 12.2.1; MedCalc Software, Mariakerke, Belgium) was used for all statistical analyses. A p value < 0.05 was considered to indicate statistical significance.
8
III. RESULTS
A. Clinical characteristics and change in cardiovascular risk profile over time
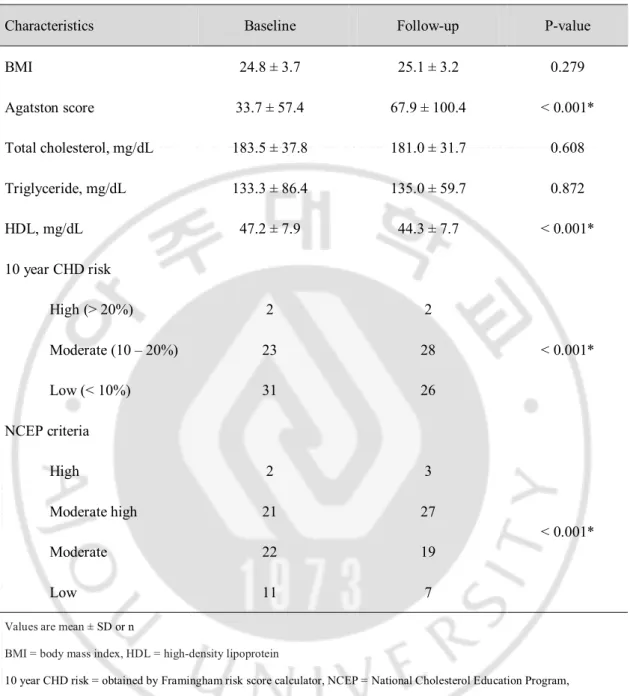
Of the 56 patients included, 44 were male and 12 were female. Mean age was 55 ± 9 years. The clinical characteristics of the 56 patients at baseline are summarized in Table 1. The follow-up CT with cardiovascular risk profile reacquisition was undertaken a mean of 25 ± 10 months after the baseline examination. During the follow-up period, only 12 patients were treated with a statin; the remaining patients were managed by cardiovascular risk factor control. The changes in cardiovascular risk profiles between baseline and follow-up are listed in Table 2. The Agatston calcium score increased significantly and high-density lipoprotein (HDL) and low-density lipoprotein levels decreased significantly at follow-up. Additionally, Framingham 10 year CHD risk and NCEP risk category were significantly upgraded at the follow-up. However, no significant differences were observed for BMI or total cholesterol and triglyceride levels.
9
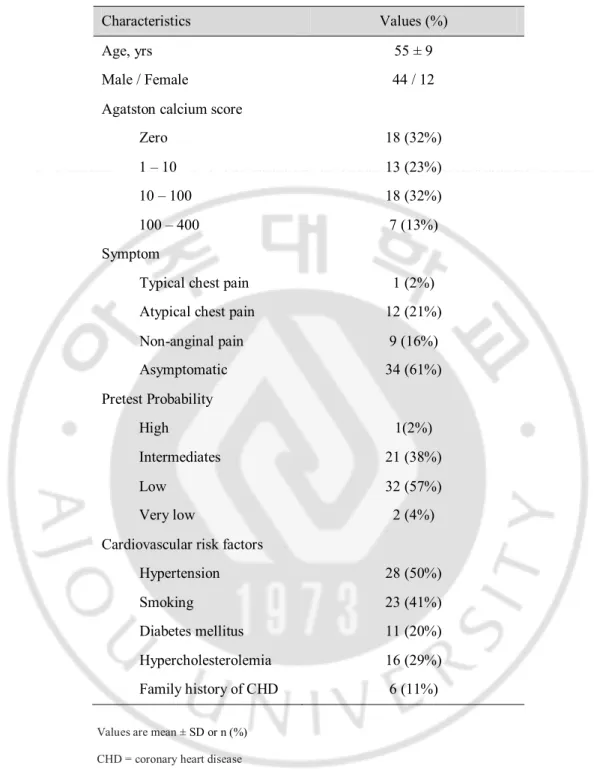
Table 1. Clinical Characteristics of Subjects (N=56)
Values are mean ± SD or n (%)
CHD = coronary heart disease
*Statistically significant
Characteristics Values (%)
Age, yrs 55 ± 9
Male / Female 44 / 12 Agatston calcium score
Zero 18 (32%) 1 – 10 13 (23%) 10 – 100 18 (32%) 100 – 400 7 (13%) Symptom
Typical chest pain 1 (2%) Atypical chest pain 12 (21%) Non-anginal pain 9 (16%) Asymptomatic 34 (61%) Pretest Probability High 1(2%) Intermediates 21 (38%) Low 32 (57%) Very low 2 (4%) Cardiovascular risk factors
Hypertension 28 (50%) Smoking 23 (41%) Diabetes mellitus 11 (20%) Hypercholesterolemia 16 (29%) Family history of CHD 6 (11%)
10
Table 2. Change of Cardiovascular Risk Profiles on Baseline and Follow Up
Characteristics Baseline Follow-up P-value BMI 24.8 ± 3.7 25.1 ± 3.2 0.279 Agatston score 33.7 ± 57.4 67.9 ± 100.4 < 0.001* Total cholesterol, mg/dL 183.5 ± 37.8 181.0 ± 31.7 0.608 Triglyceride, mg/dL 133.3 ± 86.4 135.0 ± 59.7 0.872 HDL, mg/dL 47.2 ± 7.9 44.3 ± 7.7 < 0.001* 10 year CHD risk High (> 20%) 2 2 < 0.001* Moderate (10 – 20%) 23 28 Low (< 10%) 31 26 NCEP criteria High 2 3 < 0.001* Moderate high 21 27 Moderate 22 19 Low 11 7
Values are mean ± SD or n
BMI = body mass index, HDL = high-density lipoprotein
10 year CHD risk = obtained by Framingham risk score calculator, NCEP = National Cholesterol Education Program, *Statistically significant
11
B. Change In Coronary Artery Lesions Over Time
A total of 111 segments with coronary plaques detected on baseline or follow-up CT were included in this analysis. The 111 segments consisted of a proximal left anterior descending (LAD, n = 34), mid-LAD (n = 19), proximal right coronary artery (RCA, n=16), left main (n = 12) and mid-RCA (n = 11), proximal left circumflex (LCX, n = 11), distal LAD (n = 2), distal RCA (n = 2), obtuse marginal branch (n = 2), first diagonal branch (n = 1), and the distal LCX (n = 1). Stenosis severity in all segments evaluated was < 50% the stenosis diameter on the baseline CTA, but 20 segments in 15 patients showed significant stenosis on the follow-up CTA. Eight of the 15 patients underwent invasive coronary angiography, and five underwent revascularization therapy with a coronary stent.
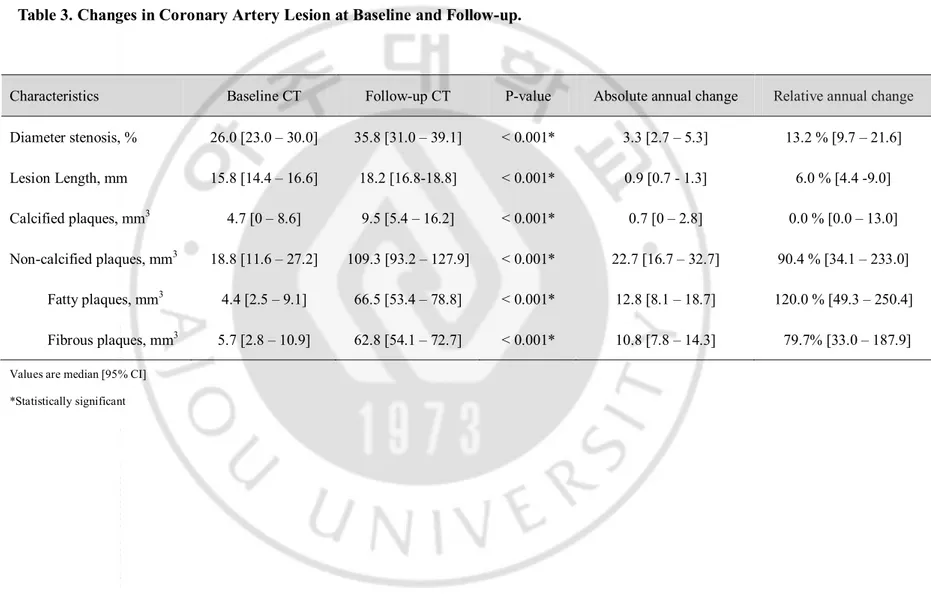
Stenosis diameter, lesion length, and calcified and non-calcified plaque volumes of the coronary lesions increased significantly during the follow-up period (Table 3). Absolute and relative annual changes in stenosis diameter, lesion length, and calcified and non-calcified plaque volumes were 3.3 mm3 (95% CI, 2.7–5.3 mm3) and 13.2% (95% CI, 9.7–21.6%), 0.9
mm3 (95% CI, 0.7–1.3 mm3) and 6.0% (95%CI, 4.4–9.0%), 0.7 mm3 (95% CI, 0–2.8 mm3)
and 0.0% (95% CI, 0.0–13.0%), and 22.7 mm3 (95% CI, 16.7–32.7 mm3) and 90.4% (95%
CI, 34.1–233.0%), respectively. The relative annual change in plaque volume was significantly greater (90.4% vs. 0.0%, p < 0.001) in non-calcified plaque than that in calcified plaque. However, no difference in the relative annual change between lipid-rich and fibrous plaque volumes was observed (120.0% vs. 79.7%, p = 0.487).
ICC for stenosis diameter, lesion length, and non-calcified plaque volumes between measurements by the same observer were 0.798, 0.837, and 0.875 at the baseline CTA,
12
respectively, and 0.779, 0.839, and 0.846 for the follow-up CTA, respectively. The CT values of the coronary artery lumen in the same lesion segments between the baseline and follow-up CT were not significantly different (p = 0.812) on a paired t-test
13
Table 3. Changes in Coronary Artery Lesion at Baseline and Follow-up.
Characteristics Baseline CT Follow-up CT P-value Absolute annual change Relative annual change
Diameter stenosis, % 26.0 [23.0 – 30.0] 35.8 [31.0 – 39.1] < 0.001* 3.3 [2.7 – 5.3] 13.2 % [9.7 – 21.6] Lesion Length, mm 15.8 [14.4 – 16.6] 18.2 [16.8-18.8] < 0.001* 0.9 [0.7 - 1.3] 6.0 % [4.4 -9.0] Calcified plaques, mm3 4.7 [0 – 8.6] 9.5 [5.4 – 16.2] < 0.001* 0.7 [0 – 2.8] 0.0 % [0.0 – 13.0] Non-calcified plaques, mm3 18.8 [11.6 – 27.2] 109.3 [93.2 – 127.9] < 0.001* 22.7 [16.7 – 32.7] 90.4 % [34.1 – 233.0] Fatty plaques, mm3 4.4 [2.5 – 9.1] 66.5 [53.4 – 78.8] < 0.001* 12.8 [8.1 – 18.7] 120.0 % [49.3 – 250.4] Fibrous plaques, mm3 5.7 [2.8 – 10.9] 62.8 [54.1 – 72.7] < 0.001* 10.8 [7.8 – 14.3] 79.7% [33.0 – 187.9] Values are median [95% CI]
14
C. Association between plaque volume changes and cardiovascular risk factors
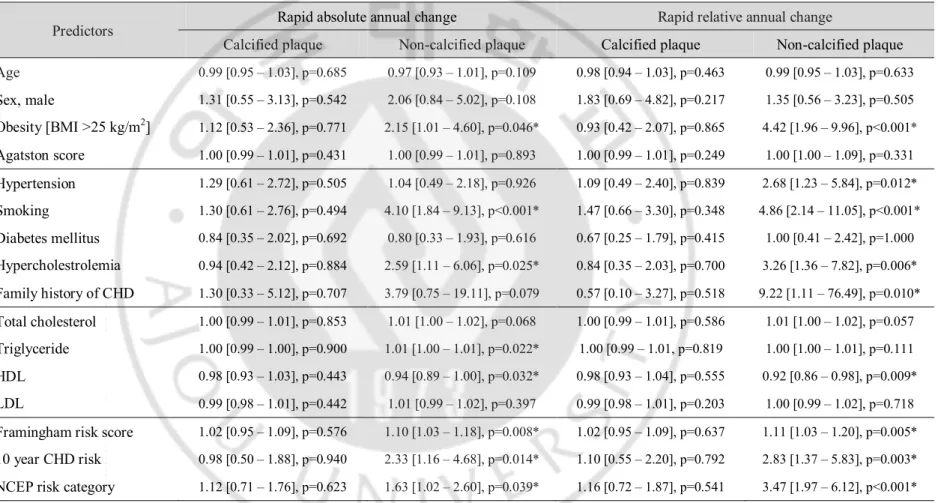
The univariate logistic regression analysis of annual plaque change versus cardiovascular risk factors is presented in Table 4. The absolute annual change in non-calcified plaque was significantly associated with obesity (odds ratio [OR], 2.15; p = 0.046), smoking (OR, 4.10; p < 0.001), hypercholesterolemia (OR, 2.59; p = 0.025), triglycerides (OR, 1.01; p = 0.022), HDL (OR, 0.94; p = 0.032), Framingham risk score (OR=1.10; p = 0.008) and 10 year CHD risk (OR, 2.33; p = 0.014). The relative annual change in non-calcified plaque was significantly associated with obesity (OR, 4.42; p < 0.001), hypertension (OR, 2.68; p = 0.012), smoking (OR, 4.86; p < 0.001), hypercholesterolemia (OR, 3.26; p = 0.006), family history of CHD (OR, 9.22; p = 0.010), HDL (OR, 0.92; p = 0.009), Framingham risk score (OR=1.11; p = 0.005), 10 year CHD risk (OR, 2.83; p = 0.003), and NCEP risk category (OR, 3.47; p < 0.001). In contrast, absolute and relative annual changes in calcified plaque were not associated with any cardiovascular risk factors.
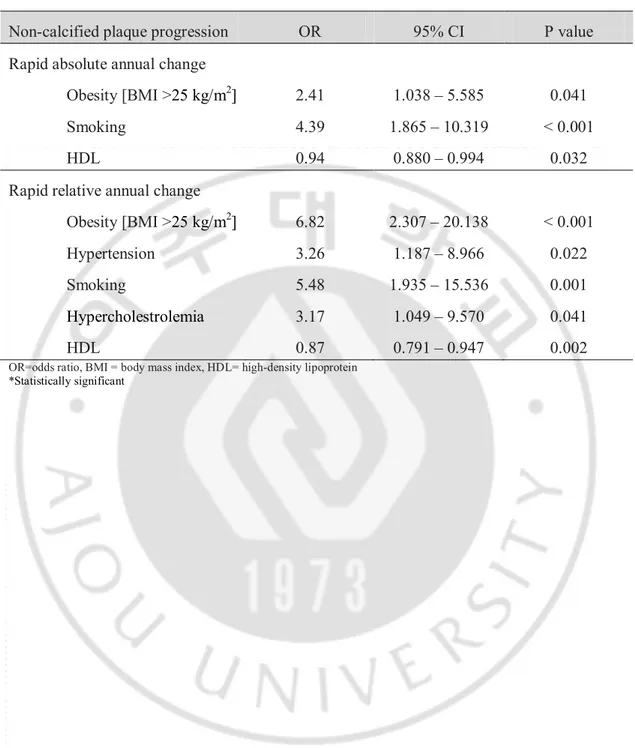
The cardiovascular risk factors found to be significant in the univariate analysis were included in a multiple logistic regression model (Table 5). The absolute annual change in non-calcified plaque was independently related to obesity (OR, 2.41; p = 0.041), smoking (OR, 4.39; p < 0.001), and HDL (OR, 0.94; p = 0.032). The relative annual change in non-calcified plaque was independently related to obesity (OR, 6.82; p < 0.001), hypertension (OR, 3.26; p = 0.022), smoking (OR, 5.48; p = 0.001), hypercholesterolemia (OR, 3.17; p = 0.041), and HDL (OR, 0.87; p = 0.002).
15
Table 4. Predictors of Rapid Plaque Progression, Univariate Analysis.
Predictors Rapid absolute annual change Rapid relative annual change
Calcified plaque Non-calcified plaque Calcified plaque Non-calcified plaque
Age 0.99 [0.95 – 1.03], p=0.685 0.97 [0.93 – 1.01], p=0.109 0.98 [0.94 – 1.03], p=0.463 0.99 [0.95 – 1.03], p=0.633 Sex, male 1.31 [0.55 – 3.13], p=0.542 2.06 [0.84 – 5.02], p=0.108 1.83 [0.69 – 4.82], p=0.217 1.35 [0.56 – 3.23], p=0.505 Obesity [BMI >25 kg/m2] 1.12 [0.53 – 2.36], p=0.771 2.15 [1.01 – 4.60], p=0.046* 0.93 [0.42 – 2.07], p=0.865 4.42 [1.96 – 9.96], p<0.001* Agatston score 1.00 [0.99 – 1.01], p=0.431 1.00 [0.99 – 1.01], p=0.893 1.00 [0.99 – 1.01], p=0.249 1.00 [1.00 – 1.09], p=0.331 Hypertension 1.29 [0.61 – 2.72], p=0.505 1.04 [0.49 – 2.18], p=0.926 1.09 [0.49 – 2.40], p=0.839 2.68 [1.23 – 5.84], p=0.012* Smoking 1.30 [0.61 – 2.76], p=0.494 4.10 [1.84 – 9.13], p<0.001* 1.47 [0.66 – 3.30], p=0.348 4.86 [2.14 – 11.05], p<0.001* Diabetes mellitus 0.84 [0.35 – 2.02], p=0.692 0.80 [0.33 – 1.93], p=0.616 0.67 [0.25 – 1.79], p=0.415 1.00 [0.41 – 2.42], p=1.000 Hypercholestrolemia 0.94 [0.42 – 2.12], p=0.884 2.59 [1.11 – 6.06], p=0.025* 0.84 [0.35 – 2.03], p=0.700 3.26 [1.36 – 7.82], p=0.006* Family history of CHD 1.30 [0.33 – 5.12], p=0.707 3.79 [0.75 – 19.11], p=0.079 0.57 [0.10 – 3.27], p=0.518 9.22 [1.11 – 76.49], p=0.010* Total cholesterol 1.00 [0.99 – 1.01], p=0.853 1.01 [1.00 – 1.02], p=0.068 1.00 [0.99 – 1.01], p=0.586 1.01 [1.00 – 1.02], p=0.057 Triglyceride 1.00 [0.99 – 1.00], p=0.900 1.01 [1.00 – 1.01], p=0.022* 1.00 [0.99 – 1.01, p=0.819 1.00 [1.00 – 1.01], p=0.111 HDL 0.98 [0.93 – 1.03], p=0.443 0.94 [0.89 – 1.00], p=0.032* 0.98 [0.93 – 1.04], p=0.555 0.92 [0.86 – 0.98], p=0.009* LDL 0.99 [0.98 – 1.01], p=0.442 1.01 [0.99 – 1.02], p=0.397 0.99 [0.98 – 1.01], p=0.203 1.00 [0.99 – 1.02], p=0.718
Framingham risk score 1.02 [0.95 – 1.09], p=0.576 1.10 [1.03 – 1.18], p=0.008* 1.02 [0.95 – 1.09], p=0.637 1.11 [1.03 – 1.20], p=0.005*
10 year CHD risk 0.98 [0.50 – 1.88], p=0.940 2.33 [1.16 – 4.68], p=0.014* 1.10 [0.55 – 2.20], p=0.792 2.83 [1.37 – 5.83], p=0.003*
NCEP risk category 1.12 [0.71 – 1.76], p=0.623 1.63 [1.02 – 2.60], p=0.039* 1.16 [0.72 – 1.87], p=0.541 3.47 [1.97 – 6.12], p<0.001*
Values are odds ratio [95% CI], BMI = body mass index, CHD=coronary heart disease, HDL=high-density lipoprotein, LDL=low density lipoprotein,
10 year CHD risk = obtained by Framingham risk score calculator, NCEP = National Cholesterol Education Program, *Statistically significant
16
Table 5. Predictors of Rapid Non-calcified Plaque Progression in a Multiple Logistic Regression Analysis.
Non-calcified plaque progression OR 95% CI P value
Rapid absolute annual change
Obesity [BMI >25 kg/m2] 2.41 1.038 – 5.585 0.041
Smoking 4.39 1.865 – 10.319 < 0.001
HDL 0.94 0.880 – 0.994 0.032
Rapid relative annual change
Obesity [BMI >25 kg/m2] 6.82 2.307 – 20.138 < 0.001
Hypertension 3.26 1.187 – 8.966 0.022
Smoking 5.48 1.935 – 15.536 0.001
Hypercholestrolemia 3.17 1.049 – 9.570 0.041
HDL 0.87 0.791 – 0.947 0.002
OR=odds ratio, BMI = body mass index, HDL= high-density lipoprotein
17
A B C D E F
18
Figure 1. Plaque lesion progression in the left mid ascending coronary artery at baseline and 20 month follow up in an 43 year-old male patient. Agaston scores increased from 1.71 to 13.3 (A). On multiplanar reconstruction image, with quantitative analysis, maximum diameter stenosis of proximal LAD lesion show progression from 6% to 57.9% (B). Non-calcified plaque volume increased consistently from 4.6 at baseline to 10.9 at follow up (C)
19
IV. DISCUSSION
The major findings of the present study were as follows: First, the coronary atherosclerotic plaques showed progression in plaque volume, luminal stenosis, and lesion length over time. Second, differences were observed in the rate of plaque progression according to plaque composition. The progression of plaque volume was significantly greater in non-calcified plaque compared with calcified plaque. Third, the progression of non-calcified plaque was significantly associated with cardiovascular risk factors.
The evaluation of coronary stenosis severity using invasive coronary angiography is based on the relative diameter of the stenosis (de Feyter et al., 1991). However, this method has a number of important problems. Adequately determining the normal reference diameter poses several problems due to the aging process related to vessel dilation, anatomical character of the tapering vessels, and predominantly diffuse, involved atherosclerotic lesions (Brown et al., 1977; Harrison et al., 1984; Glagov et al., 1987). Moreover, coronary arteries have a compensatory mechanism called positive remodeling, which increases vessel size during the early phase of CHD (Glagov et al., 1987; Nishioka et al., 1996). In contrast, cardiac MDCT is a non-invasive technique that directly measures early or subclinical coronary atherosclerotic plaque.
The main challenge for plaque volume measurements is the exact separation between the lumen, plaque, and vessel wall. In particular, delineation of the outer vessel boundary remains problematic, leading to high inter-observer and inter-scan variability (Leber et al., 2006; Maurovich-Horvat et al., 2009). However, the reproducibility of plaque volume measurements in recent studies has improved with the introduction of automatic software to quantify plaque. Blackmon et al (Blackmon et al., 2009) reported Pearson’s correlation coefficients of 0.781–0.920 according to observer experience. Lee et al (Lee et al., 2010) reported that the concordance correlation coefficients for both intra-observer and inter-observer agreement were 0.90. In the present study, the ICCs for intra-inter-observer agreement were almost perfect (ICC, 0.846–0.875). Another major limitation of plaque quantification is that no standard values of attenuation-based color coding are available for plaque characterization. It is difficult to further classify the non-calcified plaque because of the overlap in CT values of different non-calcified plaque composition (Cordeiro and Lima,
20
2006; Motoyama et al., 2009; Papadopoulou et al., 2011). Moreover, results from a phantom study indicated that intraluminal coronary arterial enhancement has a significant impact on accurate CT densitometry of coronary plaque (Cademartiri et al., 2005; Horiguchi et al., 2007). To overcome this limitation, we compared the intravascular attenuation values of the lesion segments between baseline and follow-up CTA; the results were not significantly different (p = 0.812) on a paired t-test.
Several researchers have reported that the rate of serial progression of plaque volume varies. In the present study, the absolute (median, 0.7 mm2) and relative (median, 0.0%)
annual changes in calcified plaque were much lower compared with those of previous results (Callister et al., 1998; Schmermund et al., 2001). Callister et al (Callister et al., 1998) reported a 44% median relative annual change in the volumetric score in asymptomatic high-risk individuals. Schmermund et al (Schmermund et al., 2001) reported 32% and 27% of the median relative annual progression of calcium score and area, respectively, in symptomatic patients. However, the progression rate depended on baseline plaque burden. In the present study, which included mainly low-to-intermediate risk patients, 18 (32%) patients on baseline and eight (14%) patients on follow-up had a zero calcium score. In the lesion-based analysis, 53 diseased segments (48%) on baseline CT and 40 diseased segments (36%) on follow-up CT showed zero calcium. When segments that converted from normal to abnormal calcium were excluded from the analysis, the relative annual change (median, 28.2%; 95% CI, 14.3–36.7%) was similar to previous reports.
In contrast, the progression of non-calcified plaque volume (median, 90.4%; 95% CI, 34.1–233.0%) at follow-up was higher than that reported previously(Schmid et al., 2008; Inoue et al., 2010). Schmid et al (Schmid et al., 2008) reported a mean annualized progression of 22% (95% CI, 14.7–29.7%) for the volume of non-calcified plaque in the LM and proximal LAD. Inoue et al (Inoue et al., 2010) reported a nonsignificant volumetric change (2.1 ± 3.0 vs. 2.3 ± 3.6 mm3, p = 0.2) of low attenuation plaque (<30 HU) confined to
only a 10-mm vascular segment in the non-treated control group. However, we evaluated all segments that showed plaque on CT. Furthermore, since our study population comprised mainly low-to-intermediate risk patients, several baseline volume data approached zero, which resulted in a greater relative annual change.
Although not demonstrated, it seems that non-calcified plaque could progress or regress more rapidly than calcified plaque components (Priester and Litwin, 2009). We also found
21
more rapid progression (median, 90.4 vs. 0.0%, p < 0.001) of non-calcified than calcified plaque at follow-up. Lehman et al (Lehman et al., 2009) reported a significant progression in the mean number of cross sections containing non-calcified (p = 0.04) but not calcified (p = 0.2) plaque. Non-calcified plaque reflects a feature of early atherosclerotic CHD and is more associated with acute coronary syndrome than calcified plaque (Fernandez-Ortiz et al., 1994; Bamberg et al., 2008). Therefore, quantifying the volume change in non-calcified plaque using serial CTA may be a promising shield for acute coronary syndrome. Moreover, this would be most significant if serial assessments were systematically combined with the efficacy of lipid-lowering therapy.
In the present study, the progression of non-calcified plaque was significantly associated with baseline cardiovascular risk factors. In particular, obesity (BMI > 25 kg/m2), smoking
history, and HDL level were independent predictors of both absolute and relative annual changes in non-calcified plaque, but calcified plaque was not associated with any risk factors (Table 4). The risk factors correlated with the extent of atherosclerotic plaque are uncertain compared with the relatively well-established relationship between a number of cardiovascular risk factors and clinical event rates (Nicholls et al., 2006). Lehman et al (Lehman et al., 2009) observed that a number of cardiovascular risk factors and smoking were independently associated with plaque progression. Uehara et al (Uehara et al., 2008) reported that LDL cholesterol level may be an important factor in decreasing non-calcified plaque area. In contrast, Hoffmann et al (Schmid et al., 2008; Hoffmann et al., 2010) found that cardiac risk factors have no significant effect on plaque growth rate unlike statin dosage, which has a direct effect on the growth rate of non-calcified plaque. Schmid et al (Schmid et al., 2008) found that the rate of change in plaque volume did not differ significantly according to LDL cholesterol level, which was supported by our findings. Moreover, the current guidelines do not recommend CTA screening due to the radiation hazard or use of contrast agent due to the expense. Thus, the clinical applications of CTA as a monitoring for coronary plaque progression remain questionable. Nevertheless, our results suggest the importance of risk modification in patients with subclinical CHD.
Some limitations of our study should be addressed. First, the study was performed in a small number of patients at mainly low-to-intermediate risk. We could not generalize the results due to the retrospective study design. Second, the presence of plaque was identified only visually by CT, and MDCT results were not compared to a reference standard such as
22
IVUS. Third, the radiation exposure from the repeated MDCT examinations was a major limitation. In our study, the radiation dose for a single MDCT examination was ~12 mSv. However, recent technical improvements have markedly reduced the radiation dose applied by ~45%, which may increase the acceptability of CT for monitoring the progression/regression of coronary atherosclerotic plaques.
23
V. CONCLUSION
In conclusion, coronary plaque volume increased significantly on follow-up CT, but the rate of progression was greater for non-calcified than for calcified plaque. Additionally, cardiovascular risk factors (obesity, smoking history, and HDL level) were independent predictors of both rapid absolute and relative annual progression of non-calcified plaque volume as assessed by MDCT; however, no cardiovascular risk factors were associated with the progression of calcified plaque.
24
REFERENCES
1.
Ardehali R, Nasir K, Kolandaivelu A, Budoff MJ, Blumenthal RS:
Screening patients for subclinical atherosclerosis with
non-contrast cardiac CT. Atherosclerosis 192: 235-242, 2007
2.
Bamberg F, Dannemann N, Shapiro MD, Seneviratne SK, Ferencik
M, Butler J, Koenig W, Nasir K, Cury RC, Tawakol A, Achenbach S,
Brady TJ, Hoffmann U: Association between cardiovascular risk
profiles and the presence and extent of different types of
coronary atherosclerotic plaque as detected by multidetector
computed tomography.
Arterioscler Thromb Vasc Biol 28:
568-574, 2008
3.
Bauer RW, Thilo C, Chiaramida SA, Vogl TJ, Costello P, Schoepf
UJ: Noncalcified atherosclerotic plaque burden at coronary CT
angiography: a better predictor of ischemia at stress myocardial
perfusion imaging than calcium score and stenosis severity.
AJR
Am J Roentgenol 193: 410-418, 2009
4.
Blackmon KN, Streck J, Thilo C, Bastarrika G, Costello P, Schoepf
UJ: Reproducibility of automated noncalcified coronary artery
plaque burden assessment at coronary CT angiography. J Thorac
Imaging 24: 96-102, 2009
5.
Brown BG, Bolson E, Frimer M, Dodge HT: Quantitative coronary
arteriography: estimation of dimensions, hemodynamic resistance,
and atheroma mass of coronary artery lesions using the
arteriogram and digital computation.
Circulation 55: 329-337,
1977
6.
Cademartiri F, Mollet NR, Runza G, Bruining N, Hamers R, Somers
P, Knaapen M, Verheye S, Midiri M, Krestin GP, de Feyter PJ:
Influence of intracoronary attenuation on coronary plaque
measurements
using
multislice
computed
tomography:
observations in an ex vivo model of coronary computed
tomography angiography. Eur Radiol 15: 1426-1431, 2005
7.
Callister TQ, Raggi P, Cooil B, Lippolis NJ, Russo DJ: Effect of
HMG-CoA reductase inhibitors on coronary artery disease as
assessed by electron-beam computed tomography. N Engl J Med
339: 1972-1978, 1998
8.
Clouse ME: How useful is computed tomography for screening for
coronary artery disease? Noninvasive screening for coronary
25
artery disease with computed tomography is useful.
Circulation
113: 125-146; discussion 125-146, 2006
9.
Cordeiro MA, Lima JA: Atherosclerotic plaque characterization by
multidetector row computed tomography angiography.
J Am Coll
Cardiol 47: C40-47, 2006
10.
de Feyter PJ, Serruys PW, Davies MJ, Richardson P, Lubsen J,
Oliver MF: Quantitative coronary angiography to measure
progression and regression of coronary atherosclerosis. Value,
limitations, and implications for clinical trials. Circulation 84:
412-423, 1991
11.
Expert Panel on Detection E, Treatment of High Blood Cholesterol
in A: Executive Summary of The Third Report of The National
Cholesterol Education Program (NCEP) Expert Panel on Detection,
Evaluation, And Treatment of High Blood Cholesterol In Adults
(Adult Treatment Panel III). JAMA 285: 2486-2497, 2001
12.
Fernandez-Ortiz A, Badimon JJ, Falk E, Fuster V, Meyer B,
Mailhac A, Weng D, Shah PK, Badimon L: Characterization of the
relative thrombogenicity of atherosclerotic plaque components:
implications for consequences of plaque rupture.
J Am Coll
Cardiol 23: 1562-1569, 1994
13.
Gibbons RJ, Abrams J, Chatterjee K, Daley J, Deedwania PC,
Douglas JS, Ferguson TB, Jr., Fihn SD, Fraker TD, Jr., Gardin JM,
O'Rourke RA, Pasternak RC, Williams SV, American College of C,
American Heart Association Task Force on practice g: ACC/AHA
2002 guideline update for the management of patients with
chronic stable angina--summary article: a report of the American
College of Cardiology/American Heart Association Task Force on
practice guidelines (Committee on the Management of Patients
With Chronic Stable Angina). J Am Coll Cardiol 41: 159-168, 2003
14.
Glagov S, Weisenberg E, Zarins CK, Stankunavicius R, Kolettis GJ:
Compensatory enlargement of human atherosclerotic coronary
arteries. N Engl J Med 316: 1371-1375, 1987
15.
Grundy SM, Cleeman JI, Merz CN, Brewer HB, Jr., Clark LT,
Hunninghake DB, Pasternak RC, Smith SC, Jr., Stone NJ, National
Heart L, Blood I, American College of Cardiology F, American
Heart A: Implications of recent clinical trials for the National
Cholesterol Education Program Adult Treatment Panel III
guidelines. Circulation 110: 227-239, 2004
26
Eastham CL, Marcus ML: The value of lesion cross-sectional area
determined by quantitative coronary angiography in assessing the
physiologic significance of proximal left anterior descending
coronary arterial stenoses. Circulation 69: 1111-1119, 1984
17.
Hoffmann H, Frieler K, Schlattmann P, Hamm B, Dewey M:
Influence of statin treatment on coronary atherosclerosis
visualised using multidetector computed tomography.
Eur Radiol
20: 2824-2833, 2010
18.
Hoffmann U, Moselewski F, Nieman K, Jang IK, Ferencik M,
Rahman AM, Cury RC, Abbara S, Joneidi-Jafari H, Achenbach S,
Brady TJ: Noninvasive assessment of plaque morphology and
composition in culprit and stable lesions in acute coronary
syndrome and stable lesions in stable angina by multidetector
computed tomography. J Am Coll Cardiol 47: 1655-1662, 2006
19.
Horiguchi J, Fujioka C, Kiguchi M, Shen Y, Althoff CE, Yamamoto
H, Ito K: Soft and intermediate plaques in coronary arteries: how
accurately can we measure CT attenuation using 64-MDCT?
AJR
Am J Roentgenol 189: 981-988, 2007
20.
Inoue K, Motoyama S, Sarai M, Sato T, Harigaya H, Hara T, Sanda
Y, Anno H, Kondo T, Wong ND, Narula J, Ozaki Y: Serial coronary
CT angiography-verified changes in plaque characteristics as an
end point: evaluation of effect of statin intervention.
JACC
Cardiovasc Imaging 3: 691-698, 2010
21.
Leber AW, Becker A, Knez A, von Ziegler F, Sirol M, Nikolaou K,
Ohnesorge B, Fayad ZA, Becker CR, Reiser M, Steinbeck G,
Boekstegers P: Accuracy of 64-slice computed tomography to
classify and quantify plaque volumes in the proximal coronary
system: a comparative study using intravascular ultrasound. J Am
Coll Cardiol 47: 672-677, 2006
22.
Lee MS, Chun EJ, Kim KJ, Kim JA, Vembar M, Choi SI:
Reproducibility in the assessment of noncalcified coronary plaque
with 256-slice multi-detector CT and automated plaque analysis
software. Int J Cardiovasc Imaging 26: 237-244, 2010
23.
Lehman SJ, Schlett CL, Bamberg F, Lee H, Donnelly P, Shturman
L, Kriegel MF, Brady TJ, Hoffmann U: Assessment of coronary
plaque
progression
in
coronary
computed
tomography
angiography using a semiquantitative score.
JACC Cardiovasc
Imaging 2: 1262-1270, 2009
27
Methods of plaque quantification and characterization by cardiac
computed tomography. J Cardiovasc Comput Tomogr 3 Suppl 2:
S91-98, 2009
25.
Mintz GS, Maehara A: Serial intravascular ultrasound assessment
of atherosclerosis progression and regression. State-of-the-art
and limitations. Circ J 73: 1557-1560, 2009
26.
Motoyama S, Sarai M, Harigaya H, Anno H, Inoue K, Hara T,
Naruse H, Ishii J, Hishida H, Wong ND, Virmani R, Kondo T, Ozaki
Y, Narula J: Computed tomographic angiography characteristics
of atherosclerotic plaques subsequently resulting in acute
coronary syndrome. J Am Coll Cardiol 54: 49-57, 2009
27.
Nicholls SJ, Tuzcu EM, Crowe T, Sipahi I, Schoenhagen P,
Kapadia S, Hazen SL, Wun CC, Norton M, Ntanios F, Nissen SE:
Relationship
between
cardiovascular
risk
factors
and
atherosclerotic disease burden measured by intravascular
ultrasound. J Am Coll Cardiol 47: 1967-1975, 2006
28.
Nishioka T, Luo H, Eigler NL, Berglund H, Kim CJ, Siegel RJ:
Contribution of inadequate compensatory enlargement to
development of human coronary artery stenosis: an in vivo
intravascular ultrasound study.
J Am Coll Cardiol 27: 1571-1576,
1996
29.
Papadopoulou SL, Neefjes LA, Schaap M, Li HL, Capuano E, van
der Giessen AG, Schuurbiers JC, Gijsen FJ, Dharampal AS,
Nieman K, van Geuns RJ, Mollet NR, de Feyter PJ: Detection and
quantification of coronary atherosclerotic plaque by 64-slice
multidetector CT: a systematic head-to-head comparison with
intravascular ultrasound. Atherosclerosis 219: 163-170, 2011
30.
Priester TC, Litwin SE: Measuring progression of coronary
atherosclerosis with computed tomography: searching for clarity
among shades of gray. J Cardiovasc Comput Tomogr 3 Suppl 2:
S81-90, 2009
31.
Schmermund A, Baumgart D, Mohlenkamp S, Kriener P, Pump H,
Gronemeyer D, Seibel R, Erbel R: Natural history and topographic
pattern of progression of coronary calcification in symptomatic
patients: An electron-beam CT study.
Arterioscler Thromb Vasc
Biol 21: 421-426, 2001
32.
Schmid M, Achenbach S, Ropers D, Komatsu S, Ropers U, Daniel
WG, Pflederer T: Assessment of changes in non-calcified
atherosclerotic plaque volume in the left main and left anterior
28
descending coronary arteries over time by 64-slice computed
tomography. Am J Cardiol 101: 579-584, 2008
33.
Schroeder S, Kuettner A, Leitritz M, Janzen J, Kopp AF, Herdeg C,
Heuschmid M, Burgstahler C, Baumbach A, Wehrmann M,
Claussen CD: Reliability of differentiating human coronary plaque
morphology using contrast-enhanced multislice spiral computed
tomography: a comparison with histology.
J Comput Assist
Tomogr 28: 449-454, 2004
34.
Soeda T, Uemura S, Morikawa Y, Ishigami K, Okayama S, Hee SJ,
Nishida T, Onoue K, Somekawa S, Takeda Y, Kawata H, Horii M,
Saito Y: Diagnostic accuracy of dual-source computed
tomography in the characterization of coronary atherosclerotic
plaques: comparison with intravascular optical coherence
tomography. Int J Cardiol 148: 313-318, 2011
35.
Uehara M, Funabashi N, Mikami Y, Shiina Y, Nakamura K, Komuro
I: Quantitative effect of atorvastatin on size and content of
non-calcified plaques of coronary arteries 1 year after atorvastatin
treatment by multislice computed tomography.
Int J Cardiol 130:
269-275, 2008
29 -국문 요약-
64 절편 다검출 전산화 단층 촬영을 이용한 관상 동맥 경화반
진행의
분석
아주대학교 대학원 의학과 김은영 (지도교수: 강두경)연구 배경: 관상 동맥 질환(coronary artery disease, 이하 CAD)은 전세계 사망원인 가운데 높은 비율을 차지 한다. 따라서 무증상 환자에서 관상 동맥 질환을 조기발견 하고 급성 관상 동맹 증후군으로의 진행을 예방하는 것이 수년간 중요시 되어 왔다. 관상동맥 다중검출기 CT(multidetector row CT, 이하 MDCT)는 비 침습적인 방법으로 혈관벽에 있는 경화반의 존재 여부 뿐 아니라 내부 성분을 알 수 있게 한다. 또한 다른 영상 방법과 비교했을 때 반복 검사가 비교적 용이하기 때문에 동맥경화의 진행 및 위험인자의 조절과 치료에 따른 반응을 연구할 수 있는 이점이 있다. 연구 목적: 본 연구에서는 Baseline 관상 동맥 CT 혈관 조영술( CT angiography, 이하 CTA)에서 발견된 관상동맥 경화반이 follow-up CTA 에서 변화한 정도를 확인하고 관상동맥질환 (CAD)의 고식적 위험 인자와의 연관 관계를 확인하고자 한다.
연구 방법: 2005 년 6 월부터 2011 년 3 월까지 평균 25 개월의 간격으로 두 번 이상 관상 동맥 64 절편 MDCT 를 시행한 환자 56 명을 대상으로 후향적으로 연구한다. 경화반의 성분은 noncalcified 및 calcified 로 분류한다. Calcified 경화반은 non contrast CT scan 에서의 관상 동맥 석회 수치를 통해 구하고 non calcified 경화반은 CTA 및 상용화된 경화반 분석 software 를 통해 구한다. Baseline 과 follow-up MDCT 에서의 경화반 용적 변화 및 심혈관 위험 인자 변화를 윌콕슨 테스트 통계 기법을 이용하여 비교한다. 절대적, 상대적 경화반 용적의 변화를 맨 휘트니 통계 기법을 이용하여 비교하고 경화반의 빠른 진행에 관여하는 심혈관 위험인자를 로지스틱 회귀 분석 기법을 통해 확인한다. 연구 결과: Calcified 경화반의 용적(4.7mm3 vs. 9.5 mm3, p<0.001), 및 Non-calcified 경화반의 용적(18.8mm3 vs. 109.3mm3, p<0.001), 협착 정도(26% vs. 35.8%,
30
p<0.001) 그리고 병변의 길이(15.8mm vs 18.2mm, p<0.001) 는 follow up 기간 동안 의미 있는 증가를 보였다. 병변 용적의 연간 절대적 및 퍼센트 변화 정도는 non-calcified 경화반 (median 22.7 mm3 and 90.4%) 이 calcified 경화반 (median 0.7mm3 and 0%)과 비교했을 때 더 큰 증가를 보였다. 심혈관 위험 인자는 non-calcified 경화반의 진행에 통계적으로 유의한 영향인자 였다. 특히 비만(BMI > 25 kg/m2), 흡연력, 혈중 high-density lipoprotein (HDL) 수치는 다변량 분석 결과 non-calcified 경화반의 절대적(오즈비[odds ratios] 2.41, 4.39, and 0.94) 및 상대적(오즈비[odds ratios] 6.82, 5.48, and 0.87) 연간 빠른 변화율에 독립적인 예측 변수 였다. 그러나 calcified 경화반의 진행에는 통계적으로 유의한 연관관계를 보이지 않았다. 결론 : 관상 동맥 경화반은 시간이 지남에 따라 용적의 의미 있는 증가는 보였지만 경화반의 진행 정도는 성분에 따라 다르며 non-calcified 경화반이 calcified 경화반에 비해 빠른 진행을 보였다. 또한 초기 심혈관 위험 인자의 유무는 non-calcified 경화반의 진행 정도에 유의한 예측변수임을 확인하였다. 핵심어: 관상 동맥 CT 혈관 조영술, 관상 동맥 석회화, 관상 동맥 경화반, 심혈관 위험인자