A STUDY FOR DOSE DISTRIBUTION IN SPENT FUEL STORAGE POOL INDUCED BY
NEUTRON AND GAMMA-RAY EMITTED IN SPENT FUELS
저자 Sohn, Hee-Dong ; Kim, Jong-Kyung
저널명 방사선방어학회지 = Journal of radiation protection and research
발행기관 대한방사선방어학회 NDSL URL http://www.ndsl.kr/ndsl/search/detail/article/articleSearchResultDetail.do?cn=JAKO201106064731607 IP/ID 121.170.188.123 이용시간 2018/04/26 06:19:08 저작권 안내 ① NDSL에서 제공하는 모든 저작물의 저작권은 원저작자에게 있으며, KISTI는 복제/배포/전송권을 확보하고 있습니다. ② NDSL에서 제공하는 콘텐츠를 상업적 및 기타 영리목적으로 복제/배포/전송할 경우 사전에 KISTI의 허락을 받아야 합니다. ③ NDSL에서 제공하는 콘텐츠를 보도, 비평, 교육, 연구 등을 위하여 정당한 범위 안에서 공정한 관행에 합치되게 인용할 수 있습니다. ④ NDSL에서 제공하는 콘텐츠를 무단 복제, 전송, 배포 기타 저작권법에 위반되는 방법으로 이용할 경우 저작권법 제136조에 따라 5년 이하의 징역 또는 5천만 원 이하의 벌금에 처해질 수 있습니다.
A STUDY FOR DOSE DISTRIBUTION IN SPENT FUEL
STORAGE POOL INDUCED BY NEUTRON AND
GAMMA‐RAY EMITTED IN SPENT FUELS
HEE DONG SOHN* and JONG KYUNG KIM†
*Doosan Heavy Industries & Construction 555 Gwigok‐Dong, Changwon, Gyeongnam 641‐792, Korea, †Nuclear Engineering Hanyang University Seoul 133‐791, Korea
Received May 28, 2011 / 1st Revised September 30, 2011 / 2st Revised October 10, 2011 / Accepted for Publication October 11, 2011
With the reactor operation conditions ‐ 4.3 wt% 235U initial enrichment, burn‐up 55,000 MWd/MTU, average power 34 MW/MTU for three periods burned time for 539.2 days per period and cooling time for 100 hours after shut down, to set up the condition to determine the minimum height (depth) of spent fuel storage pool to shut off the radiation out of the spent fuel storage pool and to store spent fuels safely, the dose rate on the specific position directed to the surface of spent fuel storage pool induced by the neutron and gamma‐ray from spent fuels are evaluated. The length of spent fuel is 381 cm, and as the result of evaluation on each position from the top of spent fuel to the surface of spent fuel storage pool, it is difficult for neutrons from spent fuels to pass through the water layer of maximum 219 cm (600 cm from the floor of spent fuel storage pool) and 419 cm (800 cm from the floor of spent fuel storage pool) for gamma‐ray. Therefore, neutron and gamma‐ray from spent fuels can pass through below 419 cm (800 cm from the floor) water layer directed to the surface of spent fuel storage pool.
Keywords : Spent Fuel, Spent Fuel Storage Pool, Dose Rate
1. INTRODUCTION
1)Spent fuels burned in reactor are cooled for about 100 hours to 150 hours and then they are discharged from reactor, transported to spent fuel storage pool and stored in spent fuel storage racks installed in on‐site spent fuel storage pool filled with boric acid solution for long time.
Spent fuel storage pool usually has a capacity to store spent fuels for 20 years, unless it is used for short‐term storage. It is located in the fuel building of nuclear power plant, and is composed of concrete structure with inner wall and floor clad by the stainless steel plates. Two places of inlet and outlet cooling pipes on the in-ner walls in spent fuel storage pool take a role to cool down the decay heat produced from spent fuels through the natural convection within boric acid solution environment.
The dimension of spent fuel storage pool, though it depends on the type of nuclear power plant, is usually
Corresponding author : Jong Kyung Kim, [email protected] Nuclear Engineering Hanyang University Seoul, Korea
width 10 m to 11 m x length 8 m to 9 m x height (depth) 12 m to 13 m and it has a shape liked rec-tangular parallelepiped.
Considering the height of spent fuel storage rack ‐ 4 m to 5 m, there happens a 7 m to 9 m of boric acid solution layer between the top of the spent fuel storage rack and the surface of spent fuel storage pool.
In spent fuels stored in spent fuel storage rack, neu-trons are continuously produced by an (α, n) reaction in Actinide series’ nuclides and spontaneous fission re-action, etc. besides, gamma‐ray is produced by fission products, Actinide series’ nuclides and nuclides by the irradiated structures of spent fuels, etc.
I
n this study, the dose rate on the surface of spent fuel storage pool induced by the neutron and gamma‐ray from spent fuels is evaluated, and it is also calculated at specific position on the way to the surface from the top of spent fuel storage rack.However, in this study, the dose rate caused by the decay gamma‐ray based on the boric acid solution and stainless steel plates irradiated by the radiation produced from spent fuels is not included.
HEE DONG SOHN, JONG KYUNG KIM : A Study for Dose Distribution in Spent Fuel Storage Pool
The regulatory requirement for the dose rate on the surface of spent fuel storage pool is described in refer-ence 1[1] – “Observe the ALARA principle as much as it can and the dose rate on the surface of spent fuel storage pool should not exceed 25 μSv/hr”.
The result of this study can be used as the basic data for setting up the condition to determine the minimum height (depth) of spent fuel storage pool to shut off the radiation out of the spent fuel storage pool and to store spent fuels safely.
2. MATERIAL AND METHODOLOGY
2.1 Fuel AssemblyThe fuel assembly applied in this study is 235U initial
enrichment 4.3 wt% PLUS7 [2] spent fuels with its burned condition in reactor. PLUS7 is composed of 236 fuel rods and 5 zirconium guide thimbles which are assumed to be filled with water. Including the upper and lower parts of stainless steel structure in PLUS7, the overall length is 4528 mm. In this study, however, only
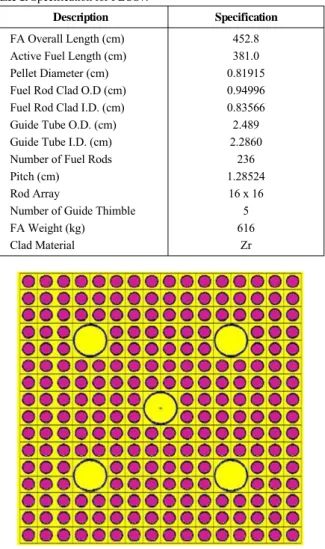
Table 1. Specification for PLUS7.
Description Specification
FA Overall Length (cm) Active Fuel Length (cm) Pellet Diameter (cm) Fuel Rod Clad O.D (cm) Fuel Rod Clad I.D. (cm) Guide Tube O.D. (cm) Guide Tube I.D. (cm) Number of Fuel Rods Pitch (cm)
Rod Array
Number of Guide Thimble FA Weight (kg) Clad Material 452.8 381.0 0.81915 0.94996 0.83566 2.489 2.2860 236 1.28524 16 x 16 5 616 Zr
Fig. 1. Cross Sectional View of PLUS7.
the active fuel length of 3810 mm is considered, and other parts are assumed to be filled with water. The de-tailed specification of PLUS7 is shown in Table 1, and the cross‐sectional view is shown in Figure 1.
2.2 Spent Fuel Storage Rack [3]
The main material and structure of spent fuel storage rack applied in this study is a stainless steel plates with 2.5 mm thickness and 3810 mm length, which is a square pillar, called a cell, enclosing the fuel assembly. These cells are arrayed with a pitch of 277 mm along the X‐Y direction. In reality, there are many stainless steel structures between cells and on the upper and low-er parts of fuel assembly to support it. Howevlow-er, in this study, these structures are replaced by water to mini-mize the neutron absorption effect of stainless steel plates. Figure 2 shows the general type of spent fuel storage rack.
2.3 Spent Fuel Storage Pool
The spent fuel storage pool constructed in fuel build-ing of nuclear power plant is the concrete structures with its inner walls and floor clad by the stainless steel plates. On the center of spent fuel storage pool floor, spent fuel storage rack with capacity of 100 spent fuels (10 x 10) is installed and it is assumed that spent fuel storage rack is fully filled with spent fuels. The di-mension of spent fuel storage rack is width 2.7 m x length 2.7 m x height 3.81 m, and the depth of spent fuel storage pool is 10 m, so there happens the boric acid solution of 6.19 m between the top of spent fuel storage rack and the surface of spent fuel storage pool. The usual spent fuel storage pool is shown in Figure 2.
In this study, to make neutron and gamma‐ray reach onto the surface of spent fuel storage pool, and to ig-nore the neutron absorption effect by Boron, the boric acid solution in spent fuel storage pool is replaced by water, and to minimize the neutron and gamma‐ray ab-sorption effect by surrounding structures like concrete, the spent fuel storage pool is modeled enough large by width and length.
2.4 Computer Code and Cross Section Library
Computer codes used in this study are as follows, < SCALE 6.0 > [4]
The Standardized Computer Analyses for Licensing Evaluation (SCALE) software system developed at Oak Ridge National Laboratory (ORNL) is widely used for nuclear applications such as problem‐dependent reso-nance self‐shielding of cross‐section data, criticality safety, radiation source terms and shielding, sensitivity and uncertainly, and reactor physics analyses. Especially, to perform the burn‐up calculation of spent fuel, XSDRNPM module for cross section processing and ORIGEN‐ARP coupled with ORIGEN‐S module for burn‐up and decay calculation according to the cooling time are applied. SCALE is sponsored by the U.S. Nuclear Regulatory Commission and the U.S. Department of Energy.
< MCNPX > [5]
The Monte Carlo N‐Particle transport code, MCNPX, developed at LANL (Los Alamos National Laboratory) and ENDF/B‐VI cross section library were employed to calculate the dose rate in spent fuel storage pool. MCNPX is a general purpose Monte Carlo code for cal-culating the time‐dependent continuous‐energy transport
of neutrons, photons and/or electrons in three‐dimen-sional geometries. And it is most widely used in the field of criticality, shielding analysis and the verification evaluation, not only because of its high confidence but also its high variance reduction techniques to improve the efficiency of difficult calculations.
2.5 Analysis Condition
To evaluate the dose rate in spent fuel storage pool, following conditions should be prepared previously,
‐ Nuclides composition calculation for spent fuel by SCALE 6.0 system
‐ Neutron and gamma‐ray source term calculation for spent fuels
‐ Fuel assembly (PLUS7) type including dimension and composites
Especially, neutron and gamma‐ray source term is calculated with following conditions.
‐ ORIGEN‐ARP/ORIGEN‐S module and 27GROUPENDF4 cross section library in SCALE 6.0 system. ‐ Reactor core power level (It is assumed to be
con-stant for all periods)
‐ Quantities of loaded fuel assembly ‐ Burn‐up and initial enrichment condition
‐ Cooling time in reactor after shut down (Divided in-to from 0.1 hour in-to 100 hours with a proper time interval)
3. RESULTS AND DISCUSSION
3.1 Nuclides Composition in Spent Fuel
To calculate the nuclides in spent fuels using ORIGEN ‐ ARP, the necessary data is 235U initial enrichment (4.3 wt%), burn‐up condition (55,000 MWd/MTU), cooling time in reactor after shut down (100 hours), average power level (34 MW/MTU for 3 periods) and burned time in reactor (539.2 Day per period). Uranium amount in fuel is set as 1 Ton and the density of cooling water during reactor operation is 0.71 g․cc-1.
Table 2 and Figure 3 depict the results of spent fuel nuclides calculated by ORIGEN‐ARP. The calculated nuclides are used for MCNPX input to evaluate the neu-tron and gamma‐ray dose rate[6] in spent fuel storage pool.
HEE DONG SOHN, JONG KYUNG KIM : A Study for Dose Distribution in Spent Fuel Storage Pool
Nuclide
Time (Hours)
1.00E‐01 3.00E‐01 1.00E+00 3.00E+00 1.00E+01 3.00E+01 1.00E+02
Units of Concentrations : grams (basis = 1 MUT)
u238 9.17E+05 9.17E+05 9.17E+05 9.17E+05 9.17E+05 9.17E+05 9.28E+05 u235 6.40E+03 6.40E+03 6.40E+03 6.40E+03 6.40E+03 6.40E+03 6.40E+03 pu239 6.08E+03 6.08E+03 6.08E+03 6.08E+03 6.09E+03 6.11E+03 6.14E+03 u236 6.11E+03 6.11E+03 6.11E+03 6.11E+03 6.11E+03 6.11E+03 6.11E+03 xe136 3.77E+03 3.77E+03 3.77E+03 3.77E+03 3.77E+03 3.77E+03 3.77E+03 pu240 3.05E+03 3.05E+03 3.05E+03 3.05E+03 3.05E+03 3.05E+03 3.05E+03 xe134 2.53E+03 2.53E+03 2.53E+03 2.53E+03 2.53E+03 2.53E+03 2.53E+03 ba138 2.15E+03 2.15E+03 2.15E+03 2.15E+03 2.15E+03 2.15E+03 2.15E+03 ce140 2.07E+03 2.07E+03 2.07E+03 2.07E+03 2.07E+03 2.07E+03 2.07E+03 la139 2.00E+03 2.00E+03 2.00E+03 2.00E+03 2.00E+03 2.00E+03 2.00E+03 cs137 2.00E+03 2.00E+03 2.00E+03 2.00E+03 2.00E+03 2.00E+03 2.00E+03 xe132 1.95E+03 1.95E+03 1.95E+03 1.95E+03 1.95E+03 1.95E+03 1.95E+03 nd144 1.92E+03 1.92E+03 1.92E+03 1.92E+03 1.92E+03 1.92E+03 1.92E+03 pu241 1.88E+03 1.88E+03 1.88E+03 1.88E+03 1.88E+03 1.87E+03 1.87E+03 ce142 1.84E+03 1.84E+03 1.84E+03 1.84E+03 1.84E+03 1.84E+03 1.84E+03 pr141 1.78E+03 1.78E+03 1.78E+03 1.78E+03 1.78E+03 1.78E+03 1.78E+03 cs133 1.77E+03 1.77E+03 1.77E+03 1.77E+03 1.77E+03 1.77E+03 1.77E+03 mo100 1.56E+03 1.56E+03 1.56E+03 1.56E+03 1.56E+03 1.56E+03 1.56E+03 ru102 1.37E+03 1.37E+03 1.37E+03 1.37E+03 1.37E+03 1.37E+03 1.37E+03 mo98 1.36E+03 1.36E+03 1.36E+03 1.36E+03 1.36E+03 1.36E+03 1.36E+03 mo97 1.33E+03 1.33E+03 1.33E+03 1.33E+03 1.33E+03 1.33E+03 1.33E+03 zr96 1.31E+03 1.31E+03 1.31E+03 1.31E+03 1.31E+03 1.31E+03 1.31E+03 ru101 1.28E+03 1.28E+03 1.28E+03 1.28E+03 1.28E+03 1.28E+03 1.28E+03 zr94 1.25E+03 1.25E+03 1.25E+03 1.25E+03 1.25E+03 1.25E+03 1.25E+03 tc99 1.23E+03 1.23E+03 1.23E+03 1.23E+03 1.23E+03 1.23E+03 1.24E+03 nd146 1.21E+03 1.21E+03 1.21E+03 1.21E+03 1.21E+03 1.21E+03 1.21E+03 nd143 1.14E+03 1.14E+03 1.14E+03 1.14E+03 1.14E+03 1.14E+03 1.14E+03 zr93 1.13E+03 1.13E+03 1.13E+03 1.13E+03 1.13E+03 1.13E+03 1.13E+03 mo95 1.10E+03 1.10E+03 1.10E+03 1.10E+03 1.10E+03 1.10E+03 1.10E+03 pu242 1.05E+03 1.05E+03 1.05E+03 1.05E+03 1.05E+03 1.05E+03 1.05E+03 nd145 1.04E+03 1.04E+03 1.04E+03 1.04E+03 1.04E+03 1.04E+03 1.04E+03 zr92 1.03E+03 1.03E+03 1.03E+03 1.03E+03 1.03E+03 1.03E+03 1.03E+03 ru104 9.73E+02 9.73E+02 9.73E+02 9.73E+02 9.73E+02 9.73E+02 9.73E+02 zr91 9.06E+02 9.06E+02 9.07E+02 9.07E+02 9.07E+02 9.07E+02 9.08E+02 sr90 8.31E+02 8.31E+02 8.31E+02 8.31E+02 8.31E+02 8.31E+02 8.31E+02 np237 8.16E+02 8.16E+02 8.17E+02 8.17E+02 8.17E+02 8.18E+02 8.21E+02 cs135 7.14E+02 7.14E+02 7.14E+02 7.14E+02 7.14E+02 7.14E+02 7.15E+02 pd105 6.95E+02 6.95E+02 6.95E+02 6.95E+02 6.95E+02 6.96E+02 6.96E+02 y89 6.92E+02 6.92E+02 6.92E+02 6.92E+02 6.92E+02 6.93E+02 6.93E+02 rh103 6.51E+02 6.51E+02 6.51E+02 6.51E+02 6.51E+02 6.52E+02 6.54E+02 Total 1.00E+06 1.00E+06 1.00E+06 1.00E+06 1.00E+06 1.00E+06 1.00E+06
Table 2. Nuclides in Spent Fuel.
Table 2 shows the weight of nuclides in gram unit according to the cooling time after shut down before spent fuels are transported to the spent fuel storage rack. As shown in Table 2 and Figure 3, over 90% of the nuclides in spent fuels are 238U, and there is few changes in nuclides’ weight as per the cooling time. The reason why cooling time is set as 100 hours is that spent fuels are discharged and transported to the spent fuel storage rack after having been cooled in reactor for 100 hours.
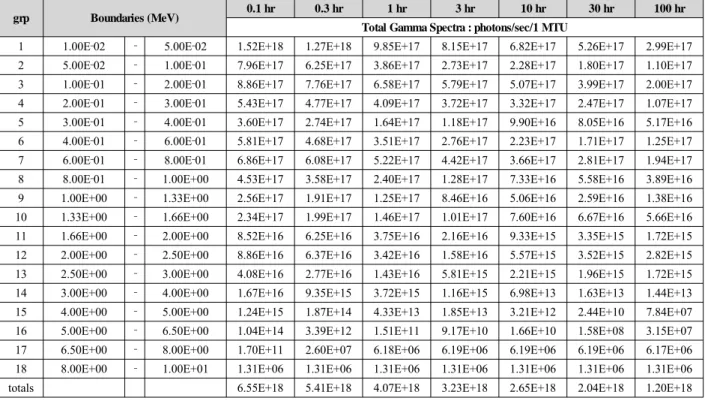
Table 3 and Table 4 indicate the neutron and gamma‐ ray source intensity as per the separate energy group with cooling time after 3 periods burned in reactor, and the same results are shown in Figure 4 and Figure 5. As described in Table 3, in case of neutron source (neutrons/sec), right after the reactor shut down, over 80% of neutrons are ranged 0.1 MeV to 0.9 MeV, about 10% are ranged 0.017 MeV to 0.1 MeV and about 8% are ranged 0.9 MeV to 20 MeV.
Table 3. Neutron Intensity with Cooling Time.
grp Boundaries (MeV) Initial 0.1 hr 0.3 hr 1 hr 3 hr 10 hr 30 hr 100 hr
Total Neutron Spectra : neutrons/sec/1 MTU
1 1.00E‐11 ‐ 1.00E‐08 3.76E+07 8.26E+04 1.06E+01 3.90E‐03 3.90E‐03 3.90E‐03 3.89E‐03 3.86E‐03 2 1.00E‐08 ‐ 3.00E‐08 7.52E+07 1.65E+05 2.12E+01 5.80E‐03 5.80E‐03 5.80E‐03 5.80E‐03 5.76E‐03 3 3.00E‐08 ‐ 5.00E‐08 7.52E+07 1.65E+05 2.12E+01 6.56E‐03 6.56E‐03 6.56E‐03 6.56E‐03 6.53E‐03 4 5.00E‐08 ‐ 1.00E‐07 1.88E+08 4.13E+05 5.30E+01 1.99E‐02 1.99E‐02 1.99E‐02 1.99E‐02 1.98E‐02 5 1.00E‐07 ‐ 2.25E‐07 4.70E+08 1.03E+06 1.33E+02 6.73E‐02 6.74E‐02 6.74E‐02 6.74E‐02 6.72E‐02 6 2.25E‐07 ‐ 3.25E‐07 3.76E+08 8.27E+05 1.06E+02 6.83E‐02 6.83E‐02 6.83E‐02 6.83E‐02 6.81E‐02 7 3.25E‐07 ‐ 4.00E‐07 2.82E+08 6.20E+05 7.96E+01 5.86E‐02 5.86E‐02 5.86E‐02 5.86E‐02 5.84E‐02 8 4.00E‐07 ‐ 8.00E‐07 1.50E+09 3.31E+06 4.24E+02 3.98E‐01 3.98E‐01 3.99E‐01 3.99E‐01 3.97E‐01 9 8.00E‐07 ‐ 1.00E‐06 7.52E+08 1.65E+06 2.12E+02 2.42E‐01 2.43E‐01 2.43E‐01 2.43E‐01 2.42E‐01 10 1.00E‐06 ‐ 1.13E‐06 4.89E+08 1.08E+06 1.38E+02 1.71E‐01 1.71E‐01 1.71E‐01 1.71E‐01 1.71E‐01 11 1.13E‐06 ‐ 1.30E‐06 6.39E+08 1.41E+06 1.80E+02 2.38E‐01 2.38E‐01 2.38E‐01 2.38E‐01 2.38E‐01 12 1.30E‐06 ‐ 1.77E‐06 1.77E+09 3.89E+06 4.99E+02 7.37E‐01 7.37E‐01 7.38E‐01 7.38E‐01 7.36E‐01 13 1.77E‐06 ‐ 3.05E‐06 4.81E+09 1.06E+07 1.36E+03 2.50E+00 2.50E+00 2.50E+00 2.50E+00 2.49E+00 14 3.05E‐06 ‐ 1.00E‐05 2.61E+10 5.75E+07 7.39E+03 2.20E+01 2.20E+01 2.20E+01 2.20E+01 2.19E+01 15 1.00E‐05 ‐ 3.00E‐05 7.52E+10 1.65E+08 2.13E+04 1.11E+02 1.11E+02 1.11E+02 1.11E+02 1.11E+02 16 3.00E‐05 ‐ 1.00E‐04 2.63E+11 5.79E+08 7.49E+04 7.06E+02 7.06E+02 7.07E+02 7.07E+02 7.05E+02 17 1.00E‐04 ‐ 5.50E‐04 1.69E+12 3.72E+09 4.87E+05 1.00E+04 1.00E+04 1.00E+04 1.00E+04 1.00E+04 18 5.50E‐04 ‐ 3.00E‐03 9.21E+12 2.03E+10 2.72E+06 1.27E+05 1.27E+05 1.27E+05 1.27E+05 1.27E+05 19 3.00E‐03 ‐ 1.70E‐02 6.27E+13 1.95E+11 2.67E+07 1.72E+06 1.72E+06 1.72E+06 1.72E+06 1.72E+06 20 1.70E‐02 ‐ 1.00E‐01 4.07E+14 6.90E+11 1.12E+08 2.41E+07 2.41E+07 2.41E+07 2.41E+07 2.40E+07 21 1.00E‐01 ‐ 4.00E‐01 1.64E+15 1.95E+12 4.10E+08 1.63E+08 1.63E+08 1.64E+08 1.64E+08 1.63E+08 22 4.00E‐01 ‐ 9.00E‐01 1.57E+15 4.23E+11 4.05E+08 3.56E+08 3.56E+08 3.57E+08 3.57E+08 3.56E+08 23 9.00E‐01 ‐ 1.40E+00 3.12E+14 1.61E+10 3.58E+08 3.58E+08 3.58E+08 3.58E+08 3.58E+08 3.57E+08 24 1.40E+00 ‐ 1.85E+00 1.85E+13 8.02E+08 2.89E+08 2.89E+08 2.90E+08 2.90E+08 2.90E+08 2.89E+08 25 1.85E+00 ‐ 3.00E+00 5.58E+08 5.58E+08 5.58E+08 5.58E+08 5.59E+08 5.59E+08 5.59E+08 5.57E+08 26 3.00E+00 ‐ 6.43E+00 5.08E+08 5.08E+08 5.08E+08 5.08E+08 5.08E+08 5.08E+08 5.08E+08 5.07E+08 27 6.43E+00 ‐ 2.00E+01 4.48E+07 4.48E+07 4.48E+07 4.48E+07 4.48E+07 4.49E+07 4.49E+07 4.48E+07 totals 4.02E+15 3.30E+12 2.72E+09 2.30E+09 2.30E+09 2.31E+09 2.31E+09 2.30E+09
Table 4. Gamma‐ray Intensity with Cooling Time.
grp Boundaries (MeV) 0.1 hr 0.3 hr 1 hr 3 hr 10 hr 30 hr 100 hr
Total Gamma Spectra : photons/sec/1 MTU
1 1.00E‐02 ‐ 5.00E‐02 1.52E+18 1.27E+18 9.85E+17 8.15E+17 6.82E+17 5.26E+17 2.99E+17 2 5.00E‐02 ‐ 1.00E‐01 7.96E+17 6.25E+17 3.86E+17 2.73E+17 2.28E+17 1.80E+17 1.10E+17 3 1.00E‐01 ‐ 2.00E‐01 8.86E+17 7.76E+17 6.58E+17 5.79E+17 5.07E+17 3.99E+17 2.00E+17 4 2.00E‐01 ‐ 3.00E‐01 5.43E+17 4.77E+17 4.09E+17 3.72E+17 3.32E+17 2.47E+17 1.07E+17 5 3.00E‐01 ‐ 4.00E‐01 3.60E+17 2.74E+17 1.64E+17 1.18E+17 9.90E+16 8.05E+16 5.17E+16 6 4.00E‐01 ‐ 6.00E‐01 5.81E+17 4.68E+17 3.51E+17 2.76E+17 2.23E+17 1.71E+17 1.25E+17 7 6.00E‐01 ‐ 8.00E‐01 6.86E+17 6.08E+17 5.22E+17 4.42E+17 3.66E+17 2.81E+17 1.94E+17 8 8.00E‐01 ‐ 1.00E+00 4.53E+17 3.58E+17 2.40E+17 1.28E+17 7.33E+16 5.58E+16 3.89E+16 9 1.00E+00 ‐ 1.33E+00 2.56E+17 1.91E+17 1.25E+17 8.46E+16 5.06E+16 2.59E+16 1.38E+16 10 1.33E+00 ‐ 1.66E+00 2.34E+17 1.99E+17 1.46E+17 1.01E+17 7.60E+16 6.67E+16 5.66E+16 11 1.66E+00 ‐ 2.00E+00 8.52E+16 6.25E+16 3.75E+16 2.16E+16 9.33E+15 3.35E+15 1.72E+15 12 2.00E+00 ‐ 2.50E+00 8.86E+16 6.37E+16 3.42E+16 1.58E+16 5.57E+15 3.52E+15 2.82E+15 13 2.50E+00 ‐ 3.00E+00 4.08E+16 2.77E+16 1.43E+16 5.81E+15 2.21E+15 1.96E+15 1.72E+15 14 3.00E+00 ‐ 4.00E+00 1.67E+16 9.35E+15 3.72E+15 1.16E+15 6.98E+13 1.63E+13 1.44E+13 15 4.00E+00 ‐ 5.00E+00 1.24E+15 1.87E+14 4.33E+13 1.85E+13 3.21E+12 2.44E+10 7.84E+07 16 5.00E+00 ‐ 6.50E+00 1.04E+14 3.39E+12 1.51E+11 9.17E+10 1.66E+10 1.58E+08 3.15E+07 17 6.50E+00 ‐ 8.00E+00 1.70E+11 2.60E+07 6.18E+06 6.19E+06 6.19E+06 6.19E+06 6.17E+06 18 8.00E+00 ‐ 1.00E+01 1.31E+06 1.31E+06 1.31E+06 1.31E+06 1.31E+06 1.31E+06 1.31E+06 totals 6.55E+18 5.41E+18 4.07E+18 3.23E+18 2.65E+18 2.04E+18 1.20E+18
HEE DONG SOHN, JONG KYUNG KIM : A Study for Dose Distribution in Spent Fuel Storage Pool
Fig. 3. Nuclides in Spent Fuel.
Fig. 4. Neutron Intensity with Cooling Time after Shutdown.
Fig. 5. Gamma‐ray Intensity with Cooling Time after Shutdown.
As cooling time passes by in reactor, there happens few changes in quantities for neutrons over 1.85 MeV, however, conversely, neutrons below 1.85 MeV de-creased in quantities abruptly, so, 100 hours after shut down, over 48% of neutrons are ranged as 1.85 MeV to 20 MeV and about 44% are 0.4 MeV to 1.85 MeV. It means that most neutrons having an effect on the sur-face of spent fuel storage pool are the ones ranged 0.4 MeV to 20 MeV.
In case of gamma‐ray, 6 minutes after shut down, about 49% of them are 0.01 MeV to 0.2 MeV, 40% are 0.2 MeV to 1 MeV, 10% are 1 MeV to 2.5 MeV and just 1% of them is 2 MeV to 10 MeV. And, even 100 hours after shut down, gamma‐ray intensity as per the separate energy group is almost same with the above re-sults (6 minutes after shut down).
3.2 Neutron Dose Rate at Specified Position in Spent Fuel Storage Pool
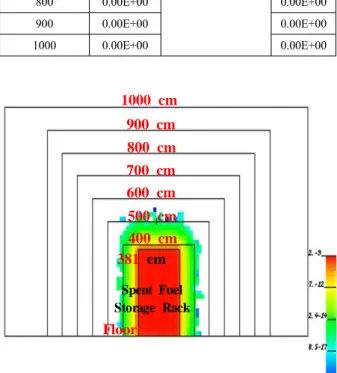
Figure 6 shows the spent fuel storage rack installed on the floor of spent fuel storage pool which is filled with spent fuels and water. The width and length of spent fuel storage rack are 2.7 m each and the height is 3.8 m. The reason why 3.8 m is set as the height of spent fuel storage rack is that the overall length of Active Fuel Length of spent fuel is 3.8 m. The overall size of spent fuel storage pool is 20 m x 20 m x 10 m.
To calculate the neutron dose rate at specified posi-tion in spent fuel storage pool, it is divided as many areas from the top of spent fuel storage rack toward the surface in spent fuel storage pool as shown in Figure 7 – the positions are 400 cm, 500 cm, 600 cm, 700 cm, 800 cm, 900 cm, 1000 cm apart from the floor of spent fuel storage pool and the dose rate is calculated at each position. Nuclides and composite from spent fuels are applied as the same ones calculated in section 3.1 and neutron source intensity as per the energy group is also applied as the same results calculated in section 3.1.
1000 cm Spent Fuel Storage Rack Floor 900 cm 800 cm 700 cm 600 cm 500 cm 400 cm 381 cm
Fig. 6. Areas from the Top of Spent Fuel Storage Rack in Spent Fuel
Table 5. Neutron Dose Rate. Z Axis Position From Floor (cm) Neutron Fluence (#/cm2) Neutron Intensity (Neutron/sec, 10x10 FA) mSv/h 400 7.06E‐12 1.00E+11 7.05E‐01 500 2.19E‐16 2.19E‐05 600 0.00E+00 0.00E+00 700 0.00E+00 0.00E+00 800 0.00E+00 0.00E+00 900 0.00E+00 0.00E+00 1000 0.00E+00 0.00E+00
Table 6. Gamma‐ray Dose Rate. Z Axis Position From Floor (cm) Gamma‐ray Fluence (#/cm2) Gamma‐ray Intensity (Photon/sec, 10x10 FA) mSv/h 400 8.87E‐14 5.23E+19 4.64E+06 500 8.99E‐17 4.70E+03 600 4.00E‐19 2.09E+01 700 1.67E‐21 8.73E‐02 800 0.00E+00 0.00E+00 900 0.00E+00 0.00E+00 1000 0.00E+00 0.00E+00 381 cm 500 cm 600 cm 700 cm 800 cm 900 cm 1000 cm 400 cm Spent Fuel Storage Rack Floor
Fig. 7. Neutron Dose Rate as per the Position from the Floor of Spent Fuel
Storage Pool.
As described in Table 5, neutrons are perceived from the top of spent fuel storage rack to the position of 119 cm (500 cm from the floor) upward to the surface of spent fuel storage pool. It means that it is possible for neutrons to pass through the water layer of maximum 219 cm (600 cm from the floor of spent fuel storage pool) from the top of spent fuel storage rack. Figure 7
and Figure 9 describe the neutron dose rate from the floor to the surface of spent fuel storage pool.
3.3 Gamma‐ray Dose Rate at Specified Position in Spent Fuel Storage Pool
Gamma‐ray dose rate at specified position from the floor to the surface of spent fuel storage pool is also performed using the spent fuel nuclides calculated in section 3.1 and gamma‐ray intensity with energy group. As depicted in Table 6, gamma‐ray has an effect to 319 cm (700 cm from the floor) from the top of spent fuel storage rack. It means that it is possible for gamma‐ray to move upward to the surface about 200 cm farther than neutron, and gamma‐ray can pass through below 419 cm (800 cm from the floor) of water layer from the top of spent fuel storage rack. Figure 8 and Figure 10 show the gamma‐ray dose rate at specified position from the floor to the surface of spent fuel storage pool.
Spent Fuel Storage Rack 900 cm 800 cm 700 cm 600 cm 500 cm 400 cm 381 cm Floor 1000 cm
Fig. 8. Gamma‐ray Dose Rate as per the Position from the Floor of Spent
HEE DONG SOHN, JONG KYUNG KIM : A Study for Dose Distribution in Spent Fuel Storage Pool
Fig. 9. Neutron Dose Rate with Distance from the Floor of Spent Fuel
Storage Pool.
3.4 Total Dose Rate at Specified Position in Spent Fuel Storage Pool
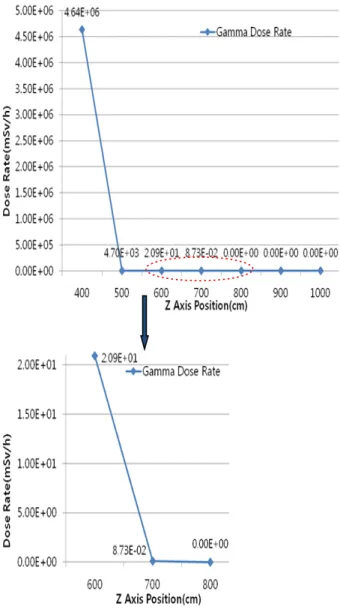
Table 7 and Figure 11 describe the total dose rate, gamma‐ray plus neutron, calculated in section 3.2 and 3.3. Because gamma‐ray dose rate at specified position is much greater than neutron dose rate, so, total dose rate is proportional to the gamma‐ray dose rate. That is, neutron and gamma‐ray from spent fuel can pass through below 419 cm (800 cm from the floor) water layer directed to the surface of spent fuel storage pool.
Fig. 10. Gamma‐ray Dose Rate with Distance from the Floor of Spent
Fuel Storage Pool.
Table 7. Total Dose Rate. Z Axis Position From Floor (cm) mSv/h 400 4.64E+06 500 4.70E+03 600 2.09E+01 700 8.73E‐02 800 0.00E+00 900 0.00E+00 1000 0.00E+00
Fig. 11. Total Dose Rate with Distance from the Floor of Spent Fuel
Storage Pool.
4. CONCLUSION
Fuel assembly (PLUS7) with its burned condition – initial enrichment 4.3 wt%, burn‐up 55,000 MWd/MTU, average power 34 MW/MTU for three periods burned time 539.2 days per period and cooling time for 100 hours after shut down, spent fuels discharged from re-actor are transported to the spent fuel storage rack, and neutron and gamma‐ray from spent fuel can pass through below 419 cm (800 cm from the floor) water layer directed to the surface of spent fuel storage pool.
Therefore, the depth, 1000 cm (619 cm from the top of spent fuel storage rack), between the floor and the surface of spent fuel storage pool applied in this study abides by the requirements (dose rate on the surface does not exceed 25 μSv․hr-1) provided in ANSI/ANS‐ 57.2‐1983 and can store spent fuels safely on the aspect of ALARA.
Considering the usual depth of 12 m in spent fuel storage pool, it is possible to shield the neutron and gamma‐ray during normal operation, however, if there happens a coolant leakage accident in spent fuel storage pool, to shut off the neutron and gamma‐ray outside the spent fuel storage pool, so, to decide the minimum sur-face height of spent fuel storage pool, the result of this study can be applied.
REFERENCES
1. ANSI/ANS‐57.2‐1983. Design Requirements for Light Water Reactor Fuel Storage Facilities at Nuclear Power Plants.
2. Technical Specification of New & Spent Fuel Storage Racks. V10‐N224‐000 PLUS7 Developed by KNF. April 2010.
3. Drawing. Spent Fuel Storage Racks Region I Details. D‐HC‐95200‐D02, Rev.1, Doosan, July 2009.
4. Modular Code System for Performing Standar-dized Computer Analyses for Licensing Evaluation for Workstations and Personal Computer. Oak Ridge National Laboratory.
5. MCNP ‐ A General Monte Carlo N‐Particle Transport Code, Version X. LA‐12625‐M, Los Alamos National Laboratory, 2003.
6. Neutron and Gamma‐ray Fluence‐to–Dose Rate Conversion Factor Approved by ICRP‐74. 1995.