ABSTRACT
Background: This study aimed to determine the prognostic role of the categorized
hemodynamic stage (HS) based on the hepatic venous pressure gradient (HVPG) in patients with portal hypertension.
Methods: Of 1,025 cirrhotic patients who underwent HVPG measurement, data on 572 non-critically-ill patients were collected retrospectively between 2008 and 2013. The following two HS categorizations were used: HS-1 (6–9, 10–12, 13–16, 17–20, and > 20 mmHg; designated as groups 1–5, respectively) and HS-2 (6–12, 13–20, and > 20 mmHg). Clinical characteristics, mortality rates, and prognostic predictors were analyzed according to the categorized HS. Results: During the mean follow-up period of 25 months, 86 (15.0%) patients died. The numbers of deaths in HS-1 groups were 7 (6.3%), 7 (6.9%), 30 (18.0%), 20 (15.6%), and 22 (34.4%), respectively (P < 0.001). However, the traditional HVPG cutoffs of 10 and 16 mmHg did not improve the discrimination of mortality. In contrast, the mortality rates did differ significantly between the three HS-2 groups (P < 0.05). In the multivariate analysis, all models revealed that HS-2 was a common prognostic factor in predicting mortality. The mortality rates increased significantly according to HS-2 in patients with hypoalbuminemia (HVPG, 13–20 mmHg; hazard ratio [HR], 2.54 and HVPG > 20 mmHg; HR, 5.45) and intermediate model for end-stage liver disease (MELD) score (HVPG, 13–20 mmHg; HR, 3.86 and HVPG > 20 mmHg; HR, 8.77; P < 0.05).
Conclusion: Categorizing HVPG values according to HS-2 is a useful prognostic modality in patients with portal hypertension and can play an independent role in predicting the prognosis in patients with hypoalbuminemia and an intermediate MELD score. Keywords: Cirrhosis; Hemodynamics; Portal Hypertension; Prognosis
Original Article
Received: May 7, 2019
Accepted: Jul 22, 2019
Address for Correspondence:
Jae Young Jang, MD, PhD
Department of Internal Medicine, Institute for Digestive Research, Digestive Disease Center, Soonchunhyang University College of Medicine, 59 Daesagwan-ro, Yongsan-gu, Seoul 04401, Korea.
E-mail: [email protected] Moon Young Kim, MD, PhD
Department of Internal Medicine, Yonsei University, Wonju College of Medicine, 20 Ilsan-ro, Wonju 26426, Republic of Korea. E-mail: [email protected] *Tae Yeob Kim and Ki Tae Suk contributed equally to this work.
© 2019 The Korean Academy of Medical Sciences.
This is an Open Access article distributed under the terms of the Creative Commons Attribution Non-Commercial License (https:// creativecommons.org/licenses/by-nc/4.0/) which permits unrestricted non-commercial use, distribution, and reproduction in any medium, provided the original work is properly cited.
ORCID iDs
Tae Yeob Kim
https://orcid.org/0000-0001-7978-5303 Ki Tae Suk
https://orcid.org/0000-0002-9206-9245 Soung Won Jeong
https://orcid.org/0000-0003-2855-6011 Tom Ryu
https://orcid.org/0000-0003-0027-0249
Tae Yeob Kim ,1* Ki Tae Suk ,2* Soung Won Jeong ,3 Tom Ryu ,3
Dong Joon Kim ,2 Soon Koo Baik ,4 Joo Hyun Sohn ,5 Woo Kyoung Jeong ,6
Eunhee Choi ,7 Jae Young Jang ,3 and Moon Young Kim 4
1Department of Internal Medicine, New Hope Internal Medicine Clinic, Seoul, Korea 2Department of Internal Medicine, Hallym University College of Medicine, Chuncheon, Korea 3 Department of Internal Medicine, Institute for Digestive Research, Digestive Disease Center,
Soonchunhyang University College of Medicine, Seoul, Korea
4Department of Internal Medicine, Yonsei University, Wonju College of Medicine, Wonju, Korea 5 Department of Internal Medicine, Hanyang University Guri Hospital, Hanyang University College of
Medicine, Guri, Korea
6 Department of Radiology, Samsung Medical Center, Sungkyunkwan University School of Medicine, Seoul,
Korea
7Institute of Lifestyle Medicine, Yonsei University Wonju College of Medicine, Wonju, Korea
The New Cutoff Value of the Hepatic
Venous Pressure Gradient on
Predicting Long-Term Survival in
Cirrhotic Patients
Gastroenterology &
Hepatology
Dong Joon Kim
https://orcid.org/0000-0002-5792-1500 Soon Koo Baik
https://orcid.org/0000-0001-6245-2537 Joo Hyun Sohn
https://orcid.org/0000-0002-8977-4509 Woo Kyoung Jeong
https://orcid.org/0000-0002-0676-2116 Eunhee Choi
https://orcid.org/0000-0002-3449-0672 Jae Young Jang
https://orcid.org/0000-0001-5335-752X Moon Young Kim
https://orcid.org/0000-0002-2501-2206
Funding
This study was supported by The Research Supporting Program of The Korean Association for the Study of the Liver and The Korean Liver Foundation (KASL KLF 2013-07).
Disclosure
The authors have no potential conflicts of interest to disclose.
Author Contributions
Conceptualization: Kim TY, Suk KT, Jang JY, Kim MY. Data curation: Jeong SW, Baik SK. Formal analysis: Choi E. Investigation; Jeong WK. Resources: Sohn JH. Visualization: Ryu T. Writing - original draft: Kim TY, Suk KT. Writing - review & editing: Kim DJ, Kim MY, Jang JY.
INTRODUCTION
The natural history of cirrhosis is related to elevated portal pressure.1 Portal hypertension (PHT) is a clinical syndrome characterized by a pathologically elevated portal perfusion gradient.2,3 Measuring the hepatic venous pressure gradient (HVPG) is safe and has been found to be useful in the diagnosis of PHT and for risk stratification, assessment of prognosis, monitoring of treatment, and identification of patients with hepatocellular carcinoma (HCC) who are candidates for liver resection.4-10 An HVPG of > 20 mmHg in acute variceal
hemorrhage is indicative of a high probability of 1-year mortality.11 The HVPG has been shown to have an independent role in survival in addition to the model for end-stage liver disease (MELD) score, with each 1-mmHg increase contributing to a 3% increase in mortality.9 A previous report suggested that specific stages within the classification of chronic liver disease can be associated with histological, clinical, hemodynamic, and biological stages.6,12,13 For example, a hemodynamic stage (HS) with HVPG ≥ 6 mmHg indicates PHT (stage 1), while HVPG ≥ 10 mmHg represents clinically significant PHT (stages 2–4).6,14,15 Previous reports have suggested that HS utilizing the HVPG score is closely associated with the clinical stage according to the presence of clinical complications.16,17 However, considering that there are various causes of cirrhosis, regional and gender differences, and dynamic disease progression such as acute-on-chronic liver failure, few studies have evaluated survival prediction according to clinical characteristics and HS using the HVPG score in patients with PHT.18
The present study investigated the current real-life setting in which patients with cirrhosis receive standard therapies for the different complications, with the aim of quantifying survival according to the HVPG grade and the prognostic value of HVPG grades and other prognostic factors.
METHODS
Patients
Between January 2008 and June 2013, 1,025 cirrhotic patients were consecutively collected at 4 academic hospitals. All of the patients had a previous histological confirmation of cirrhosis19 or a diagnosis of cirrhosis suspected on the basis of standard clinical,
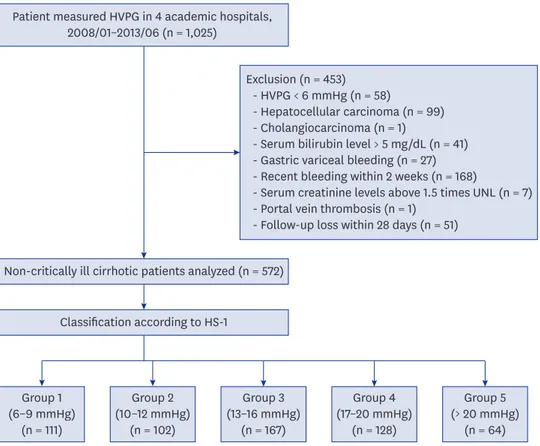
ultrasonographic, and biochemical parameters.20 All of the patients had stable hemodynamic parameters and were not active drinkers. Active drinkers were defined as patients who drink alcohol more than 140 grams/week (women), or 210 grams/week (men).21 HVPG measurements were used to establish the diagnosis of cirrhosis or to assess baseline portal pressure, prior to primary prophylaxis or secondary prophylaxis of variceal bleeding. The patients were enrolled after confirming the presence of an HVPG of ≥ 6 mmHg. The exclusion criteria were HVPG < 6 mmHg (58 patients), presence of HCC (99 patients) and cholangiocarcinoma (1 patient), gastric variceal bleeding (27 patients), acute decompensation state such as bilirubin levels > 5 mg/dL (41 patients) and recent esophageal variceal bleeding within 2 weeks (168 patients), serum creatinine levels > 1.5-fold the upper normal limit (7 patients), portal vein thrombosis (1 patient), and loss to follow-up within 28 days (51 patients). Gastric varices are not correlated with HVPG level and patients who have recent esophageal variceal bleeding could be critically ill patients. Finally, 572 non-critically-ill cirrhotic patients were analyzed (Fig. 1). Especially in case of alcohol related cirrhosis
patients, alcohol abstinence for at least 6 months prior to participating in this study were considered eligible for the study to avoid the influence of inflammation by recent alcohol consumption. The follow-up was performed up to December 31, 2013.
HVPG measurement
All vasoactive drugs were discontinued at least 72 hours before performing the hemodynamic assessments. The HVPG was measured by operators (hepatologists or interventional radiologists) who had previously performed > 100 HVPG measurements. Under fluoroscopic guidance, a 6-French balloon-tip catheter (Arrow International, Cleveland, OH, USA) was inserted into the right hepatic vein via the internal jugular vein. The free hepatic venous pressure was measured within 5 cm of the junction of the right hepatic vein and inferior vena cava. After balloon inflation, the examiner checked for the absence of a venovenous shunt, then measured the wedged hepatic venous pressure at the same location where the free hepatic venous pressure had been measured. Each measurement was repeated three times, with the results reported as mean values for these three measurements. The HVPG was determined by subtracting the free hepatic venous pressure from the wedged hepatic venous pressure.
HVPG subgroup, clinical stage, and MELD score
HS-1 was classified as follows according to HVPG grades based on previously reported cutoffs: group 1, 6–9 mmHg; group 2, 10–12 mmHg; group 3, 13–16 mmHg; group 4,
Patient measured HVPG in 4 academic hospitals, 2008/01–2013/06 (n = 1,025)
Non-critically ill cirrhotic patients analyzed (n = 572)
Exclusion (n = 453) - HVPG < 6 mmHg (n = 58)
- Hepatocellular carcinoma (n = 99) - Cholangiocarcinoma (n = 1)
- Serum bilirubin level > 5 mg/dL (n = 41) - Gastric variceal bleeding (n = 27) - Recent bleeding within 2 weeks (n = 168)
- Serum creatinine levels above 1.5 times UNL (n = 7) - Portal vein thrombosis (n = 1)
- Follow-up loss within 28 days (n = 51)
Classification according to HS-1 Group 1 (6–9 mmHg) (n = 111) Group 2 (10–12 mmHg) (n = 102) Group 3 (13–16 mmHg) (n = 167) Group 4 (17–20 mmHg) (n = 128) Group 5 (> 20 mmHg) (n = 64)
Fig. 1. Patient enrollment diagram. Clinical data of 1,025 cirrhotic patients with HVPG measurements were collected retrospectively between January 2008 and June 2013. After excluding 453 patients, 572 non-critically-ill cirrhotic patients were analyzed. The severity of HVPG was divided into the following five HS groups according to previously reported cutoffs: group 1, 6–9 mmHg; group 2, 10–12 mmHg; group 3, 13–16 mmHg; group 4, 17–20 mmHg; and group 5, > 20 mmHg. Clinical stages were defined according to the classification by D'Amico et al.14,17
17–20 mmHg; and group 5, > 20 mmHg.1 The following four clinical stages were defined according to the classification by D'Amico et al.14: stage 1, no ascites and varices; stage 2, esophageal varices without hemorrhage and no ascites; stage 3, ascites without a history of esophageal variceal hemorrhage; and stage 4, gastrointestinal bleeding with or without ascites. Decompensated cirrhosis was defined as stage 3 or 4. The MELD score was calculated for each patient on the day of HVPG measurement using the following equation22: 9.57 × loge (creatinine, mg/dL) + 3.78 × loge (bilirubin, mg/dL) + 11.2 × loge (prothrombin time, international normalized ratio) + 6.43.
The MELD-Na score was calculated as MELD score − sodium level − 0.025 × MELD score × (140 − sodium level) + 140.23 We defined cutoff MELD scores of 10 and 15 with reference to a previous study24 and the worldwide consensus for those patients who need to receive liver transplantation, thereby categorizing MELD scores into the following three groups: low, 6–9; intermediate, 10–15; and high, ≥ 16.
Statistical analysis
Statistical analyses and graphic production were performed with SPSS (version 18.0; SPSS, Chicago, IL, USA). Descriptive statistics were produced for the demographic, clinical, and laboratory characteristics of the study patient sample. Continuous and categorical variables were expressed as mean ± standard deviation (SD, range) and number (%) values, respectively. The patient characteristics were compared according to HS using the χ2 test and one-way analysis of variance with Scheffe's test. To evaluate mortality according to the Child-Pugh (CP) class, clinical stage, and HS, the Kaplan-Meier method with the log-rank test was used to calculate survival, with Bonferroni correction applied to P values according to the number of groups.
Based on the results of the survival analysis of our data, we simplified HS-1 into HS-2 as follows: group A, 6–12 mmHg; group B, 13–20 mmHg; and group C, > 20 mmHg. To assess the prognostic predictors of long-term mortality, variables including gender, age, use of beta-blockers, platelet count, albumin, bilirubin, prothrombin time, creatinine, sodium level, CP score, clinical stage, HS-2, MELD score, and MELD-Na score were used in Cox regression models to obtain hazard ratios (HRs) for independent predictive factors. Variables that were significant in the univariate variables were analyzed by stepwise Cox multivariate regression. For the subgroup analyses in the hypoalbuminemia and MELD groups, hypoalbuminemia was defined as a serum albumin level of ≤ 3.5 mg/dL, and MELD groups were divided into three groups. P values of < 0.05 were considered to be statistically significant.
Ethics statement
The Institutional Review Board (IRB) of the four academic hospitals approved the study (Soonchunhyang University Seoul Hospital IRB 2013-12-005). Written informed consent to participate in the study procedures was obtained from all of the included patients.
RESULTS
Baseline characteristics of patients
The baseline characteristics and the results of biochemical examinations are summarized in Table 1. The patients were aged 53.0 ± 9.7 years. The causes of liver cirrhosis were alcohol consumption in 344 (60.1%) patients, viral hepatitis in 157 (27.5%), viral hepatitis and
alcohol consumption in 38 (6.6%), and others in 33 (5.8%). There were 439 (76.8%) men patients, 105 (18.4%) at clinical stage 1, 173 (30.2%) at clinical stage 2, 253 (44.2%) at clinical stage 3, and 41 (7.2%) at clinical stage 4. The overall MELD score and HVPG were 10.3 ± 3.4 and 14.5 ± 5.2 mmHg, respectively (Table 1).
Patient characteristics according to the severity of PHT
The patient characteristics according to HS-1 are summarized in Table 2. Higher HVPG grades were associated with higher frequency of alcoholic liver disease, serum bilirubin levels, prothrombin time, and prognostic scores such as the CP score, MELD score, MELD-Na score, and decompensated stage, but lower platelet count, serum albumin, and serum sodium (all P < 0.001). The CP class and clinical stages were negatively correlated with the HVPG grade (Fig. 2A and B, respectively).
Cumulative survival according to CP class, clinical stage, and HVPG grade
During the follow-up period of 25 ± 18 months (range, 1–73 months), 86 (15.0%) patients died (Table 1). The causes of death were bleeding (n = 25, 29.1%), hepatic failure (n = 18, 20.9%), hepatorenal syndrome (n = 13, 15.1%), infection including spontaneous bacterial peritonitis (n = 10, 11.6%), hepatic encephalopathy (n = 9, 10.5%), HCC that developed from precancerous lesion such as liver cirrhosis (n = 2, 2.3%), intracranial hemorrhage (n = 5, Table 1. Clinical characteristics of enrolled patientsCharacteristics Values (n = 572)
Gender, men 439 (76.7)
Age, yr 53.0 ± 9.7 (25–78)
Cause of liver cirrhosis
Viral hepatitis 157 (27.5)
Alcohol 344 (60.1)
Mixed (virus + alcohol) 38 (6.6)
Others 33 (5.8) Use of beta-blocker 267 (46.7) Presence of ascites 272 (47.6) Platelet count, × 103/µL 117 ± 72 (20–562) Albumin, mg/dL 3.3 ± 0.6 (1.7–5.1) Bilirubin, mg/dL 1.6 ± 1.1 (0.1–5.0) AST, U/L 68 ± 76 (13–902) ALT, U/L 44 ± 86 (3–1,355)
Prothrombin time, INR 1.22 ± 0.26 (0.81–2.67) Creatinine, mg/dL 0.8 ± 0.2 (0.3–1.7) Sodium, mEq/L 139 ± 4 (118–148) CP class 7.0 ± 1.8 (5–13) A 263 (46.0) B 245 (42.8) C 64 (11.2) Clinical stage 1 105 (18.4) 2 173 (30.2) 3 253 (44.2) 4 41 (7.2) MELD score 10.3 ± 3.4 (6–23) MELD-Na score 11.6 ± 4.2 (6–27) HVPG, mmHg 14.5 ± 5.2 (6–43) Death 86 (15.0)
Follow-up duration, mon 25 ± 18 (1–73) Data are number (%) or mean ± standard deviation (range) values.
ALT = alanine aminotransferase, AST = aspartate aminotransferase, CP = Child-Pugh, HVPG = hepatic venous pressure gradient, INR = international normalized ratio, MELD = model for end-stage liver disease.
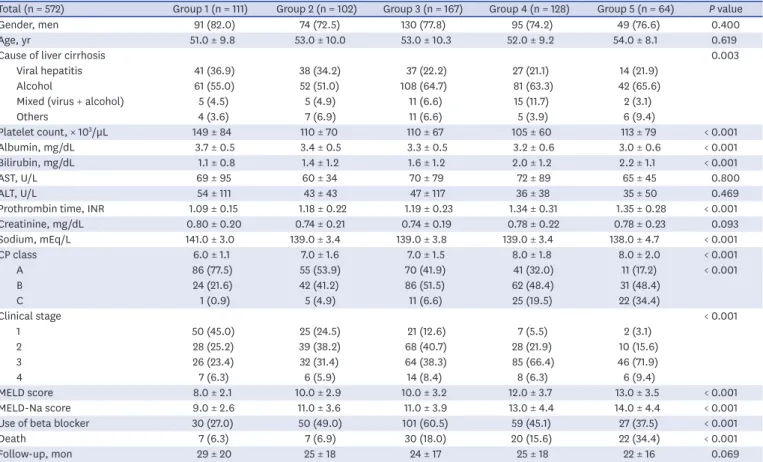
Table 2. Patient characteristics and prognostic stages according to HS-1 groups
Total (n = 572) Group 1 (n = 111) Group 2 (n = 102) Group 3 (n = 167) Group 4 (n = 128) Group 5 (n = 64) P value
Gender, men 91 (82.0) 74 (72.5) 130 (77.8) 95 (74.2) 49 (76.6) 0.400 Age, yr 51.0 ± 9.8 53.0 ± 10.0 53.0 ± 10.3 52.0 ± 9.2 54.0 ± 8.1 0.619
Cause of liver cirrhosis 0.003
Viral hepatitis 41 (36.9) 38 (34.2) 37 (22.2) 27 (21.1) 14 (21.9) Alcohol 61 (55.0) 52 (51.0) 108 (64.7) 81 (63.3) 42 (65.6) Mixed (virus + alcohol) 5 (4.5) 5 (4.9) 11 (6.6) 15 (11.7) 2 (3.1)
Others 4 (3.6) 7 (6.9) 11 (6.6) 5 (3.9) 6 (9.4) Platelet count, × 103/µL 149 ± 84 110 ± 70 110 ± 67 105 ± 60 113 ± 79 < 0.001 Albumin, mg/dL 3.7 ± 0.5 3.4 ± 0.5 3.3 ± 0.5 3.2 ± 0.6 3.0 ± 0.6 < 0.001 Bilirubin, mg/dL 1.1 ± 0.8 1.4 ± 1.2 1.6 ± 1.2 2.0 ± 1.2 2.2 ± 1.1 < 0.001 AST, U/L 69 ± 95 60 ± 34 70 ± 79 72 ± 89 65 ± 45 0.800 ALT, U/L 54 ± 111 43 ± 43 47 ± 117 36 ± 38 35 ± 50 0.469
Prothrombin time, INR 1.09 ± 0.15 1.18 ± 0.22 1.19 ± 0.23 1.34 ± 0.31 1.35 ± 0.28 < 0.001 Creatinine, mg/dL 0.80 ± 0.20 0.74 ± 0.21 0.74 ± 0.19 0.78 ± 0.22 0.78 ± 0.23 0.093 Sodium, mEq/L 141.0 ± 3.0 139.0 ± 3.4 139.0 ± 3.8 139.0 ± 3.4 138.0 ± 4.7 < 0.001 CP class 6.0 ± 1.1 7.0 ± 1.6 7.0 ± 1.5 8.0 ± 1.8 8.0 ± 2.0 < 0.001 A 86 (77.5) 55 (53.9) 70 (41.9) 41 (32.0) 11 (17.2) < 0.001 B 24 (21.6) 42 (41.2) 86 (51.5) 62 (48.4) 31 (48.4) C 1 (0.9) 5 (4.9) 11 (6.6) 25 (19.5) 22 (34.4) Clinical stage < 0.001 1 50 (45.0) 25 (24.5) 21 (12.6) 7 (5.5) 2 (3.1) 2 28 (25.2) 39 (38.2) 68 (40.7) 28 (21.9) 10 (15.6) 3 26 (23.4) 32 (31.4) 64 (38.3) 85 (66.4) 46 (71.9) 4 7 (6.3) 6 (5.9) 14 (8.4) 8 (6.3) 6 (9.4) MELD score 8.0 ± 2.1 10.0 ± 2.9 10.0 ± 3.2 12.0 ± 3.7 13.0 ± 3.5 < 0.001 MELD-Na score 9.0 ± 2.6 11.0 ± 3.6 11.0 ± 3.9 13.0 ± 4.4 14.0 ± 4.4 < 0.001 Use of beta blocker 30 (27.0) 50 (49.0) 101 (60.5) 59 (45.1) 27 (37.5) < 0.001
Death 7 (6.3) 7 (6.9) 30 (18.0) 20 (15.6) 22 (34.4) < 0.001
Follow-up, mon 29 ± 20 25 ± 18 24 ± 17 25 ± 18 22 ± 16 0.069
Data are number (%) or mean ± SD values. χ2 test and P trend or one-way analysis of variance as appropriate. Hemodynamic stage-1 (HS-1) groups 1–5 were defined as 6–9, 10–12, 13–16, 17–20, and > 20 mmHg, respectively.
ALT = alanine aminotransferase, AST = aspartate aminotransferase, CP = Child-Pugh, INR = international normalized ratio, MELD = model for end-stage liver disease.
A 0 6–9 mmHg 10–12 mmHg 13–16 mmHg 17–20 mmHg > 20 mmHg 100 40 60 80 20 % HVPG group P < 0.001 P < 0.001
CP A CP B CPC Stage 1 Stage 2 Stage 3 or 4
77.5 53.9 41.9 32.0 17.2 21.6 0.9 41.2 4.9 51.5 6.6 19.5 48.4 48.4 34.4 B 0 6–9 mmHg 10–12 mmHg 13–16 mmHg 17–20 mmHg > 20 mmHg 100 40 60 80 20 % HVPG group 45.0 24.5 12.6 5.5 3.1 25.2 29.7 38.2 37.3 40.7 46.7 72.7 21.9 15.6 81.3
Fig. 2. CP class and clinical stage according to HVPG groups in the enrolled patients. The HVPG group was negatively correlated with (A) CP class and (B) clinical stage.
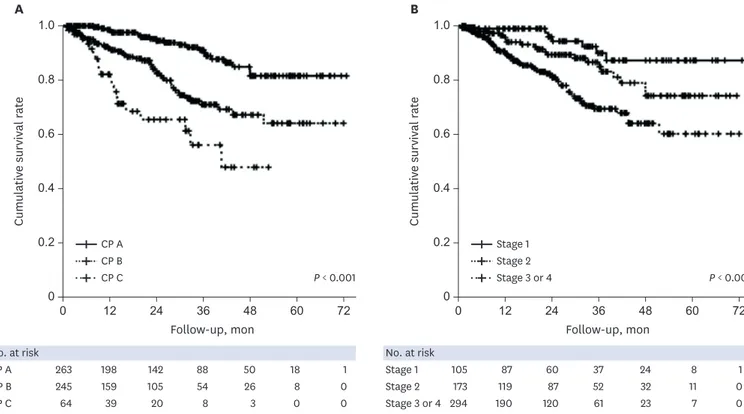
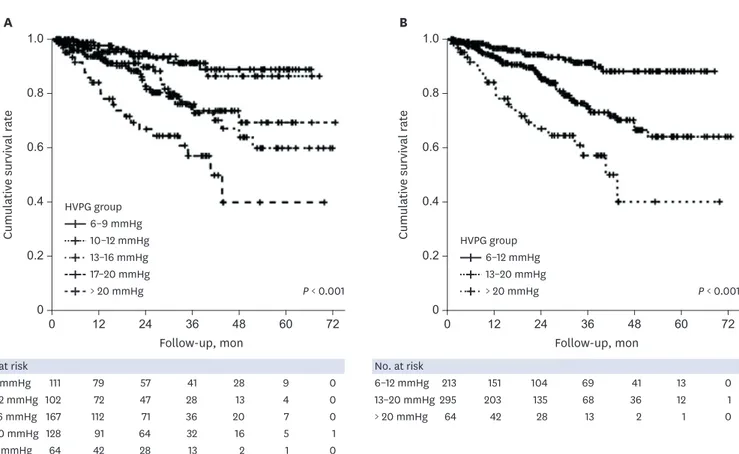
5.8%), and others (n= 4, 4.7%). Two patients underwent liver transplantation due to hepatic encephalopathy (10 months) and hepatic failure (20 months) and were counted as death. The mortality rates differed significantly between CP classes A, B, and C (all P < 0.017, log-rank test with Bonferroni correction) (Fig. 3A), but not between clinical stages 3 and 4 (Supplementary Fig. 1). However, the cumulative survival rate was significantly higher for both clinical stages 1 and 2 than for the decompensated stage (both P < 0.017) (Fig. 3B). The numbers of deaths in HS-1 groups 1–5 during the follow-up period were 7 (6.3%), 7 (6.9%), 30 (18.0%), 20 (15.6%), and 22 (34.4%), respectively (P < 0.001). The cumulative survival differed significantly between the following HS-1 groups: group 1 vs. group 3, group 1 vs. group 5, group 2 vs. group 5, and group 4 vs. group 5 (all P < 0.005, log-rank test with Bonferroni correction) (Fig. 4A). However, the use of the traditional HVPG cutoffs of 10 and 16 mmHg did not improve the discrimination of mortality. Dividing HS into the three groups for HS-2 (Supplementary Table 1) resulted in significant differences in the 1- and 3-year cumulative survival rates between HS-2 groups A, B, and C: 96.6% vs. 94.0% vs. 84.1% for the 1-year cumulative survival, respectively, and 91.4% vs. 75.3% vs. 57.1% for the 3-year cumulative survival (P < 0.017) (Fig. 4B).
Predictors of long-term mortality
In the univariate analysis for death, the presence of ascites, serum albumin, bilirubin, serum alanine aminotransferase, prothrombin time, sodium level, CP score, CP class, decompensated stage (clinical stage 3 or 4), HVPG 13–20 mmHg or > 20 mmHg, MELD score, and MELD-Na score were related to long-term mortality (all P < 0.05). The multivariate
0.8 1.0 0.2 0 0 12 24 36 48 60 72 0.6 0.4 Cumulativ e survival r at e Follow-up, mon 0.8 1.0 0.2 0 0 12 24 36 48 60 72 0.6 0.4 Cumulativ e survival r at e Follow-up, mon No. at risk 263 198 142 88 50 18 1 245 159 105 54 26 8 0 64 39 20 8 3 0 0 CP A CP B CP C A B No. at risk 105 87 60 37 24 8 1 173 119 87 52 32 11 0 294 190 120 61 23 7 0 Stage 1 Stage 2 Stage 3 or 4 CP A CP B CP C P < 0.001 Stage 1 Stage 2 Stage 3 or 4 P < 0.001
Fig. 3. Cumulative survival according to CP class and clinical stage. (A) The mortality rate differed significantly between CP classes A, B, and C (all P < 0.001, log-rank test). (B) The cumulative survival rate was significantly higher for both clinical stages 1 and 2 than for the decompensated stage (both P < 0.001, log-rank test). CP = Child-Pugh.
analysis used a Cox regression model that considered the serum albumin, serum sodium, CP class, and HS-2. Even when applying multiple models, the long-term mortality risk increased approximately two- and fourfold for HVPG 13–20 and > 20 mmHg, respectively (Table 3).
Survival analysis in the presence of hypoalbuminemia and MELD groups
According to Cox regression, albumin was an independent risk factor for predicting a poor long-term survival (Table 3). The mortality rates were significantly higher for HVPG = 13–20 mmHg (HR, 2.54; 95% confidence interval [CI], 1.28–5.06; P = 0.008) and HVPG > 20 mmHg (HR, 5.45; 95% CI, 2.55–11.62; P < 0.001) than for HVPG 6–12 mmHg in patients with hypoalbuminemia (Fig. 5A). In contrast, there were no significant differences in mortality rates between HVPG groups in patients without hypoalbuminemia (Supplementary Fig. 2). After dividing the patients into three MELD groups, the mortality rates in the intermediate-MELD-score group (score of 10–15) was significantly higher for HVPG 13–20 mmHg (HR, 3.86; 95% CI, 1.16–12.91; P = 0.028) and HVPG > 20 mmHg (HR, 8.77; 95% CI, 2.41–31.94; P = 0.001) than for HVPG 6–12 mmHg (Fig. 5B).0.8 1.0 0.2 0 0 12 24 36 48 60 72 0.6 0.4 Cumulativ e survival r at e Follow-up, mon 0.8 1.0 0.2 0 0 12 24 36 48 60 72 0.6 0.4 Cumulativ e survival r at e Follow-up, mon No. at risk 111 79 57 41 28 9 0 102 72 47 28 13 4 0 167 112 71 36 20 7 0 128 91 64 32 16 5 1 64 42 28 13 2 1 0 6–9 mmHg 10–12 mmHg 13–16 mmHg 17–20 mmHg A B > 20 mmHg No. at risk 213 151 104 69 41 13 0 295 203 135 68 36 12 1 64 42 28 13 2 1 0 6–12 mmHg 13–20 mmHg > 20 mmHg HVPG group 6–9 mmHg 10–12 mmHg 13–16 mmHg 17–20 mmHg > 20 mmHg P < 0.001 HVPG group 6–12 mmHg 13–20 mmHg > 20 mmHg P < 0.001
Fig. 4. Cumulative survival according to HVPG groups with hemodynamic stage-1 (HS-1) and HS-2. (A) The cumulative survival differed between following HS-1 groups: group 1 vs. 3, group 1 vs. 5, group 2 vs. 5, and group 4 vs. 5 (all P < 0.001, log-rank test). (B) However, the use of the traditional HVPG cutoffs of 10 and 16 mmHg did not improve the discrimination of mortality. Dividing HS into three groups for HS-2 (6–12, 13–20, and > 20 mmHg) resulted in significant differences in the 1- and 3-year cumulative survival rates: 96.6%, 94.0%, and 84.1% for the 1-year cumulative survival, respectively, and 91.4%, 75.3%, and 57.1% for the 3-year cumulative survival (P < 0.001, log-rank test).
DISCUSSION
This large-scale retrospective cohort study was designed to evaluate the natural course of various stages of non-critically-ill cirrhotic patients and the clinical implications of HVPG values on the long-term prognosis in real-life situations. Several previous Western studies have found the HVPG to be clinically significant in the prognosis of compensated and decompensated cirrhotic patients,1,9,14,25 but it had not been determined in a large population study whether this is also the case in Asians. The present study investigated the factors that influence the survival of cirrhotic patients and the clinical value of the HVPG in non-critically-ill Asian cirrhotic patients. We excluded patients in an active state related to hemodynamic instability, and measured the HVPG in the highly stable, non-critically-ill situation to reflect the real baseline PHT condition in each patient.
As we expected, the presence of compensation or decompensation exerted absolutely different effects on the prognosis. In the presence of compensation, survival was significantly better in patients without varices (stage 1) than in patients with varices (stage 2), but it did not differ between clinical stage 3 (ascites with/without variceal hemorrhage) and stage 4 (variceal hemorrhage with/without ascites). This finding is similar to recent Western data,26 and it suggests that primary treatment and secondary prophylaxis of variceal bleeding and antibiotics improve the outcome of variceal hemorrhage over a timescale of years, whereas the treatments applied to ascites have not changed or improved over a timescale of several decades. This finding is also consistent with the categorical HVPG stages (i.e., HS). As HS increases, the compositions of clinical stage 3 (ascites) also increase, while those of clinical Table 3. Cox regression analysis of variable factors and HVPG grades for mortality
Characteristics Univariate analysis Model 1 Model 2 Model 3 Model 4
HR (95%CI) P HR (95%CI) P HR (95%CI) P HR (95%CI) P HR (95%CI) P
Gender, men 1.33 (0.78–2.27) 0.288 Age, yr 1.01 (0.99–1.03) 0.475 Use of beta-blocker 1.49 (0.97–2.29) 0.066 Presence of ascites 2.52 (1.62–3.93) < 0.001 Platelet count, 104/mL 1.00 (0.96–1.03) 0.790 Albumin, 0.1 mg/dL 0.89 (0.86–0.93) < 0.001 0.92 (0.88–0.97) 0.001 0.93 (0.88–0.99) 0.003 0.93 (0.88–0.97) 0.002 Bilirubin, mg/dL 1.39 (1.18–1.64) <0.0001 AST, U/L 1.00 (0.99–1.00) 0.309 ALT, U/L 0.99 (0.99–1.00) 0.043 INR, 0.1 increase 1.11 (1.03–1.19) 0.004 Creatinine, 0.1 mg/dL 0.99 (0.90–1.10) 0.908 Sodium, mEq/L 0.88 (0.84–0.93) < 0.0001 0.94 (0.88–0.99) 0.022 0.93 (0.88–0.99) 0.014 0.93 (0.87–0.99) 0.018 CP class 1.37 (1.25–1.52) < 0.0001 A 1 1 B 2.87 (1.71–4.83) < 0.001 1.91 (1.11–3.30) 0.019 C 5.96 (3.22–11.06) < 0.001 2.94 (1.46–5.92) 0.003 Clinical stage 3/4 vs. 1/2 2.51 (1.60–3.95) < 0.001 HVPG, mmHg 1.09 (1.05–1.12) < 0.001 6–12 1 1 1 1 1 13–20 2.91 (1.61–5.27) < 0.001 2.10 (1.13–3.91) 0.019 2.16 (1.18–3.99) 0.014 2.19 (1.18–4.06) 0.013 2.07 (1.12–3.83) 0.021 > 20 6.48 (3.31–12.7) < 0.001 3.89 (1.88–8.06) < 0.001 3.70 (1.79–7.65) < 0.001 3.99 (1.92–8.28) < 0.001 3.87 (1.87–8.00) < 0.001 MELD score 1.12 (1.06–1.18) < 0.0001 MELD-Na score 1.12 (1.07–1.18) < 0.001
Model 1: including sex, age, use of beta-blocker, presence of ascites, albumin, bilirubin, ALT, INR, sodium level, and HVPG grade; Model 2: including sex, age, use of beta-blocker, ALT, sodium level, CP class, and HVPG grade; Model 3: including sex, age, use of beta-blocker, albumin, ALT, sodium level, clinical stage 3 or 4, MELD score, and HVPG grade; Model 4: including sex, age, use of beta-blocker, albumin, ALT, clinical stage 3 or 4, MELD-Na score, and HVPG grade
ALT = alanine aminotransferase, AST = aspartate aminotransferase, CI = confidence interval, CP = Child-Pugh, HR = hazard ratio, HVPG = hepatic venous pressure gradient, INR = international normalized ratio, MELD = model for end-stage liver disease.
stage 4 do not show any trend with HS. This finding is also consistent with previous data that not only PHT but also hepatic insufficiency and other factors such as infection and low-grade inflammation induced by bacterial translocation might be more important in decompensated cirrhosis.18 The HVPG therefore appears to have a greater prognostic meaning in
compensated cirrhosis than in decompensated cirrhosis.1
The present study also found that the traditional HVPG cutoffs of 10 and 16 mmHg did not produce an appropriate discriminative ability for the prognosis. Even though we measured the HVPG in a highly controlled state, hemodynamics can be affected by various factors throughout the lifetime. Therefore, adopting a single critical HVPG cutoff for various clinical situations and etiologies appears to be too strict and less reliable in real clinical practice; for example, the differences between CP scores of 6 and 7 or 9 and 10 are not weighted in a real clinical situation. The HVPG interval between 10 and 12 mmHg is also too narrow to distinguish between compensation with varices formation and decompensation with variceal hemorrhage.1 Applying the same HVPG cutoff to the risks of variceal hemorrhage and ascites development is also questionable given the differences in their developmental pathophysiologies.27 For these reasons, we applied categorical values of the HVPG severity as for the CP class. According to HS-2, each of HVPG groups A, B, and group C showed excellent discriminative ability for the long-term mortality in any models, including traditional prognostic factors (Table 3). This categorical model can be helpful for developing more reliable noninvasive surrogate markers for estimating the severity of PHT and the treatment response in future clinical practice.
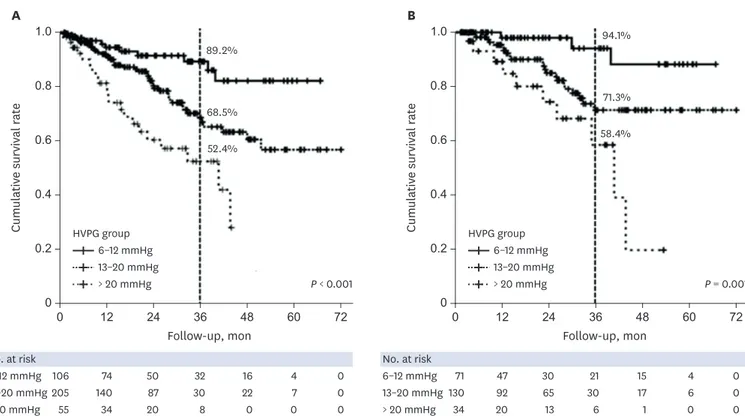
0.8 1.0 0.2 0 0 12 24 36 48 60 72 0.6 0.4 Cumulativ e survival r at e Follow-up, mon 0.8 1.0 0.2 0 0 12 24 36 48 60 72 0.6 0.4 Cumulativ e survival r at e Follow-up, mon No. at risk 106 74 50 32 16 4 0 205 140 87 30 22 7 0 55 34 20 8 0 0 0 A B No. at risk 71 47 30 21 15 4 0 130 92 65 30 17 6 0 34 20 13 6 1 0 0 P < 0.001 89.2% 68.5% 52.4% 94.1% 71.3% 58.4% P = 0.001 HVPG group 6–12 mmHg 13–20 mmHg > 20 mmHg HVPG group 6–12 mmHg 13–20 mmHg > 20 mmHg 6–12 mmHg 13–20 mmHg > 20 mmHg 6–12 mmHg 13–20 mmHg > 20 mmHg
Fig. 5. Cumulative survival according to patients with hypoalbuminemia and an intermediate MELD score. (A) The mortality rates was significantly higher for HVPG 13–20 mmHg (HR, 2.54; 95% CI, 1.28–5.06; P = 0.008) and HVPG > 20 mmHg (HR, 5.45; 95% CI, 2.55–11.62; P < 0.001) than for HVPG 6–12 mmHg in patients with hypoalbuminemia. (B) When we divided the MELD scores into three groups (6–9, 10–15, and ≥ 16), in the intermediate-MELD-score group (score of 10–15), the mortality rates was significantly higher for HVPG 13–20 mmHg (HR,3.86; 95% CI, 1.16–12.91; P = 0.028) and HVPG > 20 mmHg (HR, 8.77; 95% CI, 2.41–31.94;
P = 0.001) than for HVPG 6–12 mmHg.
An HVPG of 10 mmHg has been accepted as an absolute cutoff for clinically significant PHT in many previous studies, especially for the development of varices and the progression from compensated to decompensated cirrhosis. However, we did not use this cutoff of 10 mmHg in the present study for several reasons. First, an HVPG of 10 mmHg did not show prognostic value for long-term mortality in our cohort. An HVPG cutoff of 10 mmHg is based on varix development, and it is relatively low and therefore not appropriate for predicting the long-term mortality in cirrhotic patients. The recent decrease in variceal hemorrhage-related mortality and relative increases in the rates of death and acute decompensation related to ascites such as spontaneous bacterial peritonitis, refractory ascites, or hepatorenal syndrome have also increased the need to increase the HVPG cutoff.
Comparing the usefulness of the HVPG and MELD score for determining the long-term prognosis in cirrhotic patients is controversial.26,28 The advantage of the HVPG over the CP or MELD score in predicting prognosis is that it reflects PHT and the hemodynamic component directly, and hence the HVPG has been accepted as the most important predictive parameter especially in compensated cirrhosis.14 In contrast, the prognostic ability of HVPG in decompensated cirrhosis is more controversial because, as mentioned above, extrahemodynamic factors such as hepatic insufficiency and cardiorenal insufficiency have greater influences on the prognosis, and so the MELD or MELD-Na score has been accepted as a more reliable index in this phase. However, combining the use of the HVPG and the MELD/MELD-Na score has been considered to not improve the prognostic accuracy.9 In general, a MELD score of > 15 is accepted as indicating the need for liver transplantation, but the clinical meaning of an intermediate MELD score (10–15) is not clear, and there have been difficulties in predicting the prognosis and making clinical decisions in this group.
In the present study, the new categorical staging of HS-2 showed an additional discriminative ability in this intermediate-MELD-score group, with the 3-year survival rates for HVPG 13–20 and > 20 mmHg being only 71% and 58%, respectively. This finding suggests that additional information about the HVPG stages can be helpful for identifying patients in the intermediate-MELD-score group who should be considered for early liver transplantation. Additionally, the new HS-2 staging was also helpful in discriminating patients with hypoalbuminemia at risk of early mortality. The combination of the MELD score and HVPG also showed additive prognostic values in the low- and high-MELD-score groups in this study. Patients with an HVPG of > 12 mmHg in the low-MELD-score group (MELD score < 10) and those with an HVPG of > 20 mmHg in the high-MELD-score group (MELD score > 15) also exhibited a trend for poor prognoses (Supplementary Fig. 3).
This study was subject to some limitations: 1) the data were collected retrospectively, and the effects of medical treatment such as antiviral therapies could not be analyzed although the proportion of patients who received this treatment was small; 2) only survival data were collected and we did not analyze the development of new acute decompensation during the follow-up; 3) the HVPG was measured by a different operator in each institute and we were unable to calculate the interoperator variability; however, all operators were experts who had sufficient experience in this field and 4) the new HS-2 standard is validated in only specific cohorts and it could not be applied to all the cirrhotic patients. And finally, this study is cross-sectional and only one-time point of HVPG was measured. Therefore, this study could not analyze the prospective effect of other prognostic factors such as ingrowing bacterial translocation as well as treatment of cirrhosis etiology or non-selective beta blocker application as time goes by.
In conclusion, the present study has validated the natural course of cirrhosis and the role of the HVPG in a large Asian population cohort. The presence of compensation or decompensation of cirrhosis showed absolutely different prognoses; however, the stratification of decompensation according to the presence of variceal hemorrhage or ascites was not appropriate for discriminating the prognosis. The new categorized HS staging showed a good prognostic predictive ability, with indeed the combination of the MELD score and HS-2 in the intermediate-MELD-score population providing significant improvements in the prediction of prognosis. These findings suggest that this categorical HS can be helpful in estimating the severity of PHT and treatment responses on the basis of real clinical practice.
SUPPLEMENTARY MATERIALS
Supplementary Table 1
Patient characteristics and prognostic stages according to HS-2 Click here to view
Supplementary Fig. 1
Cumulative survival rate according to each clinical stage based on the severity of portal
hypertension. The cumulative survival rates differed significantly with clinical stage (P < 0.001). However, the mortality rate did not differ significantly between clinical stages 3 and 4.
Click here to view
Supplementary Fig. 2
Cumulative survival rate according to hemodynamic stage-2 (HS-2) groups in patients without hypoalbuminemia. The cumulative survival rate did not differ significantly between the HVPG groups in patients without hypoalbuminemia.
Click here to view
Supplementary Fig. 3
Cumulative survival rate according to HS-2 groups in patients with low MELD scores and high MELD scores. Combining the MELD score and HVPG also showed an additive prognostic value in the groups with (A, B) low and (C, D) high MELD scores in this study. (B) Patients with an HVPG of > 12 mmHg in the low-MELD-score group (MELD score < 10) and (D) patients with an HVPG of > 20 mmHg in the high-MELD-score group (MELD score > 15) also presented a trend for poor prognoses.
Click here to view
REFERENCES
1. Albilllos A, Garcia-Tsao G. Classification of cirrhosis: the clinical use of HVPG measurements. Dis Markers
2011;31(3):121-8.
PUBMED | CROSSREF
2. Rockey DC. A new treatment for portal hypertension? Gastroenterology 2016;150(5):1077-80.
3. Abraldes JG, Araujo IK, Turón F, Berzigotti A. Diagnosing and monitoring cirrhosis: Liver biopsy, hepatic venous pressure gradient and elastography. Gastroenterol Hepatol 2012;35(7):488-95.
PUBMED | CROSSREF
4. Ripoll C, Groszmann RJ, Garcia-Tsao G, Bosch J, Grace N, Burroughs A, et al. Hepatic venous pressure gradient predicts development of hepatocellular carcinoma independently of severity of cirrhosis. J Hepatol 2009;50(5):923-8.
PUBMED | CROSSREF
5. Suk KT. Hepatic venous pressure gradient: clinical use in chronic liver disease. Clin Mol Hepatol
2014;20(1):6-14.
PUBMED | CROSSREF
6. Garcia-Tsao G, Friedman S, Iredale J, Pinzani M. Now there are many (stages) where before there was one: In search of a pathophysiological classification of cirrhosis. Hepatology 2010;51(4):1445-9.
PUBMED | CROSSREF
7. Gluud C, Henriksen JH, Nielsen G. Prognostic indicators in alcoholic cirrhotic men. Hepatology
1988;8(2):222-7.
PUBMED | CROSSREF
8. Merkel C, Bolognesi M, Bellon S, Zuin R, Noventa F, Finucci G, et al. Prognostic usefulness of hepatic vein catheterization in patients with cirrhosis and esophageal varices. Gastroenterology 1992;102(3):973-9.
PUBMED | CROSSREF
9. Ripoll C, Bañares R, Rincón D, Catalina MV, Lo Iacono O, Salcedo M, et al. Influence of hepatic venous pressure gradient on the prediction of survival of patients with cirrhosis in the MELD Era. Hepatology
2005;42(4):793-801.
PUBMED | CROSSREF
10. Zhong JH, Mo HY, Li LQ. Hepatic venous pressure gradient for preoperative assessment of patients with resectable hepatocellular carcinoma: a comment for moving forward. J Hepatol 2016;65(1):230-1.
PUBMED | CROSSREF
11. Moitinho E, Escorsell A, Bandi JC, Salmerón JM, García-Pagán JC, Rodés J, et al. Prognostic value of early measurements of portal pressure in acute variceal bleeding. Gastroenterology 1999;117(3):626-31.
PUBMED | CROSSREF
12. Procopeţ B, Tantau M, Bureau C. Are there any alternative methods to hepatic venous pressure gradient in portal hypertension assessment? J Gastrointestin Liver Dis 2013;22(1):73-8.
PUBMED
13. Merkel C, Montagnese S. Hepatic venous pressure gradient measurement in clinical hepatology. Dig Liver Dis 2011;43(10):762-7.
PUBMED | CROSSREF
14. D'Amico G, Garcia-Tsao G, Pagliaro L. Natural history and prognostic indicators of survival in cirrhosis: a systematic review of 118 studies. J Hepatol 2006;44(1):217-31.
PUBMED | CROSSREF
15. Burroughs AK, Groszmann R, Bosch J, Grace N, Garcia-Tsao G, Patch D, et al. Assessment of therapeutic benefit of antiviral therapy in chronic hepatitis C: is hepatic venous pressure gradient a better end point?
Gut 2002;50(3):425-7.
PUBMED | CROSSREF
16. Suk KT, Kim EJ, Kim DJ, Kim HS, Bang CS, Park TY, et al. Prognostic significance of hemodynamic and clinical stages in the prediction of hepatocellular carcinoma. J Clin Gastroenterol 2017.51(3):285-93.
PUBMED | CROSSREF
17. D'Amico G, Pasta L, Morabito A, D'Amico M, Caltagirone M, Malizia G, et al. Competing risks and prognostic stages of cirrhosis: a 25-year inception cohort study of 494 patients. Aliment Pharmacol Ther
2014;39(10):1180-93.
PUBMED | CROSSREF
18. Moreau R. Acute-on-chronic liver failure: a new syndrome in cirrhosis. Clin Mol Hepatol 2016;22(1):1-6.
PUBMED | CROSSREF
19. The French METAVIR Cooperative Study Group, Bedossa P. Intraobserver and interobserver variations in liver biopsy interpretation in patients with chronic hepatitis C. Hepatology 1994;20(1 Pt 1):15-20.
PUBMED | CROSSREF
20. Suk KT, Baik SK, Yoon JH, Cheong JY, Paik YH, Lee CH, et al. Revision and update on clinical practice guideline for liver cirrhosis. Korean J Hepatol 2012;18(1):1-21.
PUBMED | CROSSREF
21. Devaux M, Sassi F. OECD Health Working Paper No. 79. Alcohol Consumption and Harmful Drinking: Trends and Social Disparities across OECD Countries. Paris: Organisation for Economic Co-operation and Development; 2015.
22. Kamath PS, Kim WR; Advanced Liver Disease Study Group. The model for end-stage liver disease (MELD). Hepatology 2007;45(3):797-805.
PUBMED | CROSSREF
23. Kim WR, Biggins SW, Kremers WK, Wiesner RH, Kamath PS, Benson JT, et al. Hyponatremia and mortality among patients on the liver-transplant waiting list. N Engl J Med 2008;359(10):1018-26.
PUBMED | CROSSREF
24. Ampuero J, Simón M, Montoliú C, Jover R, Serra MÁ, Córdoba J, et al. Minimal hepatic encephalopathy and critical flicker frequency are associated with survival of patients with cirrhosis. Gastroenterology
2015;149(6):1483-9.
PUBMED | CROSSREF
25. Ripoll C, Groszmann R, Garcia-Tsao G, Grace N, Burroughs A, Planas R, et al. Hepatic venous pressure gradient predicts clinical decompensation in patients with compensated cirrhosis. Gastroenterology
2007;133(2):481-8.
PUBMED | CROSSREF
26. Zipprich A, Garcia-Tsao G, Rogowski S, Fleig WE, Seufferlein T, Dollinger MM. Prognostic indicators of survival in patients with compensated and decompensated cirrhosis. Liver Int 2012;32(9):1407-14.
PUBMED | CROSSREF
27. Hernández-Gea V, Aracil C, Colomo A, Garupera I, Poca M, Torras X, et al. Development of ascites in compensated cirrhosis with severe portal hypertension treated with β-blockers. Am J Gastroenterol
2012;107(3):418-27.
PUBMED | CROSSREF
28. Suk KT, Kim CH, Park SH, Sung HT, Choi JY, Han KH, et al. Comparison of hepatic venous pressure gradient and two models of end-stage liver disease for predicting the survival in patients with decompensated liver cirrhosis. J Clin Gastroenterol 2012;46(10):880-6.