DESIGN OF THE CEMENT DEEP MIXING FOUNDATION FOR THE BUSAN-GEOJE
IMMERSED TUNNEL
YONG-IL KIMi)
ABSTRACT
The GK immersed tunnel as a part of the Busan-Geoje Fixed Link Project, introduced the immersed tunnel method into Korea for the first time. This challeging project to be completed in 2010 will open a new era to link oceans of the world with optimized design and safety for future use. The immersed tunnel method would possibly suitable for use in construction of a sub sea tunnel from Korea to Japan and from Korea to China that could potentially be built in the distant future. We hope the techniques learned from the Busan-Geoje Fixed Link Project can be applied to further projects in the near future.
Key Words : Immersed tunnel, optimized design
1 INSTRUCTIONS
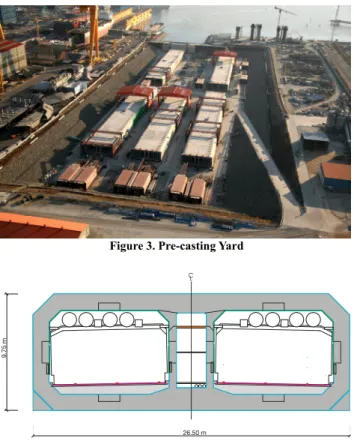
The Busan-Geoje Fixed Link is an 8.2km long motorway connecting Busan, Korea’s southernmost and second largest city, to the island of Geoje where the Korean big two shipbuilding yard locate on with two normal traffic lanes in each direction. This motorway includes a 3,300m immersed tunnel which is one of the longest immersed tunnel in the world and two cable-stayed bridges each of 2km in length. The immersed tunnel consist of 18 elements and each element is approximately 180m long. The standard tunnel elements E1 to E16 have exterior dimensions of 26.46m width and 9,97m height. The width of element 17 to 18 increased to 28.46m because of climbing lane. This tunnel elements are prefabricated of reinforced concrete in a temporary dry dock and are towed to the site and lowered into final position in a dredged trench and are placed on a screeded gravel bed directly without temporary support.
The site locates in an exposed offshore, which is subjected to strong winds, large swell waves and strong tidal currents. These conditions together with the tunnel being at a deepest immersed tunnel ever built and the foundation condition is consisting of a very soft, normally to slightly over-consolidated marine clay, makes the project unique and one of the most challenging immersed tunnels ever built. Due to these conditions, there is no choice but to have very strict accuracy for operations such as trench dredging, gravel bedding and backfilling works that could induce differential settlement.
Several special methods are develoved and applied to overcome the difficult conditions mentioned above. New accurate gravel bedding equipment developed for this project and deep mixing method applied to improve
the soft marine clay are presented in the following paper as part of the foundation of immersed tunnel.
Design conditions are also presented before presenting the each special method in the following paper to help the reader accurately understand the site conditions of the Busan-Geoje Fixed Link Project.
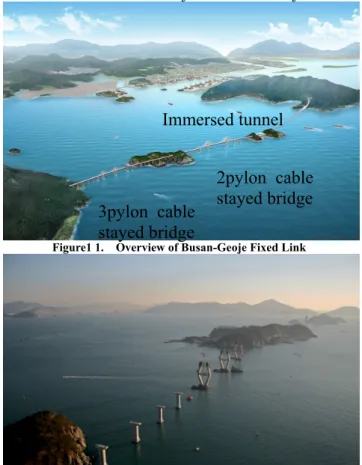
Figure1 1. Overview of Busan-Geoje Fixed Link
Figure 2. Aerial photograph of the link under construction
I) Daewoo E&C, Seoul, South Korea.
Immersed tunnel
3pylon cable
stayed bridge
2pylon cable
stayed bridge
Figure 3. Pre-casting Yard
Figure 4. Typical cross section of immersed tunnel
2 DESIGN CONDITION
Below the main effects governing the design of this particular immersed tunnel have been listed.
2.1 Hydraulic pressure
The deepest foundation point of the tunnel is 47m below mean sea level. The water pressure imposes a significant load on the tunnel elements, in particular in the transverse direction. A number of other effects add to the water pressure on the tunnel as can be seen below. The total characteristic pressure can reach an equivalent of 58m water pressure for certain conditions. An increase in the mean sea level of 0.4m has been included due to the global warming.
2.2 Wave and current
Most waves at the project area are generated by winds in the area including tropical storms and typhoons. Waves generated by distant storms can also reach the tunnel alignment from southerly directions: these are called swell waves and are not associated with winds in the area. A number of typhoon pass through the project area located in the southern coast of Korea every year. The impact on the structures and artificial islands of the project from typhoon is potentially severe because the link lies in exposed offshore.
The deep water wave height generated by typhoon
and swell waves can reach 9.2m for a 10,000 year return period.
Result from the numerical wave modelling show that the significant wave height is about 0.4 m and 0.8m at the most exposed location along the tunnel alignment.
Tidal range varies between 0.8m and 1.6m. The maximum near surface current spring tide is about 0.8m/sec, reducing with depth to 0.6m/sec at near bottom. The predominant current direction is perpendicular to the tunnel alignment.
2.3 Earth quake
Author's affiliation should be written in a lower margin of the first page in 9pt Roman.
The Busan metropolitan area is classified as a seismic zone I based on the result of seismic hazard analysis as specified in the Korean Standard Specification of Highway Bridges. Therefore, in this area the corresponding seismic zone coefficient for a 500 year return period is as noted in below Table 1.
Seismic Zone I
Zone Coefficient 0.11
Table 1. Seismic Zone Coefficient
The risk coefficients representing the ratio of effective peak ground are listed in the following Table 2.
Return Period(year) 500 1000
Zone Coefficient 1 1.4
Table 2. Risk coefficient
The acceleration coefficient (A) of ground motion in the site is calculated by multiplying seismic zone coefficient by risk coefficient.
2.4 Ship impact
The Southern coastline of Korea has a large volume of sea going traffic including containerships, gas and oil tankers. Militarily it is an important and strategic area. Overall design of the Busan-Geoje Fixed Link Project considered loadings from impact and sinking of a 50,000 ton vessel sailing to a neighbouring port. A particular safety feature is that the minimum clearance from sea level to the top of tunnel’s rock protection is more than 20m, which is well in excess of the 15m maximum draft of a 50,000 ton vessel.
3 GROUND CONDITION 3.1 Ground investigation
The available ground ivestigation had been carried out in design stages by 2004 as below summarized table .
Year Company
1997 Boreholes: 6 Daewoo Corporation Boreholes: 4 2000 CPTs: 10 Dong-A Geological Engineering Co. 2002 Seismic
survey Korea Ocean Research & Development Institute
2003
Seismic Survey
Dong A University, Ocean Resources and Research institute
2003 Bathymetry Daewoo E&C Boreholes: 33 2003 CPTs: 20 Dong A Geological Engineering Co. Boreholes: 3 2004 CPTs: 30 Fugro International 2004 Boreholes: 2 Dong A Consultants 2004 Boreholes: 2 Dong A Geological
Engineering
Table. 3 Summary of the investigation 3.2 Marine clay
Marine clay is forming the sea bed along the immersed tunnel alignment except in the near shore areas where outcrops of bedrock are found. The thickness of the marine clay exceeds 20m along most of the immersed tunnel alignment. Most of the immersed tunnel will consequently be founded in this layer.
The marine clay comprises soft structured clays. These clays have been deposited during the Holocene epoch. Other structured clays originating from the Nakdong river in the Busan area.
3.2.1 Moisture content and unit weight
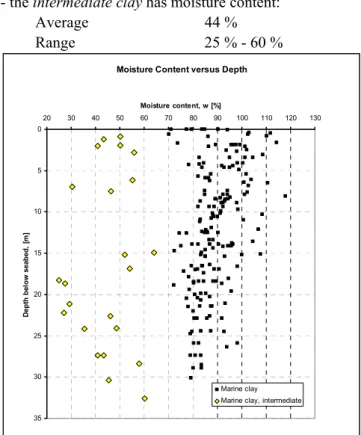
The measured moistrure content have been plotted against depth, see figure
Figure 5-1 and Figure 5-2 clearly shows the two groups of marine clay the marine clay and the intermediate marine clay.
- the marine clay has moisture content
Average 89 %
Range 70 % - 118 %
- the intermediate clay has moisture content:
Average 44 %
Range 25 % - 60 %
Moisture Content versus Depth
0 5 10 15 20 25 30 35 20 30 40 50 60 70 80 90 100 110 120 130 Moisture content, w [%] D ept h be lo w se ab ed , [ m ] Marine clay Marine clay, intermediate
Feature 5-1. Marine clay moisture content versus depth
Moisture Content versus station
20 30 40 50 60 70 80 90 100 110 120 4500 5000 5500 6000 6500 7000 7500 8000 8500 Station, [m] M o is tu re c o n te n t, w [ % ] Marine clay Marine clay, intermediate
Feature 5-2. Marine clay moisture content versus station
The specific gravity of soil solids, Gs, for the clay
has been determined as:
- the marine clay
Average
2.69
- the intermediate clay
Average
2.69
Range
2.67 - 2.73
Systematic variations in the specific gravity of soil solids are not seen, neither horizontally, nor vertically. Using a unit weight of fresh water, γwfresh = ρwfresh × g =
1.000 Mg/m3 × 9.816 m/sec2 = 9.816 kN/m3, the
following unit weight of marine clay solids is concluded:
A unit weight of solids, γs = Gs × γwfresh = 2.69 × 9.816
kN/m3 = 26.4 kN/m3, is considered representative for the entire marine clay package.
Saturated total unit weights, γsat, have been plotted
in Figure 5-3, as derived from measurements of moisture content, w, specific gravity of solids, Gs, and
assuming γwfresh = 9.816 kN/m3 and S = 100%
saturation.
(
)
s fresh w s sat wG w G + + γ = γ 1 1This corresponds to an average saturated unit weight for the marine clay of γsat = 14.7 kN/m3.
A slight linear increase of the unit weight with depth below sea bed appears from Figure 5-3, γsat = 0.02 kN/m4
d +14.44 kN/m3. This would be expected from the
depositional history of the clay, where layers between 5 m and 20 m of depth are more than 3000 years old, while the deeper layers at more than 20 m depth are about 9-12000 years old.
Saturated Unit Weight versus Depth
0 5 10 15 20 25 30 35 13 14 15 16 17 18 19 20
Saturated Unit Weight, γsat [kN/m3]
D ept h be lo w s ea b ed , [ m ] Marine clay Marine clay, intermediate
Feature 5-3 Marine clay saturated unit weight versus deptj
3.2.2 Marine clay – Plasticity properties
The major part of the marine clay, from seabed down, is "very soft to soft" and of "very high plasticity" to "extremely high plasticity". A lower part of the clay is of "high plasticity" (only) and appears to possess slightly better geotechnical properties. This part is termed intermediate marine clay.
Results of Atterberg limit tests have been plotted in the Casagrande plasticity chart, Figure 5-4 in which the "CL-ML" transition zone for 4% < Ip < 7% is taken
from ASTM D 2487. The results are seen to fall along a line parallel to and above the A-line, indicating inorganic clayey material. Further, the results appear to fall in two groups:
•
The major part of the marine clay data points are found in the upper right corner, indicating "clay of very high to extremely high plasticity".•
A minor part of the clay, representing intermediatemarine clay plots in the central region of the chart,
indicating "clay of intermediate to high plasticity". Casagrande Plasticity Chart
0 10 20 30 40 50 60 70 80 90 0 10 20 30 40 50 60 70 80 90 100 110 120 wL [%] I p [% ]
Busan-Geoje Tunnel: Marine Clay Busan-Geoje Tunnel: Marine Clay, intermediate Busan-Geoje Tunnel: Marine Clay (Fall cone - SGC)
CL CL-ML ML CI CH CV MI MH A-line: Ip = 0.73(wL-20)
ME: Silt of extremely high plasticity MV: Silt of very high plasticity MH: Silt of high plasticity MI: Silt of intermediate plasticity ML: Silt of low plasticity
CE: Clay of extremely high plasticity CV: Clay of very high plasticity CH: Clay of high plasticity CM: Clay of intermediate plasticity CL: Clay of low plasticity
U-line: Ip = 0.9(wL-8)
MV
ME CE
Letter "O" to be added to any letter symbol for any soil containing a significant proportion of organic matter
Feature 5-4 Casagrande plasticity chart, marine clay
3.2.3 Marine clay – Deformation properties
We derived values of
– the compression index, Cc, modified to field
value
– the recompression index, Crc
We derived primary compression index, Cc,
modified to field value, as well as the recompression index, Crc, have been plotted versus stationing in Figure
6-1 and versus depth in Figure 6-2, for both marine clay and intermediate marine clay
Primary compression index, Cc, and recompression index, Crc 0 0.2 0.4 0.6 0.8 1 1.2 1.4 1.6 1.8 2 4500 5000 5500 6000 6500 7000 7500 8000 8500 Station [m] Cc an d C rc [-] Cc: Marine clay Cc: Marine clay, intermediate Crc: Marine clay Crc: Marine clay, intermediate
Feature 6-1 Marine clay primary compression index Cc and
recompression index Crc versus stations
Primary compression index, Cc, and recompression index, Crc
0 5 10 15 20 25 30 35 0 0.1 0.2 0.3 0.4 0.5 0.6 0.7 0.8 0.9 1 1.1 1.2 1.3 1.4 1.5 1.6 1.7 1.8 1.9 2 Cc and Crc [-] D ep th be lo w s ea b ed , [ m ] Cc: Marine clay Cc: Marine clay, intermediate Crc: Marine clay Crc: Marine clay, intermediate
Feature 6-2 Marine clay primary compression index Cc and
recompression index Crc versus depth
It is apparent that the Cc values vary considerably.
No trend with depth or alignment stationing has been identified.
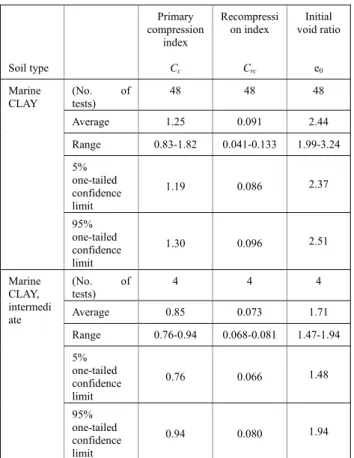
Averages, ranges and 5% and 95% one-tailed confidence limits of derived values for primary compression index (Cc), recompression index (Crc) and
initial void ratio (e0) are given in Table 4.
Primary compression index Recompressi on index Initial void ratio Soil type Cc Crc e0 (No. of tests) 48 48 48 Average 1.25 0.091 2.44 Range 0.83-1.82 0.041-0.133 1.99-3.24 5% one-tailed confidence limit 1.19 0.086 2.37 Marine CLAY 95% one-tailed confidence limit 1.30 0.096 2.51 (No. of tests) 4 4 4 Average 0.85 0.073 1.71 Range 0.76-0.94 0.068-0.081 1.47-1.94 5% one-tailed confidence limit 0.76 0.066 1.48 Marine CLAY, intermedi ate 95% one-tailed confidence limit 0.94 0.080 1.94
Table 4 Averages, ranges, 5% and 95% one-tailed confidence limit of derived values for primary compression index, recompression index and initial void ratio
COWI-DEC has received oedometer time curves for 39 oedmeter tests, all axially drained. The 39 tests include the tests carried out by SGC in 2004, Ref. /15/.
For all time curves with a suitable S-shape, i.e. all time curves showing primary compression, COWI-DEC has evaluated the following 3 properties: – Vertical hydraulic conductivity, k.
– Coefficient of consolidation, cv.
– Secondary compression index, Cα.
Graphs with plots of derived k, cv and Cα and
interpreted averages appear in Figure 6-3 and Figure 6-4.
As expected, the vertical hydraulic conductivity, kv,
decreases with the mean consolidation stress, as the clay compresses.
The coefficient of consolidation for the marine clay exhibit a significant scatter. The characteristic value, for the project relevant loading, has been assessed based an evaluation of the log time curves to be:
This is considered to be reasonable estimate of the field value, taking into account that the laboratory derived values usually underestimates the field value due to scale, anisotropy and other effects.
Vertical hydraulic conductivity, kv, versus consolidation stress
1.0E-11 1.0E-10 1.0E-09 1.0E-08
10 100 1000
Mean consolidation stress [kN/m2]
V e rt ic al hyd ra u lic co ndu ctivit y, kv [m/ sec] DONG A tests SGC tests
Feature 6-3 Marine clay. Vertical hydraulic conductivity, k, as function of the mean consolidation stress
Coefficient of consolidation, cv, versus consolidation stress
1.E-09 1.E-08 1.E-07 1.E-06 1.E-05 10 100 1000
Mean consolidation stress [kN/m2]
C o ef ficient of con soli d at ion , cv [m
2/sec] DONG A testsSGC tests
Geometric Mean
Feature 6-4 Marine clay. Coefficient of consolidation, cv, as function of the mean consolidation stress
3.2.4 Marine clay – Strength properties
The following test types for determination of the shear strength of the marine clay have been employed during the ground investigations:
– field vane tests, FVT – cone penetration tests, CPT – standard penetration tests, SPT – torvane laboratory tests; TVL
unconsolidated undrained (UU) triaxial tests, and consolidated undrained (CU) triaxial tests with pore pressure measurements
The field vane tests have been disregarded from the evaluations as they were not carried out in compliance with the test standard and based on inspections of the equipment used, they are considered unreliable. The torvane tests and the UU triaxial tests are index tests and thus cannot be used for the derivation of the undrained strength. Thus the undrained shear strength has been assessed using a combination of the CPTU tests (providing continuous profiles through the marine clay) and the CIU and CAU triaxial tests.
The CPTU tests show that the clay is slightly
overconsolidated and that the shape of the tip resistance versus depth curves merited use of the SHANSEP approach to describe the influence from the overconsolidation ratio.
The CIU tests with high initial consolidation stresses (i.e. with certainty normally consolidated) indicate a value of (cu/σ'0)nc = 0.28-0.30.
c/p ratio versus consolidaion stress
0.0 0.1 0.2 0.3 0.4 0.5 0.6 0.7 0.8 0.9 0 50 100 150 200 250 300 350
Consolidation stress (σ'3 cons) [kPa]
(cu /σ 'vo ) (1 %/ h ) (C A U ) (N C ) Normal consolidated Over consolidated
Feature 7-1 (cu/σ'0) ratio versus Consolidation stress for CIU tests The data from all the CPTU tests were subsequently critically re-analysed, and it was found that an overall best fit, assuming a value of Nkt =13 corresponded to
(cu/σ'0)nc = 0.28. The results from the CIU tests are
shown in Figure 7-1 which indicates the (cu/σ'0)nc ratios
found.
The six CAU (SGC tests) tests were anisotropically consolidated near to the in-situ stress state, with the aim to find the in situ undrained shear strength. When the undrained shear strength from these tests are superimposed on the closest CPTU tests, the above value of (cu/σ'0)nc = 0.28 is confirmed. These results are
shown together with the relevant CPTU results on Figure 7-3 and Figure 7-4.
Calculated versus measured undrained shear strength
0.0 10.0 20.0 30.0 40.0 0 10 20 30 40
Measured shear strength (kPa)
C al cu lat ed sh ear s tr en g th ( kP a)
SHANSEP based on insitu stess SHANSEP based on consolidation stress measured x 1.1(strain rate correction)
Feature 7-2 Calculated versus measured undrained shear strength based on SGC triaxial tests
The fit between the measured undrained strength and those derived from the SHANSEP approach is also illustrated in Figure 7-2 for the six CAU (SGC tests).
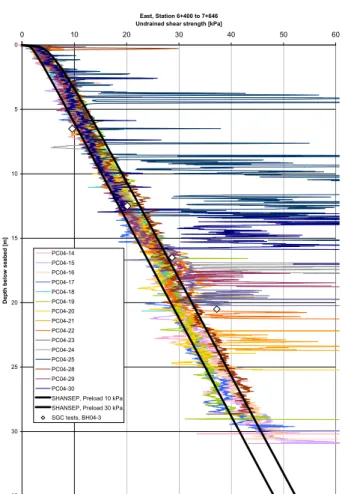
Figure 7-3 and Figure 7-4 illustrates the calculated undrained shear strength for the western and eastern part of the immersed tunnel, respectively.
0 5 10 15 20 25 30 35 0 10 20 30 40 50 60 West, Station 5+065 to 6+400 Undrained shear strength [kPa]
D ep th b el o w seab ed [ m ] PC04-01 PC04-02 PC04-03 PC04-04 PC04-05 PC04-06 PC04-07 PC04-08 PC04-09 PC04-10 PC04-11 PC04-12 PC04-13 PC04-26 PC04-27 SHANSEP, Preload 15 kPa SHANSEP, Preload 65 kPa SGC tests, BH04-2
Feature 7-3 Undrained shear strength for the western part of the tunnel
The composite plots clearly show that the marine clay deposit is homogenous (from a strength point of view) in the eastern part, see Figure 7-4, whereas this is not the case in the western part, see Figure 7-3. In the western part individual CPTU profiles show different strength levels (albeit the curves are very nearly parallel).
The normalised undrained shear strength has been assessed by use of Stress History And Normalised Soil Engineering Properties, SHANSEP. The normalised undrained shear strength for the 30 CPTU's can be described as: 76 . 0 ' 0
28
.
0
OCR
c
oc v u=
⋅
⎟⎟
⎠
⎞
⎜⎜
⎝
⎛
σ
where ' ' vo vo OCR σ σ Δ + σ =σ'v0 is the vertical effective stress, and,
Δσ is an assumed preloading stress.
0 5 10 15 20 25 30 35 0 10 20 30 40 50 60 East, Station 6+400 to 7+646 Undrained shear strength [kPa]
D e p th b e lo w se ab ed [ m ] PC04-14 PC04-15 PC04-16 PC04-17 PC04-18 PC04-19 PC04-20 PC04-21 PC04-22 PC04-23 PC04-24 PC04-25 PC04-28 PC04-29 PC04-30 SHANSEP, Preload 10 kPa SHANSEP, Preload 30 kPa SGC tests, BH04-3
Feature 7-4 Undrained shear strength for the eastern part of the tunnel
4 SOIL IMPROVEMENT DESIGN
The normal text should be written single-spaced, justified, using 10.5pt (Times New) Roman in two columns. The first line of each paragraph must be indented 0.5cm. There is not inter-paragraph spacing.
On the basis of the borehole data and seismic reflection survey results a ground profile of the tunnel area been made as below feature. Marine clay is forming the sea bed except in the near shore areas where bed rock outcrops. The thickness of the marine clay along most of the tunnel alignment exceeds 20m. The major part of marine clay is “very soft to soft” and of “very high plasticity” to “extremely high plasticity”. The segmental type of tunnel chosen for this project is sensitive about differential longitudinal settlement. Therefore, a number of soil improvement methods were considered in order to provide an appropriate foundation for the type of immersed tunnel chosen for the project. These methods included steel pile, sand compaction pile and cement deep mixing. The final foundation concept was to strengthen the clay with mixed cement/clay columns and walls formed by continuous columns, i.e. cement deep mixing (CDM).
This form of foundation has previously been used in Korea. It is also in widespread use in northern Europe for the control of settlements of structures built on soft clay deposits.
Feature 8 Ground profile
Different foundation support alternatives have been investigated through the sensitivity analysis and it was concluded that the most robust and efficient solution is to install settlement-reducing CDM elements. These partial depth CDM columns transfer the vertical load from the base of the tunnel through a gravel bed and the CDM-reinforced clay layer to stiffer, less compressible soil layers as below figure.
Feature 9 Concept of load sharing between foundation footing and settlement-reducing elements, (Massarsh,1997)
Feature 10 Typical cross section of CDM
Feature 11 Plan view of CDM
Mixing equipment must be operated under a stable working condition because the Cement/clay mixing
column can be damaged by movement of mixing shaft. Therefore, the special offshore equipment developed for this project and this equipment carried out the CDM work successfully under the exposed offshore condition.
5 CONCLUSION
Busan-Geoje Fixed Link locates in an exposed offshore, which is subjected to strong winds, large swell waves and strong tidal currents. Thus, the design and construction conditions are very chanllenging and a number of traditionally used solutions for immersed tunnels not usable. Therefore, the design and construction have been developed in order to overcome a number of difficult conditions. The last immersion for element 18th is planned in middle of 2010 and the link is scheduled to open for traffic in the end of 2010.
REFERENCES
1) Deawoo E&C (2005) Busan-Geoje Fixed Link Immersed
tunnel. Geotechnical Interpretative report. Detailed design.
2) Daewoo E&C (2006) Busan-Geoje Fixed Link Immersed
tunnel. Cement Deep Mixing(CDM) Foundation Tunnel Elements E3-E14. Detailed Design Report