Vol. 46, No. 4, pp. 484 - 490, 2005
The aim of this study was to assess the implications of insulin resistance on the clinical and biochemical profiles of Korean type 2 diabetic patients. 122 patients with type 2 diabetes underwent a short insulin tolerance test to assess insulin resistance. Subjects were classified in tertiles according to ISI (insulin sensitivity index), and the tertile I (the insulin-resistant group) and tertile III (the insulin-sensitive group) clinical and biochemical parameters were compared. Age, waist circumference (WC), systolic blood pressure (SBP), HbA1c, body fat content, and fasting plasma glucose were significantly higher in tertile I than tertile III (all p < 0.05). The frequency of hypertension and family history of cerebro-vascular disease (CVD) were greater in tertile I than III (p < 0.05). To evaluate the factors affecting ISI, multiple regression was performed, and age, WC, SBP, HbA1c, and body fat content were found to be independently related to insulin resis-tance (p<0.05). Old age, hypertension, central obesity, and poor glycemic control were identified as clinical parameters of insulin resistance in Korean type 2 diabetic patients. Key Words: Insulin resistance, type 2 diabetes, Korea
INTRODUCTION
A substantial amount of data indicates that insulin resistance plays a major role in the devel-opment of glucose intolerance and type 2 diabetes.
Insulin resistance is a consistent finding in patients with type 2 diabetes, and resistance is present years before the onset of diabetes.1
Pro-spective studies show that insulin resistance predicts the onset of diabetes.2 The term 'insulin
resistance' indicates an impaired biologic response to either exogenously administered or endoge-nously secreted insulin. Insulin resistance is mani-fested by decreased insulin stimulated glucose transport and metabolism in adipocytes and skeletal muscle, and by impaired suppression of hepatic glucose output. Insulin sensitivity is in-fluenced by a number of factors, including age, weight, ethnicity, body fat, physical activity, and medications. It has been reported that insulin resistance is associated with adiposity, particu-larly that which is centrally deposited, which is metabolically more active than that which is peripherally deposited.3,4 Insulin resistance is also
associated with hypertension and dyslipidemia (increased triglyceride and decreased HDL cholesterol levels) in type 2 diabetic subjects.4-7
In this study, we compared the clinical and biochemical characteristics of insulin-sensitive and insulin-resistant type 2 diabetic subjects, in order to assess the implications of insulin resistance in these diabetic patients, and to determine their clinical and biochemical profiles.
MATERIALS AND METHODS
A total of 122 type 2 diabetic patients at the Severance Hospital (YUMC) clinic participated in this study. The study protocol was approved by the ethical committee of Yonsei University College
Characteristics of Type 2 Diabetes in Terms of Insulin
Resistance in Korea
Jong-Suk Park, Chul-Sik Kim, Joo-Young Nam, Dol-Mi Kim, Min-Ho Jo, Jina Park, Chul-Woo Ahn, Bong-Soo Cha, Sung-Kil Lim, Kyung-Rae Kim, Hyun-Chul Lee, and Kap-Bum Huh
Department of Internal Medicine, Yonsei University College of Medicine, Seoul, Korea.
Received June 3, 2004 Accepted March 30, 2005
This study was supported by a grant from the Brain Korea 21 Project for Medical Science, Yonsei University, and from the Korea Health 21 R D Project, Ministry of Health and Welfare, Republic of Korea (03-PJ1-PG1-CH05-0005).
Reprint address: requests to Dr. Chul Woo Ahn, Division of Endocrinology, Department of Internal Medicine, Yongdong Severance Hospital, Yonsei University College of Medicine, 146-92 Dogok-dong, Gangnam-gu, Seoul 135-720, Korea. Tel: 82-2-3497-3339, Fax: 82-2-3463-3882, E-mail: [email protected]
of Medicine. Clinical data and informed consent were obtained from each patient. BMI (body mass index) and WC were recorded. Body fat content was measured by bioelectric impedance meter (InBody 3.0, Biospace, Korea). Hypertension was diagnosed if the patient had a blood pressure greater than 130/85 mmHg or was on antihy-pertensive therapy at the time of the study. The diagnosis of nephropathy was made when daily albumin loss exceeded 300 mg. Retinopathy was evaluated by fundoscopic examination and by fluourescein fundus angiography, and neuropathy was diagnosed with peripheral neuropathy by nerve conduction velocity. Patients with coronary disease were documented by angiography or through a history of angina and acute myocardial infarction. Patients with CVD were documented by brain MRI (magnetic resonance imaging) or a history of stroke. Plasma glucose was measured using the glucose oxidase technique on an auto-analyzer (Beckman, Fullerton, CA, USA). HbA1C
was analyzed by high performance liquid chroma-tography (HPLC) (Variant II, Bio-Rad, Hercules, CA, USA). Insulin and C-peptide (fasting, post-prandial) were measured by radioimmunoassay (Instar, Stillwater, MN, USA). Plasma lipoprotein measurements were obtained from fasting single fresh plasma samples using microplate methods (Behring ELISA Processor II Plus, Marburg, Ger-many). Total cholesterol and triglyceride concen-trations were measured using an autochemical analyzer (Hitachi 747, Nakashi, Japan) and an enzymatic method (Roche Diagnostics, Basel, Switzerland). HDL cholesterol was assayed by the selective inhibition test (Daichii, Tokyo, Japan). LDL cholesterol was calculated according to the Friedewald formula. Fibrinogen in citrated plasma was measured using a modified clot-rate assay and a Diagnostica Stago STA instrument (Asnieres-Sur-Serine, France).8 This technique was based on
the original method of Clauss.9Insulin sensitivity
was determined by the short insulin tolerance test (ITT).10,11
On the morning of the test day, a 20 G catheter equipped with a connector for blood sampling was inserted reversibly into one cephalic vein, and vessel blockage was prevented by a slow, constant infusion of saline solution. A second 20 G catheter was inserted for insulin and glucose infusion.
After the second catheter was inserted, the subject was asked to lie at rest for 20-30 minutes. In order to obtain an arterialized vein, the temperature at the sampling site was maintained at 60-70 with a heating pad. With the subject at rest, 0.1 U per kg of body weight of a 100x diluted short-acting human insulin (Humulin-R, Eli Lilly, Indiana, IN, USA) was administered via the vein, and a blood sample was obtained from the opposite vein at 0, 3, 6, 9, 12, and 15 min. Each blood sample was im-mediately centrifuged and its glucose concentra-tion determined. The insulin sensitivity index (ISI, %/min) was derived by linear regression from the rate of fall of the log glucose value between 3 and 15 min. The t1/2 was calculated when the baseline
blood glucose level reached 50% of its initial value, and the ISI was calculated from the equation:
ISI=0.693/t1/2× 100 (%/min)
Patients were classified into tertiles in accor-dance with ISI (0.39-4.70%/min).
We compared the clinical and biochemical characteristics of insulin-resistant (Tertile I, mean ISI=0.98 ± 0.31%/min) and insulin-sensitive sub-jects (Tertile III, mean ISI=3.50 ± 0.64%/min) by t-test or χ2 test (SAS Institute, Cary, NC).
Mul-tiple linear regression was performed to identify the factors affecting ISI (SAS Institute, Cary, NC). A p-value less than 0.05 was considered signi-ficant.
RESULTS
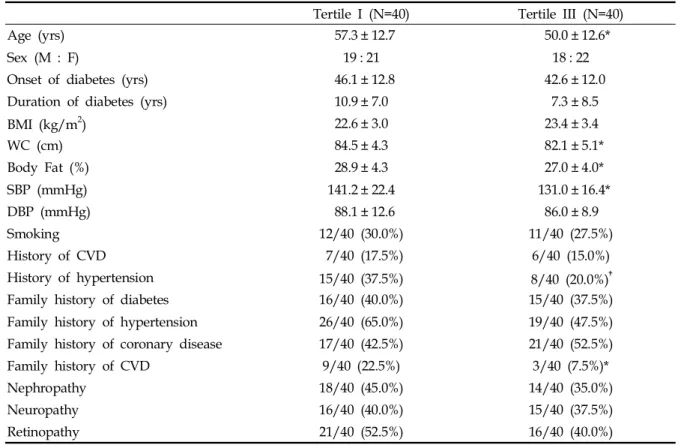
The ISI results ranged from 0.39 to 4.70%/min (mean ISI=2.14 ± 1.10%/min). According to the ISI, as measured in the short insulin tolerance test (ITT), subjects were classified into tertile I (0.39 < ISI < 1.54%/min; n=40), tertile II (1.54 < ISI < 2.55%/ min; n=42), and tertile III (2.55 < ISI < 4.70%/min; n=40). The following conclusions were drawn by comparing the clinical characteristics of insulin-sensitive (tertile III) and insulin-resistant (tertile I) subjects. The insulin-resistant group was signifi-cantly older (57.3 ± 12.7 years vs. 50.0 ± 12.6 years, p < 0.05). They also had a higher prevalence of hypertension and family history of CVD (37.5% vs. 20.0% and 22.5% vs 7.5%, respectively, p < 0.05). There was no difference between tertile I and III in terms of BMI (22.6 ± 3.0 vs. 23.4 ± 3.4
kg/m2, p > 0.05), but WC (84.5 ± 5.3 vs. 82.1 ± 5.1
cm, p < 0.05) and body fat content (28.9 ± 4.3% vs. 27.0 ± 4.0%, p < 0.05) were significantly higher in the insulin-resistant group (tertile I) than in the insulin-sensitive group (tertile III). SBP was higher in tertile I than in tertile III (141.2 ± 22.4 vs. 131.0 ± 16.4 mmHg, p < 0.05), but no difference was found in DBP (88.1 ±12.6 vs. 86.0 ± 8.9 mmHg, p > 0.05). In addition, no differences were found between tertiles I and III in terms of sex, onset and duration of diabetes, smoking, CVD, family his-tory of hypertension, diabetes, coronary disease or diabetic microvascular complications, i.e. nephr-opathy, neurnephr-opathy, and retinopathy (Table 1).
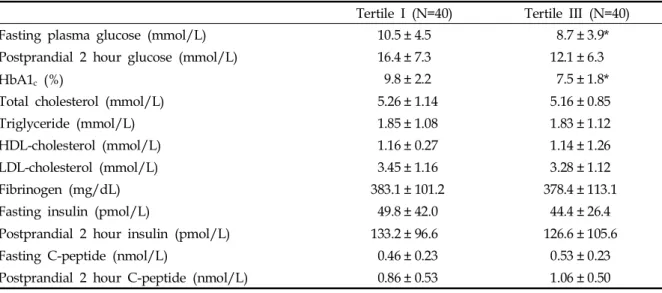
Insulin-resistant subjects had a higher fasting plasma glucose and HbA1c (10.5 ± 4.5 vs. 8.7 ±
3.9 mmol/L, p < 0.05; 9.8 ± 2.2% vs. 7.5 ± 1.8%, p < 0.05) than insulin-sensitive subjects. However, no statistically significant differences were found between tertiles I and III in terms of postprandial 2-hour blood glucose, fasting or postprandial in-sulin and C-peptide, total cholesterol, triglyceride,
LDL-cholesterol, HDL-cholesterol, or fibrinogen levels (Table 2). There was no statistical difference in treatment modality between insulin-resistant and insulin-sensitive subjects. To evaluate the fac-tors affecting ISI, multiple regression analysis was performed after adjusting for HbA1c. Since HbA1C and insulin resistance (ISI) were highly
correlated ( =-0.39), they were not included inβ the same regression model. The results indicated that age, WC, SBP and body fat content were significant independent variables. The correlations between ISI and age ( =-0.21), WC ( =-0.23),β β SBP ( =-0.20), and body fat content ( =-0.20)β β were statistically significant (Table 3), which sug-gests that WC and body fat content provide a bet-ter measure of visceral adiposity than does BMI.
DISCUSSION
In this study, differences were found between the clinical manifestations of type 2 diabetic
Table 1. Clinical Characteristics of Patients
Tertile I (N=40) Tertile III (N=40)
Age (yrs) 57.3 ± 12.7 50.0 ± 12.6*
Sex (M : F) 19 : 21 18 : 22
Onset of diabetes (yrs) 46.1 ± 12.8 42.6 ± 12.0
Duration of diabetes (yrs) 10.9 ± 7.0 7.3 ± 8.5
BMI (kg/m2) 22.6 ± 3.0 23.4 ± 3.4 WC (cm) 84.5 ± 4.3 82.1 ± 5.1* Body Fat (%) 28.9 ± 4.3 27.0 ± 4.0* SBP (mmHg) 141.2 ± 22.4 131.0 ± 16.4* DBP (mmHg) 88.1 ± 12.6 86.0 ± 8.9 Smoking 12/40 (30.0%) 11/40 (27.5%) History of CVD 7/40 (17.5%) 6/40 (15.0%) History of hypertension 15/40 (37.5%) 8/40 (20.0%)
Family history of diabetes 16/40 (40.0%) 15/40 (37.5%)
Family history of hypertension 26/40 (65.0%) 19/40 (47.5%)
Family history of coronary disease 17/40 (42.5%) 21/40 (52.5%)
Family history of CVD 9/40 (22.5%) 3/40 (7.5%)*
Nephropathy 18/40 (45.0%) 14/40 (35.0%)
Neuropathy 16/40 (40.0%) 15/40 (37.5%)
Retinopathy 21/40 (52.5%) 16/40 (40.0%)
Data are means±SD; *p<0.05, p<0.01.
patients in accordance with their levels of insulin resistance. Such differences suggest that insulin resistance plays an important role in the devel-opment of clinical manifestations, and in the path-ogenesis of the disease. A variety of approaches have been proposed to qualitatively and quantita-tively describe insulin sensitivity;12,13 for example,
fasting or postprandial insulin and C-peptide, the insulin tolerance test (ITT),14,15 the frequently
sam-pled intravenous glucose tolerance test (FSIVGTT),
16,17and the euglycemic clamp test.18 Of these
ap-proaches, insulin concentration, especially fasting insulin concentration, although commonly used as a surrogate for insulin resistance,19,20 may not be an optimum choice as a surrogate for insulin
re-sistance in type 2 diabetic patients. Insulin secre-tion decreases with increased hyperglycemia (g1ucotoxicity), and diabetic subjects have in-creased levels of proinsulin, which is recognized by some (but not all) insulin assays.21 Insulin is
reported to have considerable cross-reactivity with proinsulin.19,20,22 While the euglycemic clamp test
is widely regarded as the 'gold standard' for sen-sitivity measurement, it remains a laboratory pro-cedure, because it requires sophisticated equip-ment, highly trained personnel, and is a lengthy procedure. Thus, there is a need for simpler al-ternative methods for measuring insulin sensi-tivity.17 Although there are limits to the validity of ITT,23,24 if it is performed while the blood glu-Table 2. Biochemical Profiles of Patients
Tertile I (N=40) Tertile III (N=40)
Fasting plasma glucose (mmol/L) 10.5 ± 4.5 8.7 ± 3.9*
Postprandial 2 hour glucose (mmol/L) 16.4 ± 7.3 12.1 ± 6.3
HbA1c (%) 9.8 ± 2.2 7.5 ± 1.8*
Total cholesterol (mmol/L) 5.26 ± 1.14 5.16 ± 0.85
Triglyceride (mmol/L) 1.85 ± 1.08 1.83 ± 1.12
HDL-cholesterol (mmol/L) 1.16 ± 0.27 1.14 ± 1.26
LDL-cholesterol (mmol/L) 3.45 ± 1.16 3.28 ± 1.12
Fibrinogen (mg/dL) 383.1 ± 101.2 378.4 ± 113.1
Fasting insulin (pmol/L) 49.8 ± 42.0 44.4 ± 26.4
Postprandial 2 hour insulin (pmol/L) 133.2 ± 96.6 126.6 ± 105.6
Fasting C-peptide (nmol/L) 0.46 ± 0.23 0.53 ± 0.23
Postprandial 2 hour C-peptide (nmol/L) 0.86 ± 0.53 1.06 ± 0.50
Data are means±SD; *p<0.05.
Table 3. Factors Affecting Insulin Resistance (ISI)
β β
HbA1c (%) -0.39* T. cholesterol (mmol/L) -0.35
Age (yrs) -0.21* TG (mmol/L) -0.59
IBW (%) -0.10 HDL-C (mmol/L) -0.01
BMI (kg/m2) -0.11 LDL-C (mmol/L) -0.01
WC (cm) -0.23* Insulin (fasting) (pmol/L) -0.04
Fat (%) -0.20* Insulin (postprandial 2 hour) (pmol/L) -0.17
SBP (mmHg) -0.20* C-peptide (fasting) (nmol/L) -0.01
DBP (mmHg) -0.14 C-peptide (postprandial 2 hour) (nmol/L) 0.03
Data are means ± SD, *p < 0.05.
IBW (%), percentage of ideal body weight; Fat (%), percentage of body fat content; SBP, systolic blood pressure; DBP, diastolic blood pressure; HDL-C, HDL-cholesterol; LDL-C, LDL-cholesterol.
cose level is stable (subjects with a fasting glucose level < 7.8 mmol/L), then it is a valid measure of insulin resistance, as compared to the hyperinsu-linemic-euglycemic clamp test.10,11,16,24
Insulin resistance is associated with increased age. Aging leads to a reduction in lean body mass, which contributes to insulin resistance; increasing fat mass also increases insulin resistance.7Results
from the current study support that aging and in-creasing body fat content are associated with insulin resistance.
In this study, insulin-resistant subjects did not have general adiposity, and BMI did not appear to be related to insulin resistance, but central adiposity and body fat content were significantly correlated with insulin resistance. WC and body fat content provided a better measure of visceral adiposity than did BMI. We evaluated visceral adiposity using WC or body fat content. It is a limitation of our study that visceral fat was not measured directly.
It has been reported that there is an adverse relationship between insulin sensitivity and hypertension.5,25 In this study, insulin resistance was not associated with diastolic blood pressure, but was associated with higher systolic blood pressure. Previous studies have reported that insulin resistance is associated with elevated triglycerides and lower HDL cholesterol levels in type 2 diabetic subjects.6,7,26 However, the present study shows no difference in lipid profiles. In general, during the process of atherosclerosis, which is partly involved in insulin resistance, the systolic blood pressure is more elevated than the diastolic blood pressure.27 Thus, if
insulin-resis-tant subjects included in our study were in the preliminary stages of atherosclerosis, differences in diastolic blood pressure would not have been as evident as differences in systolic blood pres-sure. Similar reasoning could be applied to the lack of dyslipidemia differences between the two groups.
In addition, insulin resistance may influence not only the lipid levels but also lipid profile patterns, such as the HDL subfraction or the LDL size.28
Thus, there could be changes in the HDL sub-fraction or the LDL size, and no differences between the lipid levels of the two groups. The results of this study also imply that other factors,
such as hypertension, dyslipidemia, or β-cell function, affect the clinical manifestations. These factors might influence the clinical course of dia-betes. The present study has some shortcomings in terms of the evaluation of β-cell function, which is an important aspect of pathogenesis, and was evaluated by fasting or postprandial insulin and C-peptide. The variation between individuals and the dependency on blood glucose levels are limitations to the clinical use of fasting or post-prandial insulin and C-peptide,29 and the results
of this study showed that hypertension and a family history of cerebrovascular disease are more prevalent in insulin-resistant patients. After ad-justing for HbA1c, the insulin resistance, as as-sessed by ISI, was strongly associated with age, WC, and body fat content. When type 2 diabetic patients demonstrated these clinical manifesta-tions, they tended to be insulin resistant, and therefore insulin sensitizers, rather than insulin secretagogues, should be considered as elements of the treatment regimen.30,31 Based on the
conclu-sions of the U.K. Prospective Diabetic Study (1998), the use of insulin sensitizers may prove beneficial, because this aspect of treatment is based on pathogenesis.32 In practice, this means
that in terms of potential insulin-sensitizing a-gents, therapies based upon metformin or thia-zolidinedione, are more likely to produce a better outcome in this insulin resistant group of patients than are sulfonylureas. Clinical trial studies should be conducted to investigate the merits of this approach, with an emphasis on clinical out-come.
In summary, we compared the clinical and biochemical characteristics of insulin-sensitive and insulin-resistant diabetic patients. Age, hyperten-sion, central obesity, and poor glycemic control were identified as clinical parameters of insulin resistance in Korean type 2 diabetic patients.
ACKNOWLEDGEMENTS
We are grateful to Professor JM Nam, PhD for statistical advice, and Dr John Roberts at Yonsei Medical College for helpful discussion and critical reading of the manuscript in this study.
REFERENCES
1. DeFronzo RA. Lilly Lecture 1987. The triumvirate: -β cell, muscle, liver. A collusion responsible for NIDDM. Diabetes 1988;37:667-87.
2. Warram JH, Martin BC, Krolewski AS, Soeldner JS, Kahn CR. Slow glucose removal rate and hyperinsu-linemia precede the development of type II diabetes in the offspring of diabetic parents. Ann Intern Med 1990;113:909-15.
3. Anderson PJ, Critchley JA, Chan JC, Cockram CS, Lee ZS, Thomas GN, et al. Factor analysis of the metabolic syndrome: obesity vs insulin resistance as the central abnormality. Int J Obes 2001;25:1782-8.
4. Despres JP, Lemieux S, Lamarche B, Prud'homme D, Moorjani S, Brun LD, et al. The insulin resistance dyslipidemic syndrome: contribution of visceral obesity and therapeutic implications. Int J Obes Relat Metab Disord 1995;19:S76-86.
5. Tsuruta M, Hashimoto R, Adachi H, Imaizumi T, Nomura G. Hyperinsulinemia as a predictor of hyper-tension: an 11 year follow up study in Japan. J Hypertens 1995;14:483-8.
6. Widen E, Ekstrand A, Saloranta C, Franssila-Kallunki A, Eriksson J, Schalin-Janti C, et al. Insulin resistance in type 2 (non-insulin-dependent) diabetic patients with hypertriglyceridaemia. Diabetologia 1992;35:1140-5. 7. Thomas GN, Hong AW, Tomlinson B, Lam CW,
Critchley JA, Sanderson JE, et al. Increasing insulin resistance contributes to worsening glycaemic and lipid profiles in older Chinese subjects. Diabetes Res Clin Pract 2004;64:123-8.
8. Geffken D. Keating F, Kennedy M, Cornell E, Bovill E, Tracy R. The measurement of fibrinogen in population-based research. Studies on instrumentation and methodology. Arch Pathol Lab Med 1994;118:1106-9. 9. Clauss A. Rapid physiological method in determination
of fibrinogen. Acta Haematol 1957;17:237-46.
10. Hirst S, Phillips DI, Vines SK, Clark PM, Hales CN. Reproducibility of the short insulin tolerance test. Diabet Med 1993;10:839-42.
11. Park SW, Yun YS, Ahn CW, Nam JH, Kwon SH, Song MK, et al. Short Insulin Tolerance Test (SITT) for deter-mination of in vivo insulin sensitivity-a comparison with euglycemic clamp test. J Korean Diabetes Assoc 1998;22:199-208.
12. Shen SW, Reaven GM, Farquhar JW. Comparison of impedance to insulin mediated glucose uptake in nor-mal subjects and in subjects with latent diabetes. J Clin Invest 1970;49:2151-60.
13. Bergman RN, Ider YZ, Bowden CR, Cobelli C. Quan-titative estimation of insulin sensitivity. Am J Physiol 1979;236:E667-77.
14. Lundbaek K. Intravenous glucose tolerance as a tool in definition and diagnosis of diabetes mellitus. Br Med J 1962;1:1507-13.
15. Bonora E, Moghetti P, Zancanaro C, Cigolini M, Querena M, Cacciatori V, et al. Estimates of in vivo
insulin action in man: comparison of insulin tolerance tests with euglycemic and hyperglycemic glucose clamp studies. J Clin Endocrinol Metab 1989;68:374-8. 16. Saad MF, Anderson RL, Laws A, Watanabe RM, Kades WW, Chen YD, et al. A comparison between the mini-mal model and the glucose clamp in the assessment of insulin sensitivity across the spectrum of glucose to-lerance. Insulin Resistance Atherosclerosis Study. Diabetes 1994;43:1114-21.
17. Bergman RN, Prager R, Volund A, Olefsky JM. Equiv-alence of the insulin sensitivity index in man derived by the minimal model method and euglycemic glucose clamp. J Clin Invest 1987;79:790-800.
18. DeFronzo RA, Tobin JD, Andres R. Glucose clamp technique: A method for quantifying insulin secretion and resistance. Am J Physiol 1979;237:E214-23. 19. Welborn TA, Wearne K. Coronary heart disease
in-cidence and cardiovascular mortality in Busselton with reference to glucose and insulin concentrations. Dia-betes Care 1979;2:154-60.
20. Pyorala K. Relationship of glucose tolerance and plas-ma insulin to the incidence of coronary heart disease: Results from two population studies in Finland. Dia-betes Care 1979;2:131-41.
21. Rossetti L, Giaccari A, DeFronzo RA. Glucose toxicity. Diabetes Care 1990;13:610-30.
22. Robinson DC, Anderson L, Bowsher R, Chance R, Dinesen B, Frank B, et al. Report of the American Dia-betes Association's task force on standardization of the insulin assay. Diabetes 1960;45:242-56.
23. Grulet H, Durlach V, Hecart AC, Gross A, Leutenegger M. Study of the rate of early glucose disappearance following insulin injection: insulin sensitivity index. Diabetes Res Clin Pract 1993;20:201-7.
24. Akinmokun A, Selby PL, Ramaiya K, Alberti KG. The short insulin tolerance test for determination of insulin sensitivity. A comparison with the euglycemic clamp. Diabet Med 1992;9:432-7.
25. Laakso M, Sarlund H, Mykkanen L. Essential hyper-tension and insulin resistance in non-insulin-dependent diabetes. Eur J Clin Invest 1989;19:518-26.
26. Stewart MW, Laker MF, Dyer RG, Game F, Mitcheson J, Winocour PH, et al. Lipoprotein compositional abnormalities and insulin resistance in type II diabetic patients with mild hyperlipidemia. Arterioscler Thromb 1993;13:1046-52.
27. Reaven GM, Lithell H, Landsberg L. Hypertension and associated metabolic abnormalities- the role of insulin resistance and the sympathoadrenal system. N Engl J Med 1996;334:374-81.
28. Tchernof A, Lamarche M, Prud'homme D, Nadeau A, Moorjani S, Labrie F, et al. The dense LDL phenotype. Association with plasma lipoprotein levels, visceral obesity, and hyperinsulinemia in men. Diabetes Care 1996;19:629-37.
29. Bonser AM, Garcia-Webb P. C-peptide measurement and its clinical usefulness. Ann Clin Biochem 1981;18: 200-6.
30. DeFronzo RA, Goodman AM. Efficacy of metformin in patients with non-insulin dependent diabetes mellitus. The Multicenter Metformin Study Group. N Engl J Med 1995;333:541-9.
31. Ghazzi MN, Perez JE, Antonucci TK, Driscoll JH, Huang SM, Faja BW, et al. Cardiac and glycemic
bene-fits of troglitazone treatment in NIDDM. The Trogli-tazone Study Group. Diabetes 1997;46:433-9.
32. United Kingdom Prospective Diabetes Study Group. Effect of intensive blood glucose control with metfor-min on complications in overweight patients with type 2 diabetes(UKPDS 34). Lancet 1998;352:854-65.