H yung-Lae K im
Department of Biochemistry College of MedicineEwha Womans University, Seoul, Korea Tel, 82-2-2650-5727; Fax, 82-2-2652-7846; E-mail, [email protected]
Accepted 7 October 2003
Abbreviations: SAGE, serial analysis of gene expression
Abstract
For the com prehensive analysis of transcript ex-pression, the array-based hybridization analysis and the serial analysis of gene expression (SAGE) are com m only used platform s. The SAGE is based on a high-throughput sequencing of ditags derived from the transcript. DNA m icroarrays are a power-ful tool for m onitoring thousands of transcripts sim ultaneously, w hereas the Genechip (Affim atrix m icroarray) technology is based on the hybridi-zation of a single probe or other m anufacturer's m icroarrays (cDNA- or oligonucleotide-m icroarray) procedures include the com petitive hybridization of two probes. In this study, the quantitative accuracy of expression using oligonucleotide-m i-croarray w as determ ined by com paring data set from the SAGE. In previous study the m icroSAGE w as perform ed for the m egakaryocytes and non- m egakaryocytes derived from hum an cord blood CD34+ cells by ex vivo expansion using throm
bo-poietin, and a total of 38,909 tags representing 8,976 unique genes w ere obtained. O n the iden-tical RNA, expression profiling was also carried out using oligonucleotide-m icroarray (M AG IC II 10K chip, Macrogen). The m ost frequently express-ed genes in hum an m egakaryocytes were identi-fied as platelet factor 1 follow ed by annexin A1, ribosomal protein S23. The majority of the 50 most highly expressed genes in the CD34+-derived m
e-gakaryocytes w ere those involved in protein syn-thesis, e.g., ribosom al proteins. The expression level through the single channel of oligonucleo-tide-m icroarray and SAG E have a fairly good
cor-relation in terms of absolute analyses and that the correlation is higher for the genes with higher ex-pression levels.
Keywords: oligonucleotide microarray; transcript ex-pression analysis
Introduction
For the analysis of the global gene expression, sever-al methods such as DNA microarray and serisever-al analysis of gene expression (SAGE) were developed. DNA microarrays are technology to profile the expres-sion of thousands of transcripts simultaneously (Brown and Botstein, 1999; Lockhart and Winzeler, 2000; Noordewier and Warren, 2001), and two different types of microarray technologies are available; Gene-chips (Affymetrix platform) and spotted microarrays. The Genechips produced by photolithography and hy-bridize the single cRNA probe have certain advan-tages over spotted microarray, such as that cross- hybridization could be avoided, quality control by se-quence validation of PCR clones is not required, and noncompetitive nature of hybridization make small amount of RNA sample detectable (Kane et al., 2000; Lockhart and Winzeler, 2000). As this platform is not accessible for every laboratory, spotted microarrays of longer oligonucleotides (50-70 mer) are becoming at-tractive and alternative platform (Hughes et al., 2001). The spotted microarrays are manufactured by spot-ting the cDNAs or synthetic oligonucleotides to the glass plate. Oligonucleotide-microarrays were recently preferred over cDNA microarray due to the easiness of target gene design and the reliability of hybidization (Southern et al., 1999). Oligonucleotide-libraries cove-ring large parts of the transcriptome of several organi-sms are now available from many companies. Quanti-tation of transcripts using oligonucleotide-microarrays is based on the competitive hybridization of each la-beled cRNA probes to the oligonucleotides anchored on the glass. In short, the total RNA from two differ-ent samples was reverse-transcribed into cDNAs, which were labeled with fluorescent dyes Cy3 (blue) and Cy5 (red). The cDNA (or cRNA) labeled with Cy3 and Cy5 are mixed together and hybridized against oligonucleotides on the same array. The two popula-tions compete for the same targets or probe spots on
Comparison of oligonucleotide-microarray and serial analysis
of gene expression (SAGE) in transcript profiling analysis
of megakaryocytes derived from CD34
+
cells
the array. The spot intensity at the two wavelengths is determined. A ratio or log ratio between the two fluorescent intensities is calculated. The most advan-tage of the microarray platform in global analysis of gene expression is the speed of data aquisition, but the gene with low level of expression would not be discriminated from that of no expression.
SAGE is a high throughput sequencing based tech-nique used to estimate the relative expression levels of thousands of transcripts by sequencing conca-tamers of short sequence tags derived from transcript sample. SAGE developed by Velculescu is based on the principle that a nucleotide sequence of 9-10 bases (a gene tag) at a specific location within a transcript represents a specific gene (Velculescu et al., 1995). These tags, which contain sufficient information to identify a gene uniquely, are generated, concatenated and cloned. By sequencing the clones, the identi-fication and the abundance of a transcript are establi-shed. The number of tags for a given sequence by the total tags gives the absolute abundance of the tag. It allows for the establishment of both a repre-sentative and comprehensive different gene expres-sion profile in various cell types and organs under physiological and pathological states. The data set by SAGE platform has been used construct the transcript expression databases (http://www.sagenet.org). It has been a great concern whether the expres-sion analysis using microarray has quantitative accur-acy, and whether it has reliable correlation comparing SAGE data set. Although microarray technology has previously shown to be correlated well with other analy-tical methods including SAGE, but the microarray tech-nology used was always the Affymetrix Genechip based on the single probe hybridization (Ishii et al., 2000; Evans et al., 2002). As the other microarray pro-cedures adopted the competitive nature the hybridi-zation of two probes, they have been applied to evalu-ate only the relative changes of expression. This ne-cessitates the evaluation of the competitive hybridi-zation-based microarray using two probes by com-paring other platforms of global transcript analysis. The accuracy of spotted microarray in comparion with SAGE has not been done. Previously, we have perform-ed microSAGE in megakaryocytes and non-megaka-ryocytes derived from human CB CD34+ cells by ex
vivo expansion using thrombopoietin (Kim et al., 2002). Total 38,909 tags representing 8,976 unique genes were obtained. In this study, the quantitative accuracy of oligonucleotide-microarray (MAGIC II chip; Macro-gen) was determined by comparing transcript profile to that of SAGE method on the identical mRNA specimens. From this study it is observed that the gene expression levels from oligonucleotide-microar-ray fairly correlated well with the SAGE for the moderate- to high expressed transcripts.
M aterials and M ethods
Preparation of cells and m RNAThe procedures used to prepare samples are describ-ed previously (Kim et al., 2002). Briefly, cord blood (CB) was obtained from full-term deliveries with inform-ed consent. Cord blood mononuclear cells were isolated by centrifugation on a FicollHypaque (density, 1.077; APB, Upsalla, Sweden) density centrifugation. The CD34+ cell fraction was positively isolated using
an anti-CD34 monoclonal antibody (QBEND 10; Miltenyi Biotech, Bergisch Gladbach, Germany) The CD34+ cells were cultured in serum-free essential
media supplemented with bovine serum albumin, in-sulin, and transferrin (StemCell Technologies, Vancou-ver, BC, Canada), and were stimulated with recombi-nant human TPO (50 ng/ml; Kirin Brewery, Maebashi, Japan) alone. After 10 days, megakaryocytes fraction was separated from non-megakaryocytes fraction using an anti-CD61 (GPIIb/IIIa) monoclonal antibody (Dako, Copenhagen, Denmark). Purity of each separ-ated fraction was verified by flow cytometry with a dif-ferent antibody reacting with megakaryocytes (FITC- conjugated anti-human CD41; BD). Total RNA from these cells was isolated using TRIZOL (Gibco BRL, NY) according to the manufacturer's instructions. The same RNA was used in both protocols.
SAGE protocol
The microSAGE protocol has been described previ-ously (Datson et al., 1999; Kim et al., 2002). Biotinyl-ated oligo dT primer annealed 10 µg of total RNA was converted to cDNA with a cDNA synthesis kit (Gibco BRL) in streptavidine coated PCR tube (Roche; Mannheim, Germany; http://biochem.boehringer- mannheim.com). The cDNA was cleaved with Nla III, and was ligased to the oligonucleotide containing recognition sites for BsmF I. After ligation, the bound cDNA was released from the matrix by digestion with BsmF I. SAGE tag overhangs were filled with Klenow enzyme, and tags from two pools were combined and ligated to each other. The ligation product was ampli-fied by PCR, concatemerized and cloned into the SphI site of pZero-1 (Invitrogen, Calsbad, CA). Clones were sequenced with the BigDye terminator kit and analyzed using ABI 3,700 automated sequencer (Perkin- Elmer, Branchberg). Sequence files were analyzed by means of SAGE analysis software version 4.12. Sequence files were analyzed, and statistical analysis of the data was performed by the use of SAGE software, version 4.12 (courtesy of Victor Velculescu and Ken Kinzler, Johns Hopkins University School of Medicine) (Velculescu, Zhang et al., 1995). The iden-tity of the mRNAs corresponding to the SAGE tags was determined through inspection and comparison
with the SAGEmap (www.ncbi.nlm. nih.gov/SAGE/SAGE-tag.cgi) and UniGene (www.ncbi.nlm.nih.gov/UniGene) databases. SAGE tags that had no reliable matches and multiple matches in Unigene clusters were ex-cluded from the list. Mitochondrial genes and ESTs were also omitted. If more than one gene tag cor-responded to the same Unigene cluster, then the higher ranked tag was selected.
M icroarray protocol
Experimental procedures for microarray were per-formed according to the Macrogen MAGIC II-10K technical Manual. The identical total RNA as in the SAGE protocol was used to generate cDNA. Total RNA (5 µg) was converted into double stranded cDNA using the cDNA synthesis system (Roche) using T7- (dT)24 primer. The each cDNA was purified using
RN-easy kit (Qiagen, Valencia, http://www.qiagen.com). Non-megakaryocytes selected by CD61 antibody were used as reference in the experiment. Each Cy3-(for non-megakaryocytes), or Cy5-(for megakaryocytes) labeled cRNA was synthesized using the Megascript T7 kit (Ambion, Austin), using Cy3-CTP and Cy5-CTP (APB, Uppsala Sweden). The cRNA was cleaned using RNeasy (Qiagen). Labeled 15 µg of each cRNA was mixed and fragmented by heating to 94oC for 15
min. Fragmented cRNA was hybridized with MAGIC II-10 K microarray (Macrogen, Seoul, Korea) for 16 h at 42oC. Arrays were then washed and scanned
with an Array scanner (APB). Acquired images were processed and analyzed statistically for interpretation of analyzed spot intensity results using Imagene v4.1 software (Roche). Non-biological factors that may
contribute to variability of data were minimized using global normalization/scaling with data from all probe sets, and normalization between the microarrays was also carried out. Each chip contains a total of 10,368 elements of which 10,108 are unique genes/clusters. The length of oligonucleotides was 50-mer.
R esults
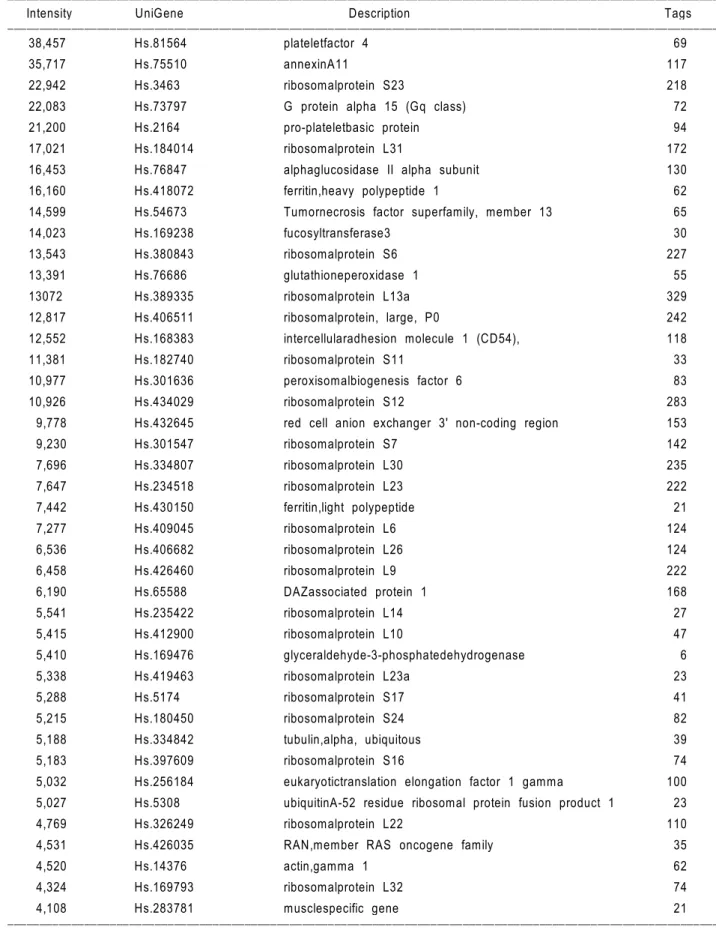
Total of 38,909 SAGE tags representing 8,976 unique genes were obtained from megakaryocytes. After nor-malization of fluorescence intensities from the micro-array, 8,889 transcripts were used for the exact com-parison to that of SAGE using Unigene accession number. Resulting total 1,168 transcripts were match-ed to each system. For the CD34+-derived
megakary-ocytes, the top 50 transcripts in terms of cy5 fluore-scence intensity were listed in Table 1. The most fre-quently expressed genes in human megakaryocytes were identified as platelet factor 1 followed by an-nexin A1, ribosomal protein S23. The majority of the 50 most highly expressed genes in the CD34+-
deri-ved megakaryocytes were those involderi-ved in protein synthesis, e.g., ribosomal proteins.
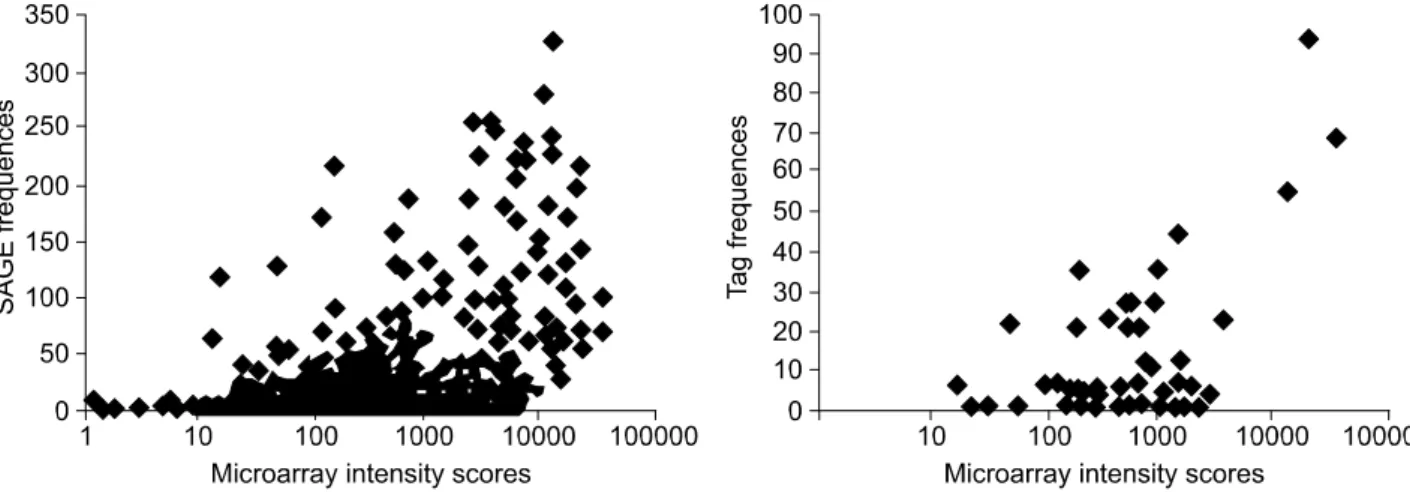
The correlation between the probe intensity ob-served in oligonucleotide-microarray and the actual mRNA abundance in terms of absolute analyses was shown in Figure 1. Comparing the logarithmic scale of the fluorescent intensities and tag frequencies for the 1,168 Unigenes, the Spearman's coefficient is 0.425 (P = 0.0001, Figure 1A). Oligonucleotide-micro-array intensity scores are one or two orders of mag
Figure 1. Scatter graph of intensity values in oligonucleotide-microarray and the number of tags in SAGE. Intensity scores and the number of tags are plotted in a logarithmic scale on the abscissa and the ordinate, respectively. Genes with no tag and tags that match multiple genes were excluded. GeneChip scores are one or two orders of magnitude higher than SAGE frequencies. (A) For the CD34+-derived megakaryocytes,
the coefficient was as high as 0.425 (n = 1,168, P < 0.0001). (B) For the transcript without any significant change (expression fold-changes < 2) in microarray, the coefficient was as high as 0.657 (n = 73, P < 0.0001).
Table 1. Transcript profile in CD61+ megakaryocytes derived from CD34+ cells.
ꠚꠚꠚꠚꠚꠚꠚꠚꠚꠚꠚꠚꠚꠚꠚꠚꠚꠚꠚꠚꠚꠚꠚꠚꠚꠚꠚꠚꠚꠚꠚꠚꠚꠚꠚꠚꠚꠚꠚꠚꠚꠚꠚꠚꠚꠚꠚꠚꠚꠚꠚꠚꠚꠚꠚꠚꠚꠚꠚꠚꠚꠚꠚꠚꠚꠚꠚꠚꠚꠚꠚꠚꠚꠚꠚꠚꠚꠚꠚꠚꠚꠚꠚꠚꠚꠚꠚꠚꠚꠚꠚꠚꠚꠚꠚꠚꠚꠚꠚꠚꠚꠚꠚꠚꠚꠚꠚꠚꠚꠚꠚ
Intensity UniGene Description Tags
ꠏꠏꠏꠏꠏꠏꠏꠏꠏꠏꠏꠏꠏꠏꠏꠏꠏꠏꠏꠏꠏꠏꠏꠏꠏꠏꠏꠏꠏꠏꠏꠏꠏꠏꠏꠏꠏꠏꠏꠏꠏꠏꠏꠏꠏꠏꠏꠏꠏꠏꠏꠏꠏꠏꠏꠏꠏꠏꠏꠏꠏꠏꠏꠏꠏꠏꠏꠏꠏꠏꠏꠏꠏꠏꠏꠏꠏꠏꠏꠏꠏꠏꠏꠏꠏꠏꠏꠏꠏꠏꠏꠏꠏꠏꠏꠏꠏꠏꠏꠏꠏꠏꠏꠏꠏꠏꠏꠏꠏꠏꠏ
38,457 Hs.81564 plateletfactor 4 69
35,717 Hs.75510 annexinA11 117
22,942 Hs.3463 ribosomalprotein S23 218
22,083 Hs.73797 G protein alpha 15 (Gq class) 72
21,200 Hs.2164 pro-plateletbasic protein 94
17,021 Hs.184014 ribosomalprotein L31 172
16,453 Hs.76847 alphaglucosidase II alpha subunit 130
16,160 Hs.418072 ferritin,heavy polypeptide 1 62
14,599 Hs.54673 Tumornecrosis factor superfamily, member 13 65
14,023 Hs.169238 fucosyltransferase3 30 13,543 Hs.380843 ribosomalprotein S6 227 13,391 Hs.76686 glutathioneperoxidase 1 55 13072 Hs.389335 ribosomalprotein L13a 329 12,817 Hs.406511 ribosomalprotein, large, P0 242 12,552 Hs.168383 intercellularadhesion molecule 1 (CD54), 118 11,381 Hs.182740 ribosomalprotein S11 33 10,977 Hs.301636 peroxisomalbiogenesis factor 6 83 10,926 Hs.434029 ribosomalprotein S12 283
9,778 Hs.432645 red cell anion exchanger 3' non-coding region 153
9,230 Hs.301547 ribosomalprotein S7 142 7,696 Hs.334807 ribosomalprotein L30 235 7,647 Hs.234518 ribosomalprotein L23 222 7,442 Hs.430150 ferritin,light polypeptide 21 7,277 Hs.409045 ribosomalprotein L6 124 6,536 Hs.406682 ribosomalprotein L26 124 6,458 Hs.426460 ribosomalprotein L9 222 6,190 Hs.65588 DAZassociated protein 1 168 5,541 Hs.235422 ribosomalprotein L14 27 5,415 Hs.412900 ribosomalprotein L10 47 5,410 Hs.169476 glyceraldehyde-3-phosphatedehydrogenase 6 5,338 Hs.419463 ribosomalprotein L23a 23 5,288 Hs.5174 ribosomalprotein S17 41 5,215 Hs.180450 ribosomalprotein S24 82 5,188 Hs.334842 tubulin,alpha, ubiquitous 39 5,183 Hs.397609 ribosomalprotein S16 74
5,032 Hs.256184 eukaryotictranslation elongation factor 1 gamma 100 5,027 Hs.5308 ubiquitinA-52 residue ribosomal protein fusion product 1 23
4,769 Hs.326249 ribosomalprotein L22 110
4,531 Hs.426035 RAN,member RAS oncogene family 35
4,520 Hs.14376 actin,gamma 1 62
4,324 Hs.169793 ribosomalprotein L32 74
4,108 Hs.283781 musclespecific gene 21
nitude higher than SAGE frequencies due to ampli-fication of RNA. Genes ranked high by the SAGE method generally showed high-intensity scores in microarray analysis. This graph suggests that the two analytical procedures, oligonucleotide-microarray and SAGE, have a fairly good correlation in terms of absolute analyses and that the correlation is higher for genes with higher expression levels.
Conventionally using the spotted-microarray, the further analysis has been carried out for the transcript with the expression fold-changes greater than 2. Transcripts without any significant change and the fold-changes less than 2 were excluded. Figure 1b shows the scatter graph of the log intensity values in oligonucleotide-microarray and the SAGE tag numbers. The coefficient became as high as 0.657 (n = 73, P < 0.001). The scatter graph of fold changes in both analytical procedures indicates that the comparative analyses have a better correlation among those genes with high SAGE tags, but have a re-latively poor correlation among genes with lower SAGE tags. The relatively poor correlation in the range of low tag numbers may be attributable to the limited number of tags caused by extensive exclusion of genes from the list.
D iscussion
The spotted-microarray was used for the study of transcriptional activity only in terms of fold changes. So this makes the spotted-microarray uneasy to com-pare the each fluorescent intensities of microarray with the expression level of other platforms, such as SAGE. Theoretical basis of using the intensity from the single channel of cy5 (or cy3 as well) in com-paring SAGE frequencies is as follows. The amount
of fluorescence-labelled cRNA used for hybridization on microarray is about 20 µg. If the frequency of the RNA for the moderately expressed species is 1/3,000, its amount would be around 10 fmole (Rininge et al., 2000). As 50 fmol of oligonucleotides were overlaid for each spot on the microarray, the amount would be more than that of the moderate to low expressed transcripts. So, it is supposed that the hybridization mechanism would not be so competitive in the ex-perimental condition using two probes, excluding a couple of the highly-expressed transcripts.
As a whole, spotted oligonucleotide-microarray tech-nology is reasonably reliable for the analysis of ex-pression profiling of genes with higher exex-pression levels and greater changes in expression by SAGE and the MAGIC II chip The coefficient was 0.42, which is somewhat lower than that of the other report using GeneChip (Ishii et al., 2000). The GeneChip technology, which is based on the single probe hy-bridization, was described to be moderately quanti-tative in terms of comparative analyses (Evans et al., 2002). When compared for the transcript with ex-pression-fold changes greater than 2, the coefficient was 0.67. If the transcripts with low tag numbers were excluded, the coefficient would be higher. The de-tection efficiency of microarray for the transcripts with the low tag numbers (for example 1 or 2 tags) was highly variable, as 0 to 100% (Evans et al., 2002). So the reduction of correlation was mainly ascribe to the irrelevance between the low SAGE tags and microarray fluorescence intensities. The detailed causes might come from the limitations and drawbacks of each technology.
Microarray is a high throughput method for profiling gene expression but many variables influence the outcome of the experiment. It may under perform due to probe design issues, such as; distance of the
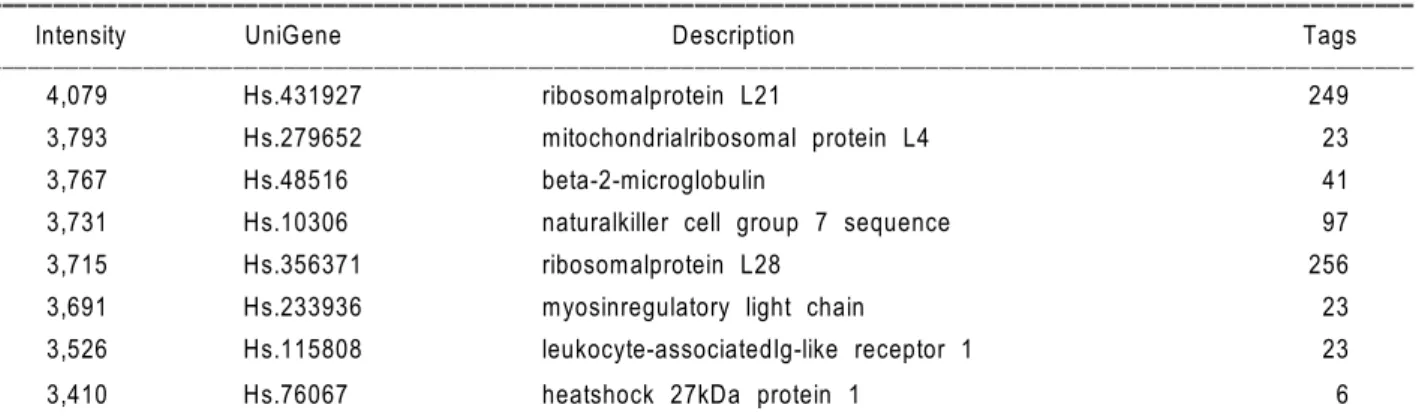
tar-Table 1. Continued.
ꠚꠚꠚꠚꠚꠚꠚꠚꠚꠚꠚꠚꠚꠚꠚꠚꠚꠚꠚꠚꠚꠚꠚꠚꠚꠚꠚꠚꠚꠚꠚꠚꠚꠚꠚꠚꠚꠚꠚꠚꠚꠚꠚꠚꠚꠚꠚꠚꠚꠚꠚꠚꠚꠚꠚꠚꠚꠚꠚꠚꠚꠚꠚꠚꠚꠚꠚꠚꠚꠚꠚꠚꠚꠚꠚꠚꠚꠚꠚꠚꠚꠚꠚꠚꠚꠚꠚꠚꠚꠚꠚꠚꠚꠚꠚꠚꠚꠚꠚꠚꠚꠚꠚꠚꠚꠚꠚꠚꠚꠚꠚ
Intensity UniGene Description Tags
ꠏꠏꠏꠏꠏꠏꠏꠏꠏꠏꠏꠏꠏꠏꠏꠏꠏꠏꠏꠏꠏꠏꠏꠏꠏꠏꠏꠏꠏꠏꠏꠏꠏꠏꠏꠏꠏꠏꠏꠏꠏꠏꠏꠏꠏꠏꠏꠏꠏꠏꠏꠏꠏꠏꠏꠏꠏꠏꠏꠏꠏꠏꠏꠏꠏꠏꠏꠏꠏꠏꠏꠏꠏꠏꠏꠏꠏꠏꠏꠏꠏꠏꠏꠏꠏꠏꠏꠏꠏꠏꠏꠏꠏꠏꠏꠏꠏꠏꠏꠏꠏꠏꠏꠏꠏꠏꠏꠏꠏꠏꠏ
4,079 Hs.431927 ribosomalprotein L21 249
3,793 Hs.279652 mitochondrialribosomal protein L4 23
3,767 Hs.48516 beta-2-microglobulin 41
3,731 Hs.10306 naturalkiller cell group 7 sequence 97
3,715 Hs.356371 ribosomalprotein L28 256
3,691 Hs.233936 myosinregulatory light chain 23
3,526 Hs.115808 leukocyte-associatedIg-like receptor 1 23
3,410 Hs.76067 heatshock 27kDa protein 1 6
ꠏꠏꠏꠏꠏꠏꠏꠏꠏꠏꠏꠏꠏꠏꠏꠏꠏꠏꠏꠏꠏꠏꠏꠏꠏꠏꠏꠏꠏꠏꠏꠏꠏꠏꠏꠏꠏꠏꠏꠏꠏꠏꠏꠏꠏꠏꠏꠏꠏꠏꠏꠏꠏꠏꠏꠏꠏꠏꠏꠏꠏꠏꠏꠏꠏꠏꠏꠏꠏꠏꠏꠏꠏꠏꠏꠏꠏꠏꠏꠏꠏꠏꠏꠏꠏꠏꠏꠏꠏꠏꠏꠏꠏꠏꠏꠏꠏꠏꠏꠏꠏꠏꠏꠏꠏꠏꠏꠏꠏꠏꠏ RU, resonance unit; RF, rheumatoid factor; ESR, erythrocyte sedimentation rate; ND, not done 1:100 diluted joint fluids were injected onto the CM5 sensor chips followed by the running buffer. Specific binding signals were obtained by subtraction of nonspecific signals from binding on BSA-immobilized flow cells. Laboratory test results were shown.
get sequence from the poly A tail; secondary struc-tures with the target sequence; variations in pin geo-metry; leading to different amounts of DNA hybridizing within different non-specific hybridization; variations in exposure of different portions of the slide to the hy-bridization solution; efficiencies in dye incorporation; and cross-reactivity of the probe with other transcripts, each of which may influence detection (Schuchhardt, et al., 2000). Since there are a large number of fac-tors that contribute to experimental error and biologi-cal variation, replicate experiments are needed to normalize the data (Lee et al., 2000).
On the other hand, SAGE may under-perform be-cause specific transcripts may be missed due to the absence of a recognition site for the anchoring enzyme or CG-content bias (Margulies et al., 2001). In addi-tion, incorrect tag counts can arise from incomplete digestion or alternative polyadenylation, giving rise to multiple tags derived from a single transcript. More-over, some of the transcript can be matched multiply. To increase tag length, Rsa I and Bsm FI were often used in SAGE library construction. That would gener-ate 14 bp tags (Ryo et al., 2000), together with GTAC (Rsa I site sequence), total 18 bp stretch should be conveniently used for matching Unigene library. Also, sequencing errors, especially in the population of tags encountered only once, can contribute to the dif-ferences between SAGE and MAGIC II chip data. In this study, the number of gene tags analyzed was not sufficient to cover the entire set of mRNAs in a single cell type. Therefore, statistical significance is not ro-bust for those genes expressed at a low level. Name-ly, even when 300,000 tags were analyzed, there was a 92% chance of detecting a tag for transcripts when the expression on average was at least three copies per cell (Zhang et al., 1997).
The fold-changes of expression megakaryocytes/ non-megakaryocytes were comprared. The correlation could not be observed between two platforms, but the pattern in terms of increasing or decreasing was kept (data not shown). The overall expression fold-changes by MAGIC II chip had tendency of high value than that by SAGE. The causes of such pattern might be from the high incorporation efficiencies of Cy5-UTP, and the preference of the Cy5-labelled probes in the hybridization procedure. The higher quantum yield of the Cy5 fluorophore might also be contributed (Gruber et al., 2000; t Hoen et al., 2003).
This is the first report showing their quantitative analyses in spotted microarray using competitive hy-bridization. This study suggested that the expression intensities from a single channel of oligonucleotide- microarray technology reliable to detect medium- to-high abundant transcripts in absolute expression analyses, and would be appropriate as a platform to build a gene expression database, but the
determi-ning the fold-changes of expression needs other te-chnologies of transcript analysis.
Acknow ledgem ent
This study was supported by a grant of the Korea Health 21 R&D Project, Ministry of Health & Welfare, Republic of Korea (HMP-00-CH-04-0004).
R eferences
Brown PO, Botstein D. Exploring the new world of the genome with DNA microarrays. Nat Genet 1999;21:33-7 Datson NA, van der Perk-de Jong J, van den Berg MP, de Kloet ER, Vreugdenhil E. MicroSAGE: a modified procedure for serial analysis of gene expression in limited amounts of tissue. Nucleic Acids Res 1999;27:1300-7
Evans SJ, Datson NA, Kabbaj M, Thompson RC, Vreugdenhil E, De Kloet ER, Watson SJ, Akil H. Evaluation of Affymetrix Gene Chip sensitivity in rat hippocampal tissue using SAGE analysis. Serial Analysis of Gene Expression. Eur J Neurosci 2002;16:409-13
Gruber HJ, Hahn CD, Kada G, Riener CK, Harms GS, Ahrer W, Dax TG, Knaus HG. Anomalous fluorescence enhance-ment of Cy3 and cy3.5 versus anomalous fluorescence loss of Cy5 and Cy7 upon covalent linking to IgG and non-covalent binding to avidin. Bioconjug Chem 2000;11:696-704 Hughes TR, Mao M, Jones AR, Burchard J, Marton MJ, Shannon KW, Lefkowitz SM, Ziman M, Schelter JM, Meyer MR, Kobayashi S, Davis C, Dai H, He YD, Stephaniants SB, Cavet G, Walker WL, West A, Coffey E, Shoemaker DD, Stoughton R, Blanchard AP, Friend SH, Linsley PS. Expr-ession profiling using microarrays fabricated by an ink-jet oligonucleotide synthesizer. Nat Biotechnol 2001;19:342-7 Ishii M, Hashimoto S, Tsutsumi S, Wada Y, Matsushima K, Kodama T, Aburatani H. Direct comparison of GeneChip and SAGE on the quantitative accuracy in transcript profiling analysis. Genomics 2000;68:136-43
Kane MD, Jatkoe TA, Stumpf CR, Lu J, Thomas JD, Madore SJ. Assessment of the sensitivity and specificity of oligo-nucleotide (50mer) microarrays. Nucleic Acids Res 2000; 28:4552-7
Kim JA, Jung YJ, Seoh JY, Woo SY, Seo JS, Kim HL. Gene expression profile of megakaryocytes from human cord blood CD34+ cells ex vivo expanded by thrombopoietin. Stem Cells
2002;20:402-16
Lee ML, Kuo FC, Whitmore GA, Sklar J. Importance of re-plication in microarray gene expression studies: statistical methods and evidence from repetitive cDNA hybridizations. Proc Natl Acad Sci USA 2000;97:9834-9
Lockhart DJ, Dong H, Byrne MC, Follettie MT, Gallo MV, Chee MS, Mittmann M, Wang C, Kobayashi M, Horton H, Brown EL. Expression monitoring by hybridization to high- density oligonucleotide arrays. Nat Biotechnol 1996;14:1675- 80
DNA arrays. Nature 2000;405,827-36
Margulies EH, Kardia SL, Innis JW. Identification and pre-vention of a GC content bias in SAGE libraries. Nucleic Acids Res 2001;29:E60
Noordewier MO, Warren PV. Gene expression microarrays and the integration of biological knowledge. Trends Bio-technol 2001;19:412-5
Rininger JA, DiPippo VA, Gould-Rothberg BE. Differential gene expression technologies for identifying surrogate mark-ers of drug efficacy and toxicity. Drug Discov Today 2000; 5:560-8
Ryo A, Kondoh N, Wakatsuki T, Hada A, Yamamoto N, Yamamoto M. A modified serial analysis of gene expression that generates longer sequence tags by nonpalindromic cohesive linker ligation. Anal Biochem 2000;277:160-2
Schuchhardt J, Beule D, Malik A, Wolski E, Eickhoff H, Lehrach H, Herzel H. Normalization strategies for cDNA microarrays. Nucleic Acids Res 2000;28:E47
Southern E, Mir K, Shchepinov M. Molecular interactions on microarrays. Nat Genet 1999;21(supple 1):5-9
t Hoen PA, de Kort F, van Ommen GJ, den Dunnen JT. Fluorescent labelling of cRNA for microarray applications. Nucleic Acids Res 2003;31:e20
Velculescu VE, Zhang L, Vogelstein B, Kinzler KW. Serial analysis of gene expression. Science 1995;270:484-7 Zhang L, Zhou W, Velculescu VE, Kern SE, Hruban RH, Hamilton SR, Vogelstein B, Kinzler KW. Gene expression profiles in normal and cancer cells. Science1997;276:1268- 72