저작자표시-비영리-변경금지 2.0 대한민국 이용자는 아래의 조건을 따르는 경우에 한하여 자유롭게 l 이 저작물을 복제, 배포, 전송, 전시, 공연 및 방송할 수 있습니다. 다음과 같은 조건을 따라야 합니다: l 귀하는, 이 저작물의 재이용이나 배포의 경우, 이 저작물에 적용된 이용허락조건 을 명확하게 나타내어야 합니다. l 저작권자로부터 별도의 허가를 받으면 이러한 조건들은 적용되지 않습니다. 저작권법에 따른 이용자의 권리는 위의 내용에 의하여 영향을 받지 않습니다. 이것은 이용허락규약(Legal Code)을 이해하기 쉽게 요약한 것입니다. Disclaimer 저작자표시. 귀하는 원저작자를 표시하여야 합니다. 비영리. 귀하는 이 저작물을 영리 목적으로 이용할 수 없습니다. 변경금지. 귀하는 이 저작물을 개작, 변형 또는 가공할 수 없습니다.
Master
’s Thesis in the Department of Biomedical
Sciences
Neuronal Changes in Lactate
Dehydrogenase B Deficiency Mice
Ajou University Graduate School
Major in Neuroscience
Neuronal Changes in Lactate
Dehydrogenase B Deficiency Mice
Supervised by
Jin Soo Lee, MD, Ph.D.
I submit this thesis as the Master’s thesis in the
Department of Biomedical Sciences.
August, 2018
Ajou University Graduate School
Major in Neuroscience
Bok Seon Yoon
The Master
’s thesis of Bok Seon Yoon in the Department
of Biomedical Sciences in hereby approved.
Thesis Defense Committee President
Member Jin soo Lee seal
Member Ji Man Hong seal
Member Chan Bae Park seal
Ajou University Graduate School
June, 19st, 2018
i -Abstract -
Neuronal Changes in Lactate Dehydrogenase B Deficiency Mice
The main energy source of the brain is glucose; however, it has been reported that neurons also metabolize lactate. Lactate is an anion that is supplied by astrocytes, as described by the astrocyte-to-neuron lactate shuttle hypothesis. Lactate dehydrogenase B (LDHB), contained within neurons, converts lactate to pyruvate to be utilized as an energy source. Accordingly, the utilization of lactate as energy source by neurons of LDHB knock-out (KO) mice may be limited. We hypothesized that a deficiency in LDHB would decrease neuronal function and induced histological changes in LDHB KO mice.
Behavioral tests included an open field test, a Morris water maze test, and a Y maze test, which were performed at 15-18 months of age. We analyzed histological alterations in hippocampal neurons and glial cells using cresyl violet staining for quantification of cell numbers, and identified oxidative stress markers (e.g., nitrotyrosine and 8-hydroxy-deoxyguanosine). We also compared lactate peaks in the hippocampus using magnetic resonance spectroscopy. Histological tests and magnetic resonance spectroscopy were performed at 19-22 months of age.
As results, the open field test revealed decreased locomotor motion LDHB KO mice compared to WT mice. Moreover, the Morris water maze test showed diminished spatial memory and non-spatial memory in LDHB KO mice compared to WT mice. The histological analyses showed that neuronal cells in LDHB KO mice appeared smaller and darker than that of WT mice. In addition, there were fewer astrocytes in the hippocampus of LDHB KO mice. Expression of the reactive oxygen species-related marker, 3-nitrotyrosine, tended to increase in the neurons of LDHB KO mice
ii
compared to WT mice. Magnetic resonance spectroscopy results showed increased ratio of hippocampal lactate/ N-acetyl aspariitate ratio in LDHB KO mice compared to WT mice.
The increase of reactive oxygen species found in hippocampal neurons might mediate the observed alterations in neuronal morphology and behavioral deterioration, and ultimately, could result in the acceleration of brain aging in aged LDHB KO mice.
Key word: lactate dehydrogenase B, knock-out mice, lactate, reactive oxygen species, neurons, astrocytes
iii
TABLE OF CONTENTS
ABSTRACT
... iTABLE OF CONTENTS
... iiiLIST OF FIGURES
... vI.
INTRODUCTION
... 1II.
MATERIALS AND METHODS
... 8A. Animal care and study time frame ... 8
B. Magnetic resonance spectroscopy ... 8
C. Behavior test ... 9
(1) Moriis water maze test ... 9
(2) Open field test ... 9
(3) Y maze test ... 9
(4) Novel object recognition test ... 10
D. Tissue processing ... 10
E. Cresyl violet staining ... 11
F. Immunohistochemistry ... 11
G. Statistical analysis ... 12
III.
RESULTS
... 13iv
2. Neuronal morphological change ... 16
3. Astrocyte and microglia ... 19
4. Oxidative stress ... 21 5. Glucose trnasporter 3... 23 6. MR spectroscopic analysis ... 25 IV. DISCUSSION ... 27 V. REFFERENCES ... 32 국문요약 ... 37
v
LIST OF FIGURES
Figure 1. Schematic representation of glucose metabolism ... 2
Figure 2. Differential utilization of glucose in astrocytes and neurons ... 3 Figure 3. Schematic representation of the astrocyte-neuron lactate shuttle (ANLS) ... 5 Figure 4. Lactate dehydrogenases (LDH) ... 7 Figure 5. Behavior is impaired in LDHB KO mice compared to WT mice ... 14 Figure 6. Dark neurons frequently seen in the LDHB KO mice compared to WT mice ... 17 Figure 7. Immunohistochemistry of astrocytes and microglia in the stratum radiatum near CA1 of hippocampus ... 20 Figure 8. Immunohistochemistry detection of oxidative stress makers in LDHB KO mice ... 22 Figure 9. Immunohistochemistry detection of glucose transporter 3 (GLUT3) in hippocampal pyramidal cell layer in LDHB KO mice ... 24 Figure 10. Lactate levels was increased in the LDHB KO mice brain ... 26 Figure 11. Abnormal energy metabolism of the brain in aged LDHB KO mice ... 31
1
I. Introduction
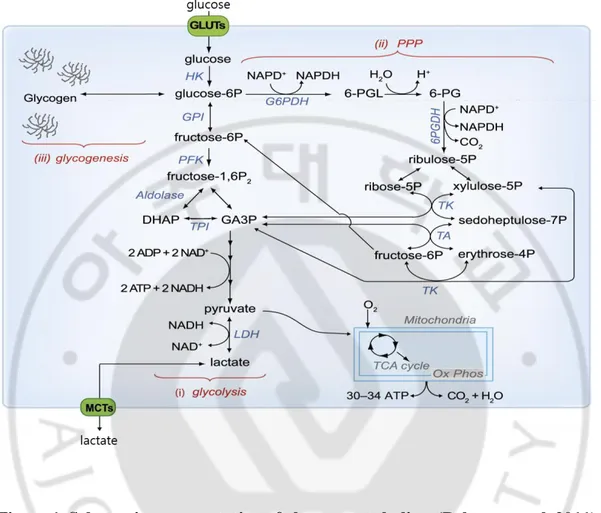
The average human brain is only approximately 2% of the body weight, but it consumes approximately 25% of the total energy in the body at rest (Attwell and Laughlin 2001, Molina and DiMaio 2012). Brain metabolism is a high requirement for glucose and oxygen. The brain energy source is primarily glucose (Erbsloh, Bernsmeier et al. 1958, Mergenthaler, Lindauer et al. 2013) and the generation of ATP by the aerobic metabolism. Glucose enters the cell through glucose transporters (GLUTs) and is phosphorylated by HK to produce glucose-6-phosphate (glucose-6P). Glucose-6P can be processed into three major metabolic pathways. First, it is metabolism through glycolysis. Pyruvate produced by the peritoneal process enters the mitochondria and consumes oxygen, metabolizes through the tricarboxylic acid (TCA) cycle and oxidative phosphorylation (Ox Phos) to produce energy. Pyruvate is also reduced to lactate by lactate dehydrogenase (LDH) and lactate release in the extracellular via monocarboxylate transporters (MCT). Secondly, Glucose-6P is processed through the pentose phosphate pathway (PPP) to produce the reductase in the form of NADPH. PPP and its processes are associated at the levels of glyceraldehyde-3-phosphate (GA3P) and fructose-6-phosphate (fructose-6P). Finally, in astrocytes, glucose-6P can be used to store glycogen (Figure 1. Belanger et al, 2011).
2
Figure 1. Schematic representation of glucose metabolism (Belanger et al, 2011).
GPI, glucose-6-phosphate isomerase; PFK, phosphofructokinase-1; Fructose-1,6-P2, fructose-1,6-bisphosphate; DHAP, dihydroxyacetone phosphate; TPI, triose phosphate isomerase; G6PDH, glucose-phosphate dehydrogenase; PGL, 6-phosphoglucono-d-lactone; 6-PG, 6-phosphogluconate; 6 PGDH, 6-phosphogluconate dehydrogenase; ribulose-5P, ribulose-5-phosphate; ribose-5P, ribose-5-phosphate; xylulose-5P, xylulose-5-phosphate; TK, transketolase; sedoheptulose-7P, sedoheptulose-7-phosphate; TA, transaldolase; and erythrose-4P, erythrose-4-phosphate.
3
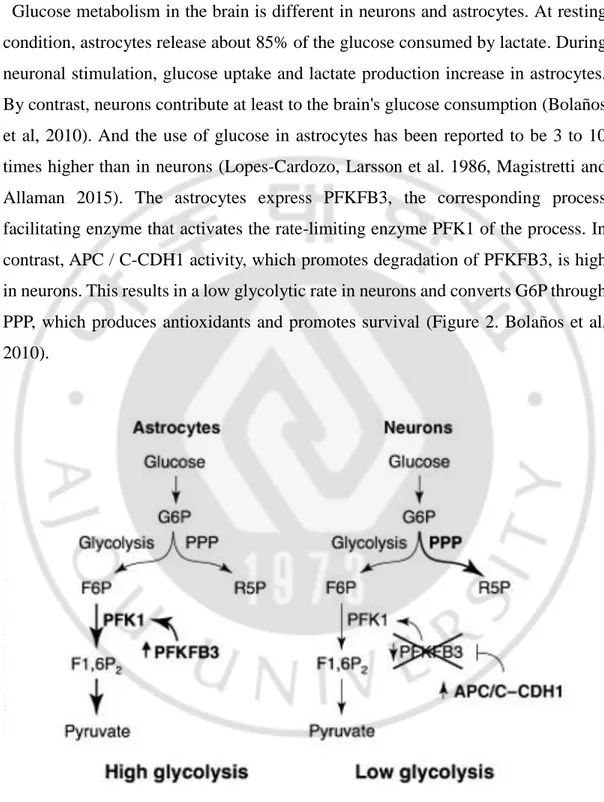
Glucose metabolism in the brain is different in neurons and astrocytes. At resting condition, astrocytes release about 85% of the glucose consumed by lactate. During neuronal stimulation, glucose uptake and lactate production increase in astrocytes. By contrast, neurons contribute at least to the brain's glucose consumption (Bolaños et al, 2010). And the use of glucose in astrocytes has been reported to be 3 to 10 times higher than in neurons (Lopes-Cardozo, Larsson et al. 1986, Magistretti and Allaman 2015). The astrocytes express PFKFB3, the corresponding process facilitating enzyme that activates the rate-limiting enzyme PFK1 of the process. In contrast, APC / C-CDH1 activity, which promotes degradation of PFKFB3, is high in neurons. This results in a low glycolytic rate in neurons and converts G6P through PPP, which produces antioxidants and promotes survival (Figure 2. Bolaños et al, 2010).
Figure 2. Differential utilization of glucose in astrocytes and neurons (Bolaños et al, 2010).
4
F6P, fructose-6-phosphate; F1,6P2, fructose-1,6-bisphosphate; G6P, glucose-6-phosphate; R5P, ribulose-5-phosphate.
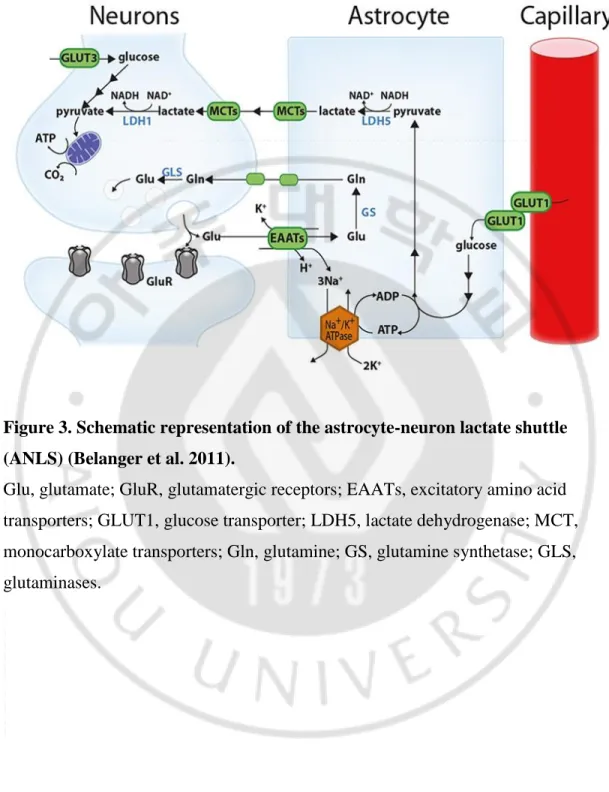
This difference in glucose metabolism between neurons and astrocytes is explained by the astrocyte-to-neuron lactate shuttle (ANLS) model (Pellerin and Magistretti 1994). According to this model, the glutamate (Glu) released from the synapse activates the glutamate receptor (GluR) and is associated with energy consumption in the nerve compartment. Most of the synaptic released glutamate enters the astrocytes with Na + ions via the excitatory amino acid transporter (EAAT, more specifically GLT-1 and GLAST). This Na + consumes ATP by the action of Na + / K + ATPase. The glutamate that enters the astrocyte is converted to glutamine (gln) by the action of glutamine synthetase (GS), and then to neurons and is converted to glutamate by glutaminase (GLS). This leads to glucose utilization through the GLUT1 glucose transporter of astrocyte and is metabolized to pyruvate through glycolysis. The pyruvate is then converted to lactate by the LDHA (LDH5) enzyme, and transferred to the neuron via a monocarboxylate transporter. Then, in the neuron, the LDHB (LDH1) enzyme converts lactate into pyruvate and produces the necessary energy through the mitochondrial tricarboxylic acid (TCA) cycle. Neurons can also absorb glucose through the glucose transporter 3 (Figure 3) (Belanger, Allaman et al. 2011, Newington, Harris et al. 2013).
5
Figure 3. Schematic representation of the astrocyte-neuron lactate shuttle (ANLS) (Belanger et al. 2011).
Glu, glutamate; GluR, glutamatergic receptors; EAATs, excitatory amino acid transporters; GLUT1, glucose transporter; LDH5, lactate dehydrogenase; MCT, monocarboxylate transporters; Gln, glutamine; GS, glutamine synthetase; GLS, glutaminases.
6
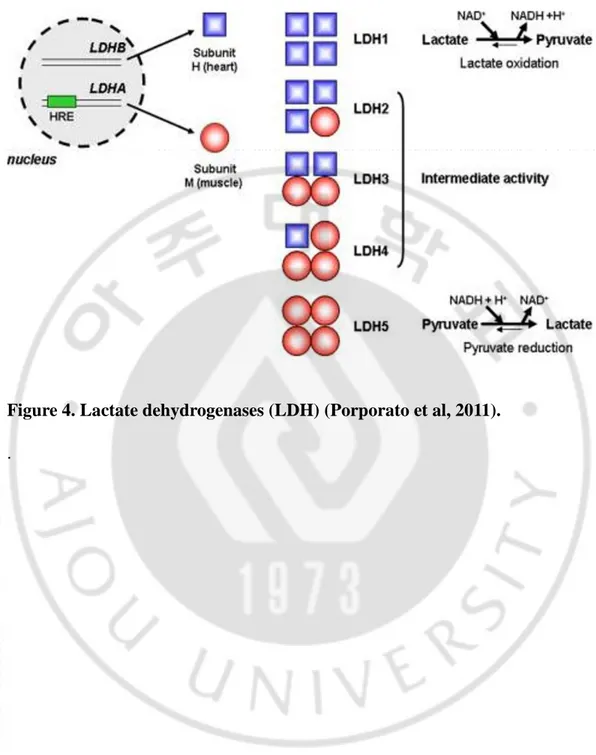
The lactate dehydrogenase (LDH) enzyme is one of the key molecules of ANLS. LDH is an intracellular enzyme found in various human tissue such as brain, skeletal muscle, heart, liver, kidneys and mediates the inter-conversion of pyruvate and lactate (Sharma, Jain et al. 2010). LDH is composed of two subunits, LDHA (subunit M) and LDHB (subunit H). The LDH-B gene is constitutively transcribed and encodes the LDH-H subunit, while the transcription of the LDH-A gene, which is induced by hypoxia, encodes the LDH-M subunits. When the subunits are arranged in a tetrameric form, five different isoenzymes of LDH1 to LDH5 can be formed.
LDH1 isoenzyme consists of four LDHB subunits and LDH5 isoenzyme consists of four LDHA subunits. LDH5 / LDH-4M preferentially catalyzes the reduction of pyruvate to lactate, LDH1 / LDH-4H preferentially catalyzes the oxidation of lactate to pyruvate, and LDH2, LDH3 and LDH4 have intermediate enzymatic activities (Figure 4. Porporato et al, 2011). The expression of LDH in the hippocampus or cortex of the human brain is different according to cell types. LDHA is mainly present in astrocytes and LDHB is present in neurons (Bittar, Charnay et al. 1996, Porporato, Dhup et al. 2011).
Recently, it was reported that when animals age, the ratio of LDHA to LDHB changes, which alters the energy consumption pattern allowing lactate to be used as a marker of aging (Larsson 2010, Ross, Oberg et al. 2010). Aging is associated with structural and physiological changes of brain that can lead to behavioral changes and brain diseases. Furthermore, aging is also the most common risk factor for developing brain disease (Prince, Bryce et al. 2013, Ojo, Rezaie et al. 2015). With such changes, the occurrence of neurodegenerative disorders tends to increase, resulting in reduced psychomotor speed, mental flexibility, and memory reduction (Barnes 2015).
In the current study, we would like to evaluate neuronal changes and aging-like behaviors are seen when LDHB, an important enzyme converting lactate to pyruvate in neuron, is depleted by using its knock-out mice.
7
Figure 4. Lactate dehydrogenases (LDH) (Porporato et al, 2011).
8
II. MATERIALS AND METHODS
A. Animal care and study time frame
We used aged male LDHB knock out (KO) mice and aged wild type (WT) mice (14-17 months) obtained from another laboratory (Professor Chan Bae Park, Ajou University School of Medicine, Suwon, South Korea). Whole body LDHB KO mice were generated by inactivation of LDHB gene by cre/loxP system in the C57BL/6 background. Animal protocols were approved by the Laboratory Animal Research Center of Ajou University Medical Center. Mice were kept in cages maintained at constant temperature (22±2℃) and humidity (55±10%), under light-controlled conditions (lights on from 7:00 to 19:00 h), with ad libitum food and water. Behavior tests were performed at 15-18 months of age and histological tests and magnetic resonance spectroscopy were performed at 19-22 months of age.
B. Magnetic resonance spectroscopy
Magnetic resonance spectroscopy was evaluated with additional mice (WT n=6, KO n=7). Using a vaporizer, the mice were anesthetized with a mixture of 2% isoflurane in 70% nitrous oxide and 30% oxygen. Rectal temperature was controlled during anesthetization and was maintained at 37.0±0.5℃ by an automated heating pad connected to a rectal probe. For magnetic resonance spectroscopy, a 15.2 T small animal MRI machine was used in the Center for Neuroscience Imaging Research of Sungkyunkwan University (Bruker, Germany). A 60 mm volume coil was used for excitation, and a quadrature surface coil of 18 mm was used for signal detection (Bruker). A single voxel-sized image was centered 2 X 2 X 2 mm3 over the right hippocampus. Magnetic resonance spectroscopy scans were acquired using a Point-Resolved Spin Echo Sequence (PRESS) method, an echo time of 35 ms with a total acquisition time of 10 min (TR/TE = 2500/3.5 ms, 256 averages) for the metabolite spectrum with water suppressed. Metabolite spectra were determined by ratio of
9
lactate to N-acetyl aspartate using the Image J program.
C. Behavior test
(1) Morris water maze test
We used the Morris water maze to test spatial learning and memory. The apparatus consisted of a white pool with a diameter of 90 cm and a transparent platform (10 cm x 25 cm) submerged 1.0 cm below the water surface. Water temperature was kept at 22 ± 0.5℃ throughout testing. In the learning phase (days 1-5), three trials (60 sec per trial) a day were conducted with the hidden platform location kept constant, and all mices start from the same position. If a mouse failed to find the submerged platform within 60 sec, it was manually placed on the platform for 10 sec. After 5 days later, we recorded the time mice spent in the platform zone with the platform removed. Swim paths and other parameters were tracked and recorded using the video tracking system, Smart 3.0 software with the Panlab Harvard apparatus (Barcelona, Spain).
(2) Open field test
We examined movement using the open field test. The apparatus used in the test was constructed using a white acrylic box (40 cm x 40 cm x 30 cm). Mice were individually placed in the center of the chamber and allowed to freely explore for 1 min. We measured the locomotor activity of the mice in the field using automated video-tracking. Measurement of locomotor activity began immediately after placement in the chamber. The number of line crossings was determined by the number of times the right hind leg of the mouse touched the line of the field. We also recorded the number of times the mice moved and reared to confirm a change in movement.
10
We used the Y maze test to examine short term memory. The apparatus used in the test was made using a black acrylic box consisting of three arms joined in the middle in the shape of a ‘Y’. The end of each arm was differentiated by a distinct mark. The mice were placed in the middle of the Y maze and we recorded each arm that enters the body for 8 minutes. Spontaneous alternation was calculated as (actual alternation x 100%) / (total alternation-1).
(4) Novel object recognition test
We used an object recognition test to examine non-spatial working memory. The apparatus used in the test was constructed using a white acrylic box (40 cm x 40 cm x 30 cm). The objects to be discriminated between were made of plastic and were different shapes and colors (a blue cube and a black cylinder). The day prior to testing, we habituated the mice to the apparatus by allowing them to explore the box freely for 5 min. An hour before testing, the mice were allowed to explore two identical objects (blue cubes) for 10 min, and then allowed to explore a new object (black cylinder) for 3 min. The time spent for exploring familiar (F) and new (N) objects was automatically recorded using the video tracking system, Smart 3.0 software with the Panlab Harvard apparatus (Barcelona, Spain). A discrimination index (%) was calculated as (N –F / N + F) x 100. A preference of object (%) was calculated as (N / N + F) x 100.
D. Tissue processing
The mice were anesthetized, intraperitoneally, with 10% chloral hydrate and transcardially perfused with 1X phosphate buffered saline and 4% paraformaldehyde. The brains of the mice were removed and post fixed for at least 24 h in 4% paraformaldehyde at 4℃, and dehydrated with 30% sucrose. The brain tissue was cut into 20 μm coronal sections using a Leica cryostat and stored in a stock solution at 4℃.
11 E. Cresyl violet staining
For cresyl violet staining, the sections were mounted on coated slides and allowed to air-dry overnight. The mounted sections were rehydrated in distilled water, and stained in 0.1% cresyl violet solution for 5 min. The sections were rinsed in 70% ethanol and dehydrated in a graded series of ethanol and xylene, and then mounted with a vectamount and cover slipped. We quantified neuronal cells in the CA1 region of the hippocampus using a microscope (SMZ745T, Nikon, Japan) at a 200X magnification. While non-dark neurons refer to normal cells, dark neurons refer to abnormal cells with small and dense morphology (Ooigawa, Nawashiro et al. 2006). The total number of hippocampal CA1 cells was indicated by the sum of non-dark and dark neurons.
F. Immunohistochemistry
Brain tissue sections were mounted on slides and washed with phosphate buffered saline. Endogenous peroxidase activity was quenched using 0.3% hydrogen peroxide for 5 min and 0.25% tritonx-100 for 10 min. After 10% normal serum blocking for 1 h, the sections were incubated with 3-nitrotyrosine (dilution 1:200, 06-284, Millipore, USA), methylglyoxal (MG) (dilution 1:20, STA-011, Cell biolabs, USA), anti-8 hydroxyguanosine (dilution 1:500, ab62623, Abcam, USA), rabbit glial fibrillary acidic protein (GFAP) marker (dilution 1:500, Z0334, Dako, USA), Iba-1 (dilution 1:500, 019-10741, Wako, USA), and rabbit anti-glucose transporter-3 (GLUT3; dilution 1:500, AB40084, Abcam, USA) overnight at 4℃. After washing, the sections were incubated with biotinylated anti-rabbit IgG (BA-1000, Vector, USA) for 2 h, and ABC (PK-6100, Vector, USA) for 1 h. To detect other potential markers, after washing, the sections were incubated with Alexa Fluor 555 goat anti-rabbit IgG (A21428, Invitrogen, USA). Finally, sections were submerged in diaminobenzidine (DAB, SK-4100, Vector, USA) to visualize the signal.
12
Quantification of GLUT-3 density in the hippocampus was observed with a microscope (SMZ745T, Nikon, Japan) at a 400X magnification. Relative optical densities were measured using the mean gray value on an inverted black-white image. The percentage of density was measured using the mean density value provided by Image J program, and all data were normalized to the normal value.
G. Statistical analysis
The data are presented as means ± standard error of the mean (S.E.M.), evaluated by the Student's t-test with Graph Pad prism program. Differences were considered to be significant when value of less than 0.05.
13
III. RESULTS
1. Behavior changes
The behavioral tests used in the current study revealed several behavioral changes in LDHB KO mice. The open field test was performed to test locomotor activity. Regarding line crossing, time mobile, and rearing, the test results for LDHB KO mice were significantly decreased compared with WT mice (p < 0.05; Fig. 5A). For the object recognition test, the proportion of staying near new objects was about 70% for WT and 60% for LDHB KO mice, respectively, indicating LDHB KO mice have slightly lower preference for novel object and discrimination index than WT mice; however, there was no significant difference between the two groups (p = 0.5; Fig. 5B). Y maze was performed to evaluate short-term memory. There was no difference between the two groups (p = 0.9; Fig. 5C).
Morris water maze test was performed to test spatial learning and memory. Escape latency showed significant reduction in both KO and WT mice at the day increased. The latency decreased during the test days in KO mice than in WT mice; however, the difference was not statistically significant (repeated measures ANOVA, p = 0.414; Fig. 5D, left panel). When the platform was removed and the time spent in the quadrant zone and platform zone was recorded, LDHB KO mice spent less time compared to WT mice (p = 0.12; Fig. 5D, right panel).
15
Figure 5. Behavior is impaired in LDHB KO mice compared to WT mice. A.
Open field test for evaluating general locomotor activity. Significant decrease in movement is seen in line crossing and time spent mobile. B. Novel object recognition test for evaluating recognition memory, in which mice prefer a novel object. LDHB KO mice tend to decrease in preference to novel objects compared to the WT. C. Y
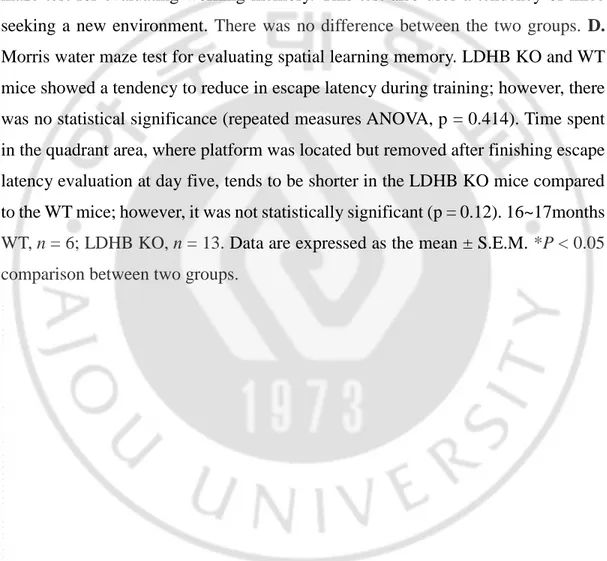
maze test for evaluating working memory. This test also uses a tendency of mice seeking a new environment. There was no difference between the two groups. D.
Morris water maze test for evaluating spatial learning memory. LDHB KO and WT mice showed a tendency to reduce in escape latency during training; however, there was no statistical significance (repeated measures ANOVA, p = 0.414). Time spent in the quadrant area, where platform was located but removed after finishing escape latency evaluation at day five, tends to be shorter in the LDHB KO mice compared to the WT mice; however, it was not statistically significant (p = 0.12). 16~17months
WT, n = 6; LDHB KO, n = 13. Data are expressed as the mean ± S.E.M. *P < 0.05 comparison between two groups.
16 2. Neuronal morphological change
The morphology of neuronal cells in the cerebral cortex and hippocampus was evaluated using cresyl violet staining. Total number of neuronal cells were similar; however, the number of dark neurons were more frequently observed in the LDHB KO mice than in the WT mice. The dark neurons were mostly seen in the CA1 of the
hippocampus but also seen in the cortex of LDHB KO mice (Fig. 6A-D). To quantify
CA1 cells, non-dark neurons (normal cell type) and dark neurons (abnormal cell type)
were counted. The number of dark neuron increased in the LDHB KO mice while
the number of normally-appeared neurons in hippocampus CA1 region was decreased in LDHB KO mice (p < 0.05; Fig. 6E).
18
Figure 6. Dark neurons frequently seen in the LDHB KO mice compared to WT mice. A, B. Morphological changes of hippocampal neurons using cresyl violet
staining. Smaller and darker neurons were more frequently seen in LDHB KO mice than in WT mice. C, D. Morphological change of the cortex. Similar morphological changes are seen in the cerebral cortex. E. The number of dark neurons increased in LDHB KO mice as compared to WT mice; however, total number of neuronal cells did not differ between groups. LDHB, lactate dehydrogenase B; DN, dark neuron; NDN, nondark neuron; TN, total neuron; magnification = 200X; A, C = WT mice;
B, D = LDHB KO mice; WT, n = 10; LDHB KO, n = 10 hemisphere. Data are expressed as the mean ± S.E.M. *p < 0.05, **p < 0.005 comparison between two groups.
19 3. Astrocyte and Microglia
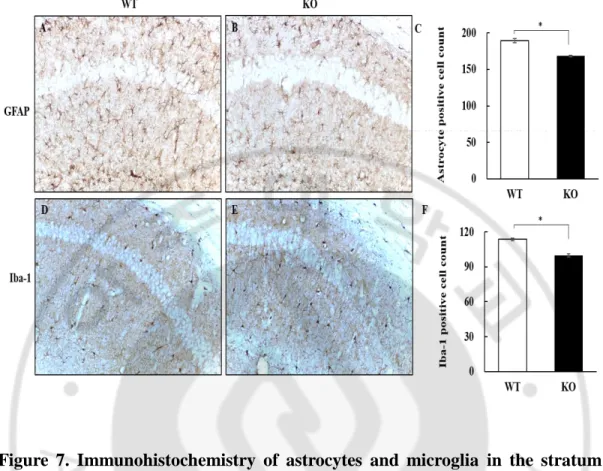
GFAP staining was performed to identify changes in astrocytes in the stratum radiatum near CA1 of hippocampus, where those cells were the most prominent. Regarding their morphology, astrocyte processes seemed to be decreased (Fig. 7A- B). In the stratum radiatum of the LDHB KO mice, the number of GFAP positive cells were significantly less (P = 0.035; Fig. 7C).
Iba-1 staining was performed to identify changes in microglial cells in the stratum radiatum of mice. While the shape of microglia did not show much difference between the two groups (Fig. 7D-E), the number of Iba-1 positive cells were significantly less in the stratum radiatum of the LDHB KO mice (p = 0.038; Fig. 7F).
20
Figure 7. Immunohistochemistry of astrocytes and microglia in the stratum radiatum near CA1 of hippocampus. A–B. The astrocytic processes seem to be
decreased in LDHB KO mice compared to WT mice. C. Quantification of GFAP-positive cells. D-E. The shape and number of Iba-1 GFAP-positive microglia were similar between the two groups. F. Quantification of Iba-1 positive cells. Astrocyte and microglia cell count of LDHB KO mice was significantly decreased compared to WT mice (p < 0.05). Data are expressed as the mean ± S.E.M. (n = 10 hemisphere). * p < 0.05. Magnification = 200X.
21
4. Oxidative stress
Increase of oxidative stress was evaluated by various oxidative stress markers. Each marker was observed to have an increased positive signal in the hippocampus
pyramidal layer of LDHB KO mice compared to WT mice. In the hippocampus CA1
of the LDHB KO mice, the intensity of neuronal 3-nitrotyrosine tended to be higher compared to WT mice, but it was statistically marginal (p = 0.059; Fig. 8A-C). Methylglyoxal was often observed in the dark neuronal cells in the hippocampus CA1 of the LDHB KO mice. The intensity of neuronal methylglyoxal tended to be higher compared to WT mice, but it was statistically insignificant between groups (p = 0.245; Fig. 8D–F). For 8-OhdG, which is associated with DNA oxidation in neuronal cells, the intensity of neuronal 8-OHdG at the hippocampal CA1 of the LDHB KO mice tended to be higher compared to WT mice (p = 0.051; Fig. 8G–I).
22
Figure 8. Immunohistochemistry detection of oxidative stress makers in LDHB KO mice. A-C. The intensity of 3-nitrotyrosine tends to increase in the hippocampal
pyramidal neurons of LDHB KO mice compared to WT mice (p = 0.059). D-F. A tendency of increase in methylglyoxal is shown in the neurons of LDHB KO mice; however, there was no statistical significance (p = 0.245). G-I. 8-OHdG level tended to increase in LDHB KO mice compared to WT mice (p = 0.051). Data are expressed as the mean ± S.E.M. (n = 10). Magnification = 100X. White box of left lower of figure = magnification of arrow-indicated area.
23 5. Glucose transporter 3 (GLUT3)
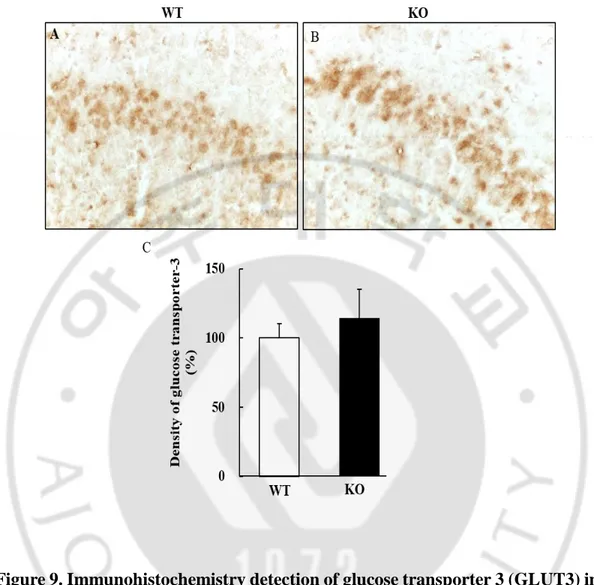
Expression of GLUT3 was confirmed to show glucose utilization. GLUT3 was mostly expressed in neurons in the hippocampal CA1 region (Fig. 9A, B); however, the intensity of GLUT3 did not show difference between the two groups (p = 0.735; Fig. 9C). Nevertheless, the higher intensities in GLUT3 appeared to be more prominent in the dark neurons.
24
Figure 9. Immunohistochemistry detection of glucose transporter 3 (GLUT3) in hippocampal pyramidal cell layer in LDHB KO mice. A-B. Cellular density of
GLUT3 appeared to increase in the smaller neurons of LDHB KO. This finding suggests that higher density might be more prominent in dark neurons C. Quantification of GLUT3 densities, however, did not differ between the neurons of LDHB KO and WT mice. Data are expressed as the mean ± S.E.M. (n = 10). Magnification = 400X
25 6. MR spectroscopic analysis
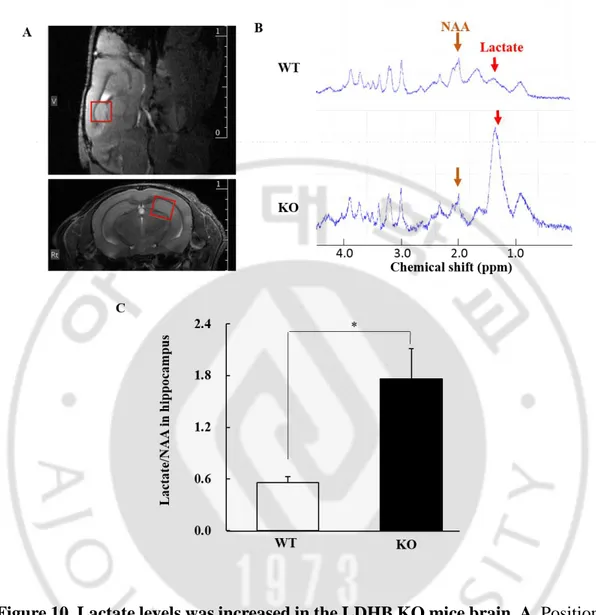
To evaluate changes in brain lactate levels, 1H-MRS was performed in the
hippocampus of aging mice (Fig. 10A). Lactate peak was identified at 1.33 ppm with higher lactate peaks in LDHB KO mice (Fig. 10B). When its levels were quantified as a ratio to N-acetyl aspartate, the lactate ratio in the hippocampus of the LDHB KO mice showed about 3 times higher levels in the hippocampus of LDHB KO mice than in WT mice (p < 0.005; Fig. 10C).
26
Figure 10. Lactate levels was increased in the LDHB KO mice brain. A. Position
of the volume of interest (2 mm x 2 mm x 2 mm) in the hippocampus in the sagittal and coronal plane. B. 1H-magnetic resonance spectroscopy obtained from the
hippocampus. The lactate peak is located at 1.3 ppm chemical shift whereas the N-acetyl aspartate (NAA) peak is located at 2.0 ppm chemical shift (red arrow = lactate; brown arrow = NAA). C. Quantification as a ratio of lactate to total NAA. LDHB KO mice show significantly elevated lactate ratio compared to WT mice. 20~24-month-old WT, n = 6; LDHB KO, n = 7 mice. Independent t-test, *p = 0.009.
27
IV. DISCUSSION
In the current study, we have examined whether a deficiency of the LDHB enzyme related to energy metabolism affects the behavior and pathologic findings of mice brain. We observed that locomotor activity decreased, and learning and memory were deteriorated in LDHB KO mice. These changes were accompanied by neuronal change with dark staining and small size but without loss of neuron cells, and decrease in astrocytic cell count. There was a tendency for elevation of oxidative stress markers, and a significant elevation of lactate/NAA ratio in the LDHB KO group. In conclusion, LDHB deficiency seems to aggravate neuronal and behavioral changes with a lack of lactate utilization in neurons. Overall, it is regarded that these changes related to one depletion of several neuronal energy metabolisms seem to be similar as a cross section of neuronal aging process.
Morphological changes in neuron and insignificant decrease in behavior
Many behavioral studies have shown that behavior is worsened by aging in normal animals (Hamezah, Durani et al. 2017). The cell morphologic changes underlying the behavioral changes seen in LDHB KO mice may be interpreted as findings that can be seen in aged mice. In our study, cognitive functions just tended to be decreased in LDHB KO mice without statistical significance. This finding is consistent with histological findings in that neuronal cell loss was not evident and total neuronal cell count did not differ between KO and WT mice. Nevertheless, following histological changes might influence the subtle behavioral changes. The increase of small dark cells without decrease in cell number in hippocampus and cortex, decrease of astrocytes, and increase of ROS is a common pathologic change in the LDHB KO mice. As animals age, cell atrophy occurs naturally, and is followed by cell death via apoptosis or necrosis. However, it has been reported that age is associated with changes in cell morphology but not overall number, and our study results are
28
consistent with these findings (Villena, Diaz et al. 1997, Kim, Kim et al. 2011, Stranahan, Jiam et al. 2012, Ojo, Rezaie et al. 2015).
ROS change
Changes in neuronal morphology may also result from the production of reactive oxygen species (ROS), which was generally increased in LDHB KO mice. Nitrotyrosine and 8-OHdG were increased in LDHB KO mice compared to WT mice. In both neurodegenerative disease as well as aging, a decline of normal antioxidant defense mechanisms has a harmful effect on cells and increases oxidative damage (Harman 1956, Dias, Lourenco et al. 2016, Garaschuk, Semchyshyn et al. 2018).
The level of methylglyoxal, however, did not significantly differ between KO and WT mice. Methylglyoxal, a byproduct of glycolysis, is the most powerful glycation agent in the cell, and its accumulation is harmful to the body. It is also a precursor to advanced glycation end (AGE) products, which are related to severe neurodegenerative disorders, diabetes complications, and aging. The glyoxalase system is of primary importance in protecting the brain against the accumulation of AGEs. Normal neurons have few glycolytic processes to protect them from oxidative stress, and glycolysis through astrocytes is predominant. In the process of glycolysis, methylglyoxal is produced and then its detoxification should be achieved through the glyoxalase system (Belanger, Yang et al. 2011, Allaman, Belanger et al. 2015).
Metabolism change
When GLUT-3 was used to examine the glucose utilization of neurons, we observed no significant difference between WT mice and LDHB KO mice. Although the neuronal glucose utilization is increased in aging, this finding is not sufficient to account for the increase in glycolysis. In relation to this, GLUT3 is initially decreased in normal aging according to age, and has been reported to increase at over 15 months. In addition, 3xTg mice were found to be more decline in glucose transporter than
29
normal mice and metabolism could be changed to ketogenic system (Ding, Yao et al. 2013).
Given that when glucose enters the cell, it is converted into glucose-6-p, it is used as a source for glycolysis, the pentose phosphate pathway (PPP), and glycogen synthesis. Glycolysis is controlled by catalysis by the enzymes hexokinase (HEX), phosphofructokinase (PFK) and pyruvate kinase (PK). The catalytic activity of PFK in cells is inhibited by increasing the proton concentration and the intracellular pH is the direct control mechanism. Neuron has a low concentration of PFK, so the process is inevitable. However, there is a possibility that the change in catalytic activity of PFK due to the increase of lactate (acidification) may have occurred.
The brain produces glycogen and lactate in astrocyte, whereas in neuron it is metabolized mainly through pentose phosphate pathway and consumes lactate. Pentose phosphate pathway is involved in biosynthesis and regeneration of nicotinamide adenine dinucleotide phosphate (NADPH) with glucose-6-p. This is also related to the GSH regeneration tube, which is an antioxidant mechanism in neurons (Fernandez-Fernandez, Almeida et al. 2012), (Deitmer, Theparambil et al. 2017). We can identify NADPH or GSH levels in the following experiments and identify them as changes in LDHB KO mice.
Another possibility is that LDHB KO mice use metabolic pathways that utilize forms of energy other than glucose. For example, when the body's glucose levels are low, ketone bodies produce energy by introducing lipids to be directly used in the TCA cycle in neuronal mitochondria (Owen. 2005), (Yao, Irwin et al. 2009, Yao, Hamilton et al. 2010). In LDHB KO mice, it can be explained that the neurons may utilize the more convenient ketone bodies as a source of energy.
Direct toxicity of lactate
1H-magnetic resonance spectroscopy results showed that lactate levels were
30
glycolysis in astrocytes is an essential metabolite for memory consolidation (Newman, Korol et al. 2011, Steinman, Gao et al. 2016), pathologically increased lactate production in transgenic rodent models such as APP/PS1 contributes to cognitive dysfunction associated with Alzheimer disease and promotes neuronal death (Harris, Tindale et al. 2016). The highly elevated lactate levels may also have toxic effects in our study.
It was also reported that the damage to the mitochondria slowly increases with age in brains of mice and causes changed expression in certain genes that are responsible for the accumulation of lactate (Ross, Oberg et al. 2010). An increase in intracerebral lactate, due to an abnormal rather than normal aging process, can lead to the production of reactive oxidative stress as well as the impairment of neuronal function, resulting in cognitive dysfunction (Ross, Oberg et al. 2010).
In conclusion, LDHB deficiency results in aging-like changes in behavior and cognitive function, suggesting the possibility of accelerating cerebral degenerative change by some abnormal energy metabolism (Figure. 11).
31
Figure 11. Abnormal energy metabolism of the brain in aged LDHB KO mice.
In the normal state, glucose from astrocyte produces lactate through glycolysis and goes to neuron and used as a mitochondrial energy (ANLS). By LDHB depletion, lactate is not utilized in neuron after transferred from astrocyte, and lactate accumulates in brain. In turn, this environment increases reactive oxygen species production, thereby promoting aging-like process of the animal.
32
V. REFFERENCES
1. Allaman, I., M. Belanger and P. J. Magistretti (2015). "Methylglyoxal, the dark side of glycolysis." Front Neurosci 9: 23.
2. Attwell, D. and S. B. Laughlin (2001). "An energy budget for signaling in the grey matter of the brain." J Cereb Blood Flow Metab 21(10): 1133-1145. 3. Barnes, J. N. (2015). "Exercise, cognitive function, and aging." Adv Physiol
Educ 39(2): 55-62.
4. Belanger, M., I. Allaman and P. J. Magistretti (2011). "Brain energy metabolism: focus on astrocyte-neuron metabolic cooperation." Cell Metab
14(6): 724-738.
5. Belanger, M., J. Yang, J. M. Petit, T. Laroche, P. J. Magistretti and I. Allaman (2011). "Role of the glyoxalase system in astrocyte-mediated neuroprotection." J Neurosci 31(50): 18338-18352.
6. Bittar, P. G., Y. Charnay, L. Pellerin, C. Bouras and P. J. Magistretti (1996). "Selective distribution of lactate dehydrogenase isoenzymes in neurons and astrocytes of human brain." J Cereb Blood Flow Metab 16(6): 1079-1089. 7. Bolanos JP, Almeida A, Moncada S (2010). "Glycolysis: a bioenergitic or a
survival pathway?" Trends Biochem Sci 35(3):145-9.
8. Deitmer, J. W., S. M. Theparambil, I. Ruminot and H. M. Becker (2017). "Our hungry brain: Which role do glial cells plays for the energy supply?" Neuroforum 23(1): A1-A8
9. Dias, C., C. F. Lourenco, E. Ferreiro, R. M. Barbosa, J. Laranjinha and A. Ledo (2016). "Age-dependent changes in the glutamate-nitric oxide pathway in the hippocampus of the triple transgenic model of Alzheimer's disease: implications for neurometabolic regulation." Neurobiol Aging 46: 84-95. 10. Ding, F., J. Yao, J. R. Rettberg, S. Chen and R. D. Brinton (2013). "Early
33
system in female aging and Alzheimer's mouse brain: implication for bioenergetic intervention." PLoS One 8(11): e79977.
11. Erbsloh, F., A. Bernsmeier and H. Hillesheim (1958). "[The glucose consumption of the brain & its dependence on the liver]." Arch Psychiatr Nervenkr Z Gesamte Neurol Psychiatr 196(6): 611-626.
12. Fernandez-Fernandez, S., A. Almeida and J. P. Bolanos (2012). "Antioxidant and bioenergetic coupling between neurons and astrocytes." Biochem J 443(1): 3-11.
13. Garaschuk, O., H. M. Semchyshyn and V. I. Lushchak (2018). "Healthy brain aging: Interplay between reactive species, inflammation and energy supply." Ageing Res Rev 43: 26-45.
14. Hamezah, H. S., L. W. Durani, N. F. Ibrahim, D. Yanagisawa, T. Kato, A. Shiino, S. Tanaka, H. A. Damanhuri, W. Z. W. Ngah and I. Tooyama (2017). "Volumetric changes in the aging rat brain and its impact on cognitive and locomotor functions." Exp Gerontol 99: 69-79.
15. Harman, D. (1956). "Aging: a theory based on free radical and radiation chemistry." J Gerontol 11(3): 298-300.
16. Harris, R. A., L. Tindale, A. Lone, O. Singh, S. L. Macauley, M. Stanley, D. M. Holtzman, R. Bartha and R. C. Cumming (2016). "Aerobic Glycolysis in the Frontal Cortex Correlates with Memory Performance in Wild-Type Mice But Not the APP/PS1 Mouse Model of Cerebral Amyloidosis." J Neurosci
36(6): 1871-1878.
17. Kim, J. H., E. L. Kim, Y. K. Lee, C. B. Park, B. W. Kim, H. J. Wang, C. H. Yoon, S. J. Lee and G. Yoon (2011). "Decreased lactate dehydrogenase B expression enhances claudin 1-mediated hepatoma cell invasiveness via mitochondrial defects." Exp Cell Res 317(8): 1108-1118.
18. Larsson, N. G. (2010). "Somatic mitochondrial DNA mutations in mammalian aging." Annu Rev Biochem 79: 683-706.
34
19. Lopes-Cardozo, M., O. M. Larsson and A. Schousboe (1986). "Acetoacetate and glucose as lipid precursors and energy substrates in primary cultures of astrocytes and neurons from mouse cerebral cortex." J Neurochem 46(3): 773-778.
20. Magistretti, P. J. and I. Allaman (2015). "A cellular perspective on brain energy metabolism and functional imaging." Neuron 86(4): 883-901. 21. Mergenthaler, P., U. Lindauer, G. A. Dienel and A. Meisel (2013). "Sugar
for the brain: the role of glucose in physiological and pathological brain function." Trends Neurosci 36(10): 587-597.
22. Molina, D. K. and V. J. DiMaio (2012). "Normal organ weights in men: part II-the brain, lungs, liver, spleen, and kidneys." Am J Forensic Med Pathol
33(4): 368-372.
23. Newington, J. T., R. A. Harris and R. C. Cumming (2013). "Reevaluating Metabolism in Alzheimer's Disease from the Perspective of the Astrocyte-Neuron Lactate Shuttle Model." J Neurodegener Dis 2013: 234572.
24. Newman, L. A., D. L. Korol and P. E. Gold (2011). "Lactate produced by glycogenolysis in astrocytes regulates memory processing." PLoS One 6(12): e28427.
25. Ojo, J. O., P. Rezaie, P. L. Gabbott and M. G. Stewart (2015). "Impact of age-related neuroglial cell responses on hippocampal deterioration." Front Aging Neurosci 7: 57.
26. Ooigawa, H., H. Nawashiro, S. Fukui, N. Otani, A. Osumi, T. Toyooka and K. Shima (2006). "The fate of Nissl-stained dark neurons following traumatic brain injury in rats: difference between neocortex and hippocampus regarding survival rate." Acta Neuropathol 112(4): 471-481. 27. Owen, Oliver E (2005). “Ketone bodies as a fuel for the brain during
starvation." Biochemistry and molecular biology eoucation 33(4): 246-251 28. Pellerin, L. and P. J. Magistretti (1994). "Glutamate uptake into astrocytes
35
stimulates aerobic glycolysis: a mechanism coupling neuronal activity to glucose utilization." Proc Natl Acad Sci U S A 91(22): 10625-10629. 29. Porporato, P. E., S. Dhup, R. K. Dadhich, T. Copetti and P. Sonveaux (2011).
"Anticancer targets in the glycolytic metabolism of tumors: a comprehensive review." Front Pharmacol 2: 49.
30. Prince, M., R. Bryce, E. Albanese, A. Wimo, W. Ribeiro and C. P. Ferri (2013). "The global prevalence of dementia: a systematic review and metaanalysis." Alzheimers Dement 9(1): 63-75.e62.
31. Ross, J. M., J. Oberg, S. Brene, G. Coppotelli, M. Terzioglu, K. Pernold, M. Goiny, R. Sitnikov, J. Kehr, A. Trifunovic, N. G. Larsson, B. J. Hoffer and L. Olson (2010). "High brain lactate is a hallmark of aging and caused by a shift in the lactate dehydrogenase A/B ratio." Proc Natl Acad Sci U S A
107(46): 20087-20092.
32. Sharma, P. R., S. Jain, R. N. Bamezai and P. K. Tiwari (2010). "Utility of serum LDH isoforms in the assessment of mycobacterium tuberculosis induced pathology in TB patients of Sahariya tribe." Indian J Clin Biochem
25(1): 57-63.
33. Steinman, M. Q., V. Gao and C. M. Alberini (2016). "The Role of Lactate-Mediated Metabolic Coupling between Astrocytes and Neurons in Long-Term Memory Formation." Front Integr Neurosci 10: 10.
34. Stranahan, A. M., N. T. Jiam, A. M. Spiegel and M. Gallagher (2012). "Aging reduces total neuron number in the dorsal component of the rodent prefrontal cortex." J Comp Neurol 520(6): 1318-1326.
35. Villena, A., F. Diaz, V. Requena, I. Chavarria, F. Rius and I. Perez de Vargas (1997). "Quantitative morphological changes in neurons from the dorsal lateral geniculate nucleus of young and old rats." Anat Rec 248(1): 137-141. 36. Yao, J., R. T. Hamilton, E. Cadenas and R. D. Brinton (2010). "Decline in mitochondrial bioenergetics and shift to ketogenic profile in brain during
36
reproductive senescence." Biochim Biophys Acta 1800(10): 1121-1126.
37. Yao, J., R. W. Irwin, L. Zhao, J. Nilsen, R. T. Hamilton and R. D. Brinton (2009). "Mitochondrial bioenergetic deficit precedes Alzheimer's pathology in female mouse model of Alzheimer's disease." Proc Natl Acad Sci U S A
37
-국문요약-
젖산 탈수소 효소 B 결핍 마우스에서 신경세포의 변화
뇌의 주요 에너지 원은 포도당이다. 그러나 신경세포는 주로 젖산을 대사하는 것으로 알려져 있다. 젖산은 astrocyte-neuron lactate shuttle (ANLS) 가설에 의해 설명된 바와 같이, 성상세포에 의해 신경세포로 공급된다. 신경세포 내에 함유된 젖산 탈수소 효소 B (LDHB)는 젖산을 피루브산으로 전환시켜 에너지원으로 이용한다. 따라서, LDHB KO 마우스의 신경세포에 의한 에너지 원으로서의 젖산 이용은 제한될 수 있다. 우리는 LDHB의 결핍이 LDHB KO 마우스에서 신경세포 기능 감소와 조직학적 변화가 있을 것이라고 가설을 세워 본 실험을 진행하였다.
Open field, Morris water maze, Y maze 테스트를 포함한 행동실험은 15-18개월에 수행하였다. 19-22 개월의 마우스에서 세포 수의 정량화를 위해 cresyl violet 염색을 사용하여 해마 신경세포와 성상세포의 조직학적 변화를 분석하였고 산화 스트레스 마커 (예: nitrotyrosine과 8-hydroxy-deoxyguanosine)를 확인했다. 또한, 자기 공명 분광법을 사용하여 해마의 젖산 피크를 비교했다. 결과적으로 Open field 테스트는 WT 마우스에 비해 LDHB KO 마우스에서 운동성이 감소되었다. 또한, Morris water maze 테스트는 WT 마우스에 비해 LDHB KO 생쥐에서 공간기억 및 비공간 기억이 다소 감소한 경향이 나타났다. 조직학적 분석 결과 LDHB KO 마우스의 신경세포는 WT 마우스보다 작고 밀도가 높게 나타났다. 또한, LDHB KO 생쥐의 해마에서 성상세포가 줄어 들었다. 활성 산소 종 관련 마커 인 3-nitrotyrosine의 발현은 WT 마우스에 비해 LDHB KO 생쥐의 신경세포에서 증가하는 경향이 있었다. 자기 공명 분광법 결과는 WT 마우스에 비해 LDHB KO 생쥐에서 해마의 젖산/ N-acetyl
38 aspartate (NAA) 비율의 비율이 증가함을 나타냈다. 결론을 말하여 나이든 LDHB KO 마우스에서는 lactate의 증가와 활성 산소 종의 증가로 인해 신경세포의 형태변화 및 행동 저하를 야기하는 것으로 나타났다. 핵심어: 젖산 탈수소 효소 B, knock-out 마우스, 젖산, 활성 산소 종, 신경세 포, 성상세포