감사의 글
연구를 마무리할 즈음이 되어, 처음 대학원에 입학하면서 보존학의 기초부터 성실히 학습하여 앞으로 보존학의 발전에 기여할 수 있는 기회를 가지고 싶다는 마음가짐으로 시작했던 것을 돌이켜 봅니다. 학문을 깊이 있게 공부하기에는 짧은 기간일지도 모르지만, 제게는 귀중한 배움의 시간이 되었음을 감사하게 생각합니다. 본 논문이 완성되기까지 따뜻한 배려와 아낌 없는 가르침으로 이끌어 주시고 연구에 대한 열정과 보람을 알게 해 주신 지도교수 박성호 선생님께 진심으로 감사 드리며, 귀중한 시간을 내어 부족한 논문을 살펴주신 노병덕 교수님, 김광만 교수님께도 감사 드립니다. 아울러 수련 기간 및 대학원 과정 동안 많은 학문적인 가르침을 주실 뿐 아니라 사람을 돌보는 일을 하는 사람으로서의 모범을 보여 주신 이찬영 교수님, 이승종 교수님, 김의성 교수님, 정일영 교수님, 박정원 교수님, 신수정 교수님, 신유석 교수님께도 감사의 마음을 전합니다. 또한 수련 생활을 하면서 서로 의지하고 많은 힘이 되어 주었던 동기 김민영, 김유란, 신한얼 선생님과 보존과 선, 후배님들께도 고맙다는 말을 전하고 싶습니다. 마지막으로 언제나 저를 믿어주시고 큰 사랑을 베풀어 주시는 부모님과 동생과 함께 이 기쁨을 나누고 싶습니다. 2011년 6월 저자 씀차 례
그림 차례 ··· ⅲ 표 차례 ··· ⅳ 국문요약 ··· ⅴ Ⅰ. 서 론 ··· 1 Ⅱ. 재료 및 방법 ··· 5 1. 연구 재료 ··· 5 2. 연구 방법 ··· 7 가. 복합레진 시편 제작 ··· 7 나. Translucency parameter (TP) 측정 ··· 7 다. Light transmittance (%T) 측정 ··· 8 라. 통계 분석 ··· 9 Ⅲ. 결 과 ··· 10 1. Translucency parameter (TP) ··· 10 2. Light transmittance (%T) ··· 13 3. 두 가지 측정 방법을 이용한 결과간의 연관성 분석 ··· 20Ⅳ. 고 찰 ··· 23 1. 복합레진의 종류와 shade 에 따른 반투명도 ··· 23 2. 두 가지 측정 방법을 이용한 결과간의 연관성 ··· 27 Ⅴ. 결 론 ··· 29 참고 문헌 ··· 30 Abstract ··· 35
그림 차례
Figure 1. Schematic diagram of the apparatus for measuring light transmittance ··· 8
Figure 2. TP of composite materials in ascending order ··· 11
Figure 3. TP of composite materials ··· 12
Figure 4. TP of composite materials ··· 12
Figure 5. Light transmittance graph of BF ··· 14
Figure 6. Light transmittance graph of DF ··· 14
Figure 7. Light transmittance graph of ED ··· 15
Figure 8. Light transmittance graph of ES ··· 15
Figure 9. Light transmittance graph of GD ··· 16
Figure 10. Light transmittance graph of PR ··· 16
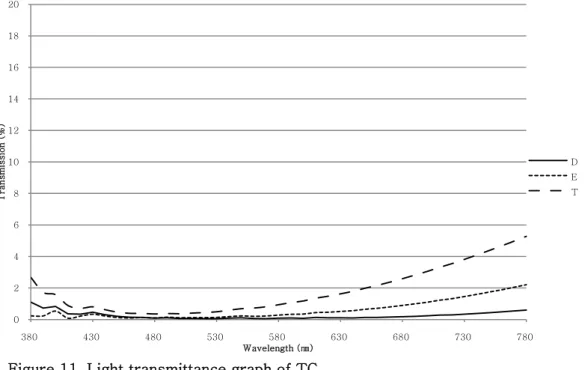
Figure 11. Light transmittance graph of TC ··· 17
Figure 12. %T of composite materials in ascending order ··· 18
Figure 13. %T of composite materials ··· 19
Figure 14. %T of composite materials ··· 19
표 차례
Table 1. Composite materials used in this study ··· 5
Table 2. Composition of composite materials ··· 6
Table 3. Result of two-way ANOVA (TP) ··· 10
Table 4. Translucency parameter (TP) of composite materials ··· 11
Table 5. Result of two-way ANOVA (%T) ··· 17
Table 6. Mean light transmittance (%T) of composite materials ··· 18
국 문 요 약
두 가지 평가 방법을 이용한
복합레진의 반투명도에 대한 평가
이번 연구의 목적은 복합레진의 translucency parameter (TP)와 light transmittance (%T)를 측정하여 1) 제조사별로 다른 7종의 복합레진 및 dentin, enamel, translucent의 세 가지 shade category 간에 반투명도의 차이가 있는지, 2) 두 가지 반투명도 평가 방법을 이용하여 얻어진 결과 사이에 연관성이 있는지를 알아보고자 함이다.
Beautifil II(BF), Denfil(DF), Empress Direct(ED), Estellite Sigma Quick(ES), Gradia Direct(GD), Premisa(PR), Tetric N-Ceram(TC) 7종의 복합레진에 대하여 dentin A3, enamel A3, clear translucent에 해당하는 세 가지의 shade를 선택하여 총 21종의 복합레진에 대하여 직경 10 ㎜, 두께 1 ㎜의 디스크형 시편을 각각 10개씩 제작하였다. TP 측정을 위하여 각각의 시편에 대하여 흰색 배경과 검정색 배경 위에서의 시편의 색상을 colorimeter룰 사용하여 측정한 후 CIELAB color scale로 나타내어 TP를 계산하였고, %T 측정을 위하여 Spectrometer와 computer software를 이용하여 가시광선 영역에 해당하는 380-780 ㎚ 구간에서의 시편을 통과한 빛의 mean light transmittance (%T)를 구하였다. 복합레진의 종류와 shade category에 따른 TP 및 %T를 비교하기 위하여 two-way ANOVA를 시행하였고, 동일한 shade category에 해당하는 7종의 복합레진 및 동일한 복합레진 종류에 해당하는 세 가지 shade category에 대하여 각각 one-way ANOVA를 시행한 후 Tukey’s test로 사후검정
하였다. 두 가지 평가 방법을 이용한 결과간의 연관성 분석을 위하여 Pearson 상관계수를 사용한 상관분석을 시행하였다. 모든 통계 분석 과정은 95% 유의수준 하에 이루어졌다.
연구 결과 복합레진의 종류와 shade category에 따라 TP 및 %T에 통계학적으로 유의한 차이가 있음이 나타났다 (p<0.05). 동일한 shade category에서의 복합레진 종류에 따른 TP는 3가지 shade category에서 각각 다양한 순서로 통계학적으로 유의한 차이를 보였으며 (p<0.05), 동일한 복합레진 종류에서의 shade category에 따른 TP는 7종의 복합레진에서 각각 통계학적으로 유의한 차이를 보였다 (p<0.05). 동일한 shade category에서의 복합레진 종류에 따른 %T는 세 가지 shade category에서 각각 다양한 순서로 통계학적으로 유의한 차이를 보였으며 (p<0.05), 동일한 복합레진 종류에서의 shade category에 따른 %T는 BF와 ES를 제외한 5종의 복합레진에서 각각 통계학적으로 유의한 차이를 보였다 (p<0.05). 두 가지 평가 방법에 의한 결과는 통계학적으로 유의한 양의 상관관계를 나타내었다 (r=0.626, p<0.05). 7가지 복합레진 종류에 대한 상관분석에서, ES를 제외한 6종의 복합레진에서 통계학적으로 유의한 강한 양의 상관관계를 나타내었다 (r=0.763-0.992, p<0.05). 세 가지 shade category에 대한 상관분석에서, 세 가지 shade category 모두에서 통계학적으로 유의한 양의 상관관계를 나타내었다 (r=0.403-0.528, p<0.05). 이번 연구에서 두 가지 평가 방법에 의한 결과는 동일한 종류의 복합레진에 대하여 각각 상관분석을 시행한 경우 전체 결과에 대하여 상관분석을 시행하였을 때와 비교하여 강한 양의 상관관계를 나타내었으며, 이로 미루어 볼 때 서로 다른 종류의 복합레진의 반투명도를 평가할 때에 있어서는 반투명도를 정량적으로 측정할 수 있는 평가 방법을 사용하여야 하며 복합레진의 반투명도 평가를 위한 정확한 기준이 필요할 것으로 생각된다.
두 가지 평가 방법을 이용한
복합레진의 반투명도에 대한 평가
<지도교수 : 박 성 호>
연세대학교 대학원 치의학과
김 도 현
Ⅰ. 서 론
근래에 치아의 심미수복에 있어 광중합형 복합레진이 널리 이용되고 있다. 하지만 심미적으로 자연치와 유사한 수복을 시행하는 것은 쉽지 않은 일인데, 가장 큰 이유는 복합레진과 자연치의 광학적 특성에 차이가 있기 때문이다. 치아의 광학적 특성은 일차적으로는 명도, 채도, 색상으로 구성된 고유의 색으로 표현되어지지만, 그 외에도 반투명도, 불투명도, 은화, 표면 광택, 형광 등과 같은 이차적인 특성이 복합적으로 연관되어 있으며(Terry 등, 2002), 그 중 반투명도와 불투명도는 치아에 반사되어 나타나는 빛의 질과 양의 척도가 되기 때문에 가장 중요한 광학적 특성으로 여겨진다(Winter, 1993).반투명도란 빛이 어떤 물질을 통과하여 지나갈 수 있고, 그에 의해 하부의 색상이 그 물질의 색상에 영향을 주는 것을 허용하는 특성을 말한다(Johnston 등, 1995). 복합레진은 주로 투명도가 높은 monomer matrix와 미세한 filler 입자들로 구성되어 있기 때문에 광학적으로 반투명한 특성을 가진다. 복합레진에 백색광을 투과시키면 빛은 복합레진 내부에서 filler 입자들에 의해 여러 방향으로 산란되게 되고, 복합레진 층을 통과한 빛이 관측자의 눈에 도달하게 된다. 최근에 치아의 상아질과 법랑질의 반투명도를 재현하기 위하여 여러 제조사들에서 동일한 색상에서도 반투명도의 정도를 다르게 하여 다양한 shade의 복합레진을 제공하고 있다. 제조사와 shade에 따라 반투명도가 다양하게 나타남이 보고되었으나(Ikeda 등, 2004; Ikeda 등, 2005; S. J. Kim 등, 2009; Ryan 등, 2010; Bin Yu and Lee, 2008b), 비교 대상이 제한적이고, 특히 translucent shade에 대한 정보가 부족하다.
복합레진의 반투명도를 측정하는 방법으로 translucency parameter (TP)가 있다. TP는 일정 두께의 시편의 색을 흰색 배경과 검정색 배경에서 각각 측정하여 CIELAB color scale로 표시한 후 두 측정치의 차이를 계산하여 수치로 나타낸 것이다(Johnston 등, 1995). TP는 반투명도를 평가하는 적절한 방법으로 알려져 있으며, 여러 연구자들이 TP를 이용하여 복합레진과 도재의 반투명도를 측정해 왔다(Arimoto 등, 2010; del Mar Pérez 등, 2009; Ikeda 등, 2004; Ikeda 등, 2005;
Kamishima 등, 2005; S. J. Kim 등, 2009; Y. K. Lee 등, 2005; Li 등, 2010; Lim 등, 2010; Perez 등, 2010; Ryan 등, 2010; Sidhu 등, 2006; Woo 등, 2008; Bin Yu and Lee, 2008a, 2008b; B. Yu and Lee, 2008c).
반투명도를 측정하는 또 다른 방법으로 light transmittance (%T)가 있다. Light transmittance는 광원으로부터 시편에 직접 빛을 통과시킨 후 시편을 통과한 빛이 광수용체에 도달한 빛의 양을 비율로 나타낸 것이다(Brodbelt 등, 1980). 여러 연구자들이 light transmittance를 이용하여 재료의 광투과도를 측정하였으며, 이를 재료의 반투명도를 나타내는 지표로 활용해 왔다(Arikawa 등, 1998; Azzopardi 등, 2009; Baldissara 등, 2010; Brodbelt 등, 1980; dos Santos 등, 2008; Masotti 등, 2007; Peixoto 등, 2007; Rasetto 등, 2004). 그 외에 흰색, 검정색 배경에서의 반사율의 비를 측정하는 contrast ratio(CR) 값도 소개되었으나(Miyagawa 등, 1981), 이를 이용해서 이루어지진 연구는 많지 않다. 위와 같이 복합레진의 반투명도를 측정하기 위한 여러 방법이 소개되었지만, 각각의 방법이 반투명도를 정량화하여 나타낼 수 있는 적절한 방법인가에 대한 평가가 부족하며, 각각의 방법으로 얻어진 결과의 연관성에 관한 연구 역시 필요한 상황이다. 이번 연구의 목적은 시중에 시판되고 있는 7종의 복합레진에 대하여 dentin, enamel, translucent의 세 가지 shade category에 해당하는 일정한 shade를 선택한 후 translucency parameter와 light transmittance를 측정하여 1) 제조사별로 다른 7종의 복합레진 종류 및 dentin, enamel, translucent의 세 가지 shade category 간에 반투명도의 차이가 있는지, 2) 두 가지 반투명도 평가 방법을 이용하여 얻어진 결과 사이에 연관성이 있는지를 알아보고자 함이며, 이에 따라 다음과 같이 귀무가설을 설정하였다. 1) 동일한 shade category일 경우 제조사에 따라 다른
종류의 복합레진의 반투명도에는 차이가 없으며, 2) 동일한 종류의 복합레진에서 dentin, enamel, translucent shade 간에는 반투명도의 차이가 없으며, 3) translucency parameter와 light transmittance 두 가지 반투명도 측정 방법을 이용한 결과 사이에 연관성이 없다.
Ⅱ. 재료 및 방법
1. 연구 재료
이번 연구는 제조사별로 다른 7종의 복합레진에 대하여 dentin A3, enamel A3, clear translucent에 해당하는 세 가지의 shade를 선택하여 총 21종의 복합레진을 사용하여 시행하였다. 연구에 사용된 복합레진의 종류 및 조성은 Table 1과 Table 2에 정리되어 있다.
Table 1. Composite materials used in this study
Code Product Shade
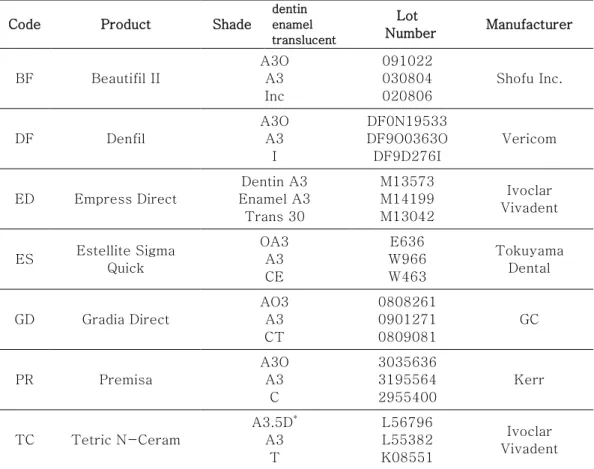
dentin enamel translucent Lot Number Manufacturer BF Beautifil II A3O A3 Inc 091022 030804 020806 Shofu Inc. DF Denfil A3O A3 I DF0N19533 DF9O0363O DF9D276I Vericom ED Empress Direct Dentin A3 Enamel A3 Trans 30 M13573 M14199 M13042 Ivoclar Vivadent ES Estellite Sigma Quick OA3 A3 CE E636 W966 W463 Tokuyama Dental GD Gradia Direct AO3 A3 CT 0808261 0901271 0809081 GC PR Premisa A3O A3 C 3035636 3195564 2955400 Kerr TC Tetric N-Ceram A3.5D* A3 T L56796 L55382 K08551 Ivoclar Vivadent
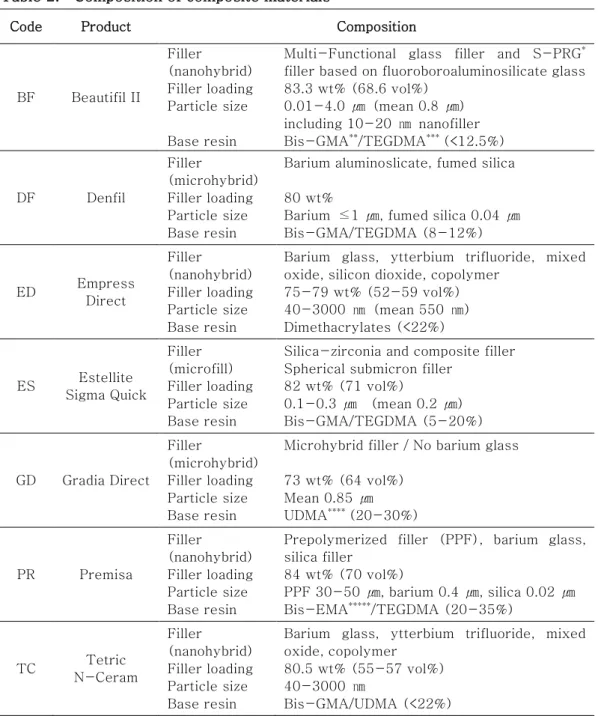
Table 2. Composition of composite materials
Code Product Composition
BF Beautifil II Filler (nanohybrid) Filler loading Particle size Base resin
Multi-Functional glass filler and S-PRG* filler based on fluoroboroaluminosilicate glass 83.3 wt% (68.6 vol%) 0.01-4.0 ㎛ (mean 0.8 ㎛) including 10-20 ㎚ nanofiller Bis-GMA**/TEGDMA*** (<12.5%) DF Denfil Filler (microhybrid) Filler loading Particle size Base resin
Barium aluminoslicate, fumed silica 80 wt%
Barium ≤1 ㎛, fumed silica 0.04 ㎛ Bis-GMA/TEGDMA (8-12%) ED Empress Direct Filler (nanohybrid) Filler loading Particle size Base resin
Barium glass, ytterbium trifluoride, mixed oxide, silicon dioxide, copolymer
75-79 wt% (52-59 vol%) 40-3000 ㎚ (mean 550 ㎚) Dimethacrylates (<22%) ES Estellite Sigma Quick Filler (microfill) Filler loading Particle size Base resin
Silica-zirconia and composite filler Spherical submicron filler
82 wt% (71 vol%) 0.1-0.3 ㎛ (mean 0.2 ㎛) Bis-GMA/TEGDMA (5-20%) GD Gradia Direct Filler (microhybrid) Filler loading Particle size Base resin
Microhybrid filler / No barium glass 73 wt% (64 vol%) Mean 0.85 ㎛ UDMA**** (20-30%) PR Premisa Filler (nanohybrid) Filler loading Particle size Base resin
Prepolymerized filler (PPF), barium glass, silica filler 84 wt% (70 vol%) PPF 30-50 ㎛, barium 0.4 ㎛, silica 0.02 ㎛ Bis-EMA*****/TEGDMA (20-35%) TC Tetric N-Ceram Filler (nanohybrid) Filler loading Particle size Base resin
Barium glass, ytterbium trifluoride, mixed oxide, copolymer
80.5 wt% (55-57 vol%) 40-3000 ㎚
Bis-GMA/UDMA (<22%)
From manufacturer’s information.
* S-PRG : Surface pre-reacted glass ionomer ** Bis-GMA : bisphenol-A-glycidyl dimethacrylate *** TEGDMA : triethyleneglycol dimethacrylate **** UDMA : Urethane Dimethacrylate
2. 연구 방법
가. 복합레진 시편 제작
각각의 복합레진에 대하여 직경 10 ㎜, 두께 1 ㎜의 디스크형 시편을 10개씩 제작하였다. 2개의 slide glass 사이에 Teflon mould를 위치시키고 복합레진을 적용하여 1분간 가압한 후 광중합기 (LED.E, Guilin Woodpecker Medical Instrument Co., Ltd., Guilin, Guangxi, China)를 이용하여 시편 양측에서 각각 40초씩 광조사하였다. 광중합기의 강도는 400 ㎽/㎠ 이상으로 유지하였다. 중합된 시편을 분리한 후 digital caliper (500-181, Mitutoyo, Tokyo, Japan)를 이용하여 시편의 두께를 측정하여 1.0±0.05 ㎜를 확인하였다.
나. Translucency Parameter (TP) 측정
복합레진 시편을 흰색 배경(L*=94.44, a*=0.26, b*=1.69)과 검정색 배경(L*=1.38, a*=0.00, b*=0.06)위에 올려놓고 standard illuminant D65와 colorimeter (CR-321, Minolta Co, Ltd., Osaka, Japan)를 이용하여 색상을 측정하였다. Colorimeter의 window size는 3㎜이며, 각 시편마다 3회의 반복측정을 통해 색상을 결정하였고, 측정값은 CIELAB color scale로 표시하였다. L*값은 명도로 0은 완전한 검정색(black), 100은 완전한 흰색(white)을 나타낸다. a*는 적색(+)에서 녹색(-), b*는 황색(+)에서 청색(-)의 채도 좌표계를 나타낸다.
다음과 같은 공식을 통해 복합레진 시편의 translucency parameter를 계산하였다. TP=[(LW*-LB*)2+(aW*-aB*)2+(bW*-bB*)2]1/2
다. Light transmittance (%T) 측정
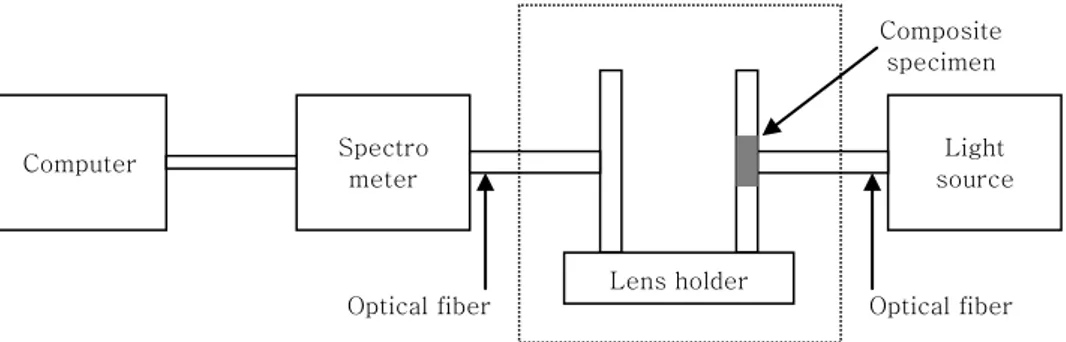
복합레진의 light transmittance는 spectrometer (USB4000-VIS-NIR, Ocean Optics, Dunedin, FL, USA)와 computer software (SpectraSuite, Ocean Optics, Dunedin, FL, USA)를 이용하여 측정하였다(Figure 1). 360-2000 ㎚ 파장의 빛을 내보내는 tungsten-halogen light source (LS-1, Ocean Optics, Dunedin, FL, USA)에 attenuating polytetrafluoroethylene (PTFE) disc를 적용하여 광량을 감소시킨 후 직경이 600 ㎛인 두 개의 optical fiber (QP600-1-VIS-NIR, Ocean Optics, Dunedin, FL, USA)를 통해 spectrometer로 빛을 전달하였다. 두 개의 optical fiber 사이에는 lens holder (74-ACH, Ocean Optics, Dunedin, FL, USA)를 위치시켜 복합레진 시편을 적용할 수 있도록 하였다. 시편을 적용하지 않고 측정하여 얻어진 light spectra를 100% light transmittance로 하여, 각각의 시편을 적용한 후 spectrometer로 얻어진 light spectrum을 computer software를 통해 상대적인 light transmittance graph로 나타내었고, 가시광선 영역에 해당하는 380-780 ㎚ 구간에서의 graph 하방의 면적을 계산한 후 400 ㎚로 나누어 mean light transmittance (%T)를 계산하였다. 모든 측정 과정은 암실에서 이루어졌으며, lens holder는 검정색 천으로 덮어 외부의 빛이 유입되지 않도록 통제하였다.
Figure 1. Schematic diagram of the apparatus for measuring light transmittance
Spectro meter Light source Computer Lens holder Optical fiber Optical fiber Composite specimen
라. 통계 분석
복합레진의 종류와 shade category에 따른 translucency parameter 및 light transmittance를 비교하기 위하여 two-way ANOVA를 시행한 후 Tukey’s test로
사후검정 하였고, 전체 21종의 복합레진에 대한 반투명도를 비교하기 위하여 one-way ANOVA를 시행한 후 Tukey’s test로 사후검정 하였다.
동일한 복합레진 종류 및 shade category 내에서의 반투명도를 비교하기 위하여 동일한 shade category에 해당하는 7가지 종류의 복합레진 및 동일한 복합레진 종류에 해당하는 세 가지 shade category에 대하여 각각 one-way ANOVA를 시행한 후 Tukey’s test로 사후검정 하였다.
Translucency parameter와 light transmittance 두 가지 평가 방법을 이용한 결과 간의 연관성 분석을 위하여 Pearson 상관계수를 사용한 상관분석을 시행하였다. 동일한 복합레진 종류 및 shade category 내에서의 측정 결과 사이의 연관성 분석을 위하여 7가지 복합레진 종류에 해당하는 각각 30개의 시편과 세 가지 shade category에 해당하는 각각 70개의 시편에 대하여 Pearson 상관계수를 사용한 상관분석을 시행하였다. 모든 통계 분석 과정은 95% 유의수준 하에 이루어졌다 (PASW Statistics 18, SPSS Inc.).
Ⅲ. 결 과
1. Translucency Parameter (TP)
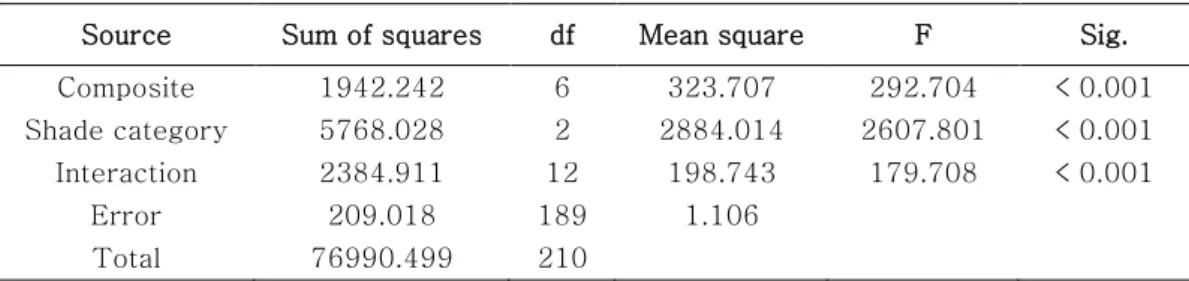
Two-way ANOVA에서 복합레진의 종류와 shade category에 따라 TP에 통계학적으로 유의한 차이가 있음이 나타났고 교호작용이 존재하였으며 (p<0.05, Table 3), GD=ED>DF>ES≥TC≥BF≥PR 및 translucent>enamel>dentin shade 순으로 나타났다 (p<0.05, Table 4).
각각의 복합레진에 대하여 측정된 TP를 Table 4와 Figure 2에 나타내었다. TP는 dentin shade에서 10.1-15.6, enamel shade에서 13.2-21.1, translucent shade에서 19.2-37.9로 나타났다. GD 군의 translucent shade가 가장 높은 TP를 나타내었으며, PR 군의 dentin shade가 가장 낮은 TP 값을 나타내었다.
동일한 shade category에서의 복합레진 종류에 따른 TP는 dentin shade의 경우 DF>ES>GD>ED>TC≥BF≥PR 순으로, enamel shade의 경우 ED>DF=TC=GD >ES=BF=PR 순으로, translucent shade의 경우 GD>ED>ES≥BF≥PR≥DF ≥TC 순으로 통계학적으로 유의한 차이를 보였다 (p<0.05, Figure 3).
동일한 복합레진 종류에서의 shade category에 따른 TP는 7종의 복합레진에서 각각 dentin, enamel, translucent shade 간에 통계학적으로 유의한 차이를 보였다 (p<0.05, Figure 4).
Table 3. Result of two-way ANOVA (TP)
Source Sum of squares df Mean square F Sig. Composite 1942.242 6 323.707 292.704 < 0.001 Shade category 5768.028 2 2884.014 2607.801 < 0.001 Interaction 2384.911 12 198.743 179.708 < 0.001
Error 209.018 189 1.106 Total 76990.499 210
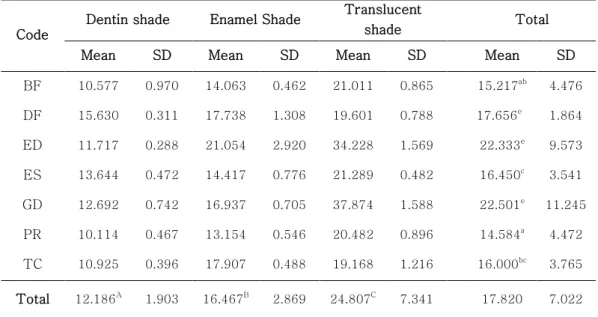
Table 4. Translucency parameter (TP) of composite materials (N=10)
Code
Dentin shade Enamel Shade Translucent
shade Total Mean SD Mean SD Mean SD Mean SD BF 10.577 0.970 14.063 0.462 21.011 0.865 15.217ab 4.476 DF 15.630 0.311 17.738 1.308 19.601 0.788 17.656e 1.864 ED 11.717 0.288 21.054 2.920 34.228 1.569 22.333e 9.573 ES 13.644 0.472 14.417 0.776 21.289 0.482 16.450c 3.541 GD 12.692 0.742 16.937 0.705 37.874 1.588 22.501e 11.245 PR 10.114 0.467 13.154 0.546 20.482 0.896 14.584a 4.472 TC 10.925 0.396 17.907 0.488 19.168 1.216 16.000bc 3.765 Total 12.186A 1.903 16.467B 2.869 24.807C 7.341 17.820 7.022
The data were analyzed by two-way ANOVA and Tukey’s test.
Different capital letters denote statistically significant among shade categories (p<0.05). Different small letters denote statistically significant among composite materials (p<0.05).
Figure 2. TP of composite materials in ascending order
The data were analyzed by one-way ANOVA and Tukey’s test for all 21 composites. Different letters denote statistically significant (p<0.05).
a a a ab bc bcd cd cde de ef fg gh ghi hij ijk jk k k k l m 0 5 10 15 20 25 30 35 40 45 D D D D D E D E E D E E E T T T T E T T T PR BF TC ED GD PR ES BF ES DF GD DF TC TC DF PR BF ED ES ED GD
Figure 3. TP of composite materials
The data were analyzed by one-way ANOVA and Tukey’s test for 7 composite groups in each shade category.
Different letters denote statistically significant (p<0.05).
Figure 4. TP of composite materials
The data were analyzed by one-way ANOVA and Tukey’s test for 3 shade categories in each composite material.
Different letters denote statistically significant (p<0.05).
ab f c e d a b a b c a b a b bc ab d c e abc a 0 5 10 15 20 25 30 35 40 45 BF DF ED ES GD PR TC BF DF ED ES GD PR TC BF DF ED ES GD PR TC D E T a b c a b c a b c a b c a b c a b c a b c 0 5 10 15 20 25 30 35 40 45 D E T D E T D E T D E T D E T D E T D E T BF DF ED ES GD PR TC
2. Light Transmittance (%T)
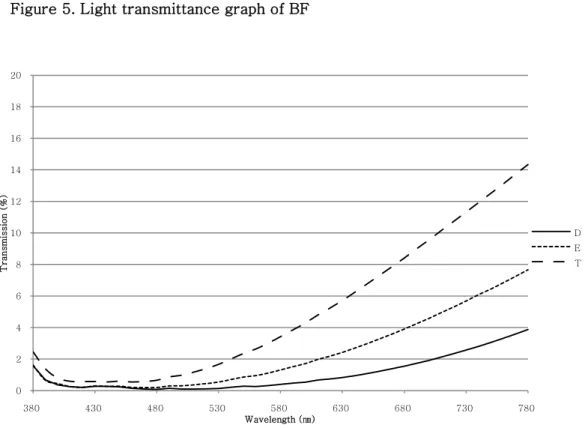
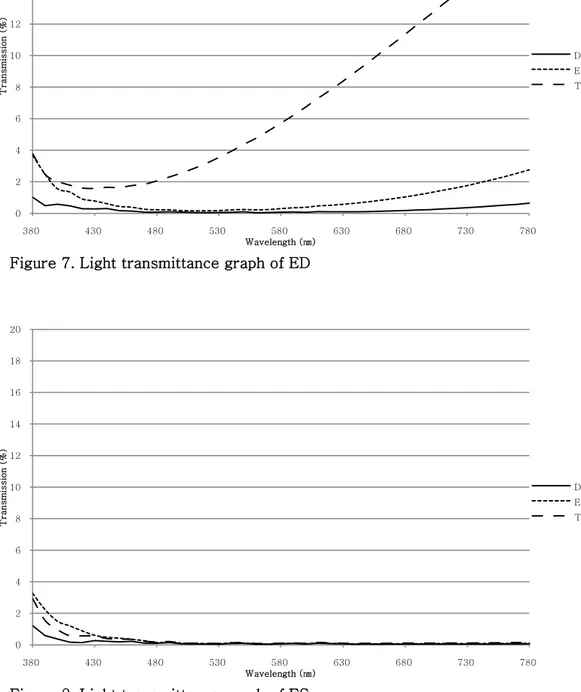
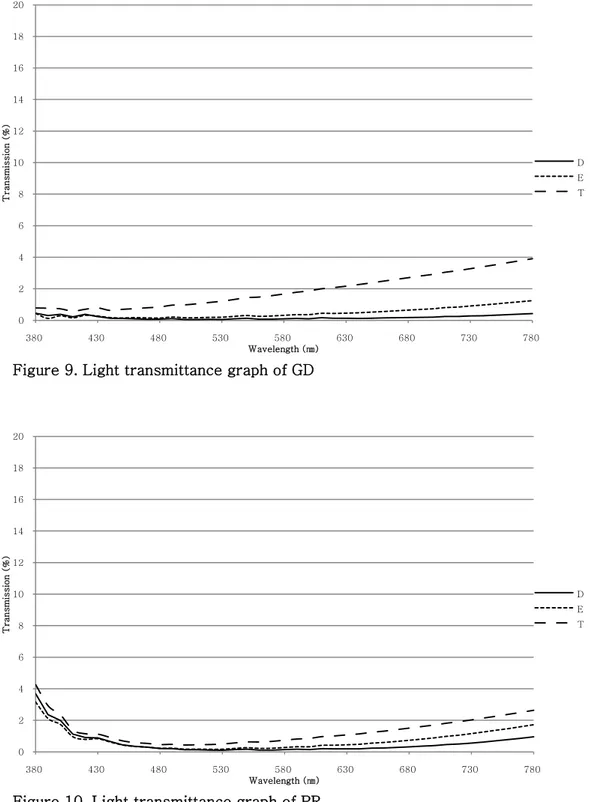
Spectrometer와 computer software를 통해 얻어진 light transmittance graph를 Figure 5-11에 나타내었다.
Two-way ANOVA에서 복합레진의 종류와 shade category에 따라 %T에 통계학적으로 유의한 차이가 있음이 나타났고 교호작용이 존재하였으며 (p<0.05, Table 5), ED=DF>TC=PR=GD>ES=BF 및 translucent>enamel>dentin shade 순으로 나타났다 (p<0.05, Table 6).
각각의 복합레진에 대하여 측정된 %T를 Table 6과 Figure 12에 나타내었다. %T는 dentin shade에서 0.12-1.00, enamel shade에서 0.10-2.30, translucent shade에서 0.27-7.14로 나타났다. ED의 translucent shade 군이 가장 높은 %T 를 나타내었으며, BF의 enamel shade 군이 가장 낮은 %T를 나타내었다.
동일한 shade category에서의 복합레진 종류에 따른 %T는 dentin shade의 경우 DF>PR>TC≥ED≥GD>ES=BF 순으로, enamel shade의 경우 DF>ED≥PR≥TC ≥GD≥ES≥BF 순으로, translucent shade의 경우 ED>DF>GD=TC=PR>BF =ES 순으로 통계학적으로 유의한 차이를 보였다 (p<0.05, Figure 13).
동일한 복합레진 종류에서의 shade category에 따른 %T는 DF, ED, GD, PR, TC 군에서는 각각 dentin, enamel, translucent shade 간에 통계학적으로 유의한 차이를 보였으며(p<0.05), BF 군에서는 translucent shade 만이 다른 두 shade와 통계학적으로 유의한 차이를 보였으며(p<0.05), ES 군에서는 dentin shade 만이 다른 두 shade와 통계학적으로 유의한 차이를 보였다 (p<0.05, Figure 14).
Figure 5. Light transmittance graph of BF
Figure 6. Light transmittance graph of DF
0 2 4 6 8 10 12 14 16 18 20 380 430 480 530 580 630 680 730 780 T rans m issi o n ( % ) Wavelength (㎚) D E T 0 2 4 6 8 10 12 14 16 18 20 380 430 480 530 580 630 680 730 780 T rans m issi o n ( % ) Wavelength (㎚) D E T
Figure 7. Light transmittance graph of ED
Figure 8. Light transmittance graph of ES
0 2 4 6 8 10 12 14 16 18 20 380 430 480 530 580 630 680 730 780 T rans m issi o n ( % ) Wavelength (㎚) D E T 0 2 4 6 8 10 12 14 16 18 20 380 430 480 530 580 630 680 730 780 T rans m issi o n ( % ) Wavelength (㎚) D E T
Figure 9. Light transmittance graph of GD
Figure 10. Light transmittance graph of PR
0 2 4 6 8 10 12 14 16 18 20 380 430 480 530 580 630 680 730 780 T rans m issi o n ( % ) Wavelength (㎚) D E T 0 2 4 6 8 10 12 14 16 18 20 380 430 480 530 580 630 680 730 780 T rans m issi o n ( % ) Wavelength (㎚) D E T
Figure 11. Light transmittance graph of TC
Table 5. Result of two-way ANOVA (%T)
Source Sum of squares df Mean square F Sig. Composite 213.818 6 35.636 491.074 < 0.001 Shade category 184.905 2 92.452 1274.004 < 0.001 Interaction 218.592 12 18.216 251.019 < 0.001 Error 13.715 189 0.073 Total 941.765 210 0 2 4 6 8 10 12 14 16 18 20 380 430 480 530 580 630 680 730 780 T rans m issi o n ( % ) Wavelength (㎚) D E T
Table 6. Mean light transmittance (%T) of composition materials (N=10)
Code
Dentin shade Enamel Shade Translucent
shade Total Mean SD Mean SD Mean SD Mean SD BF 0.121 0.025 0.098 0.020 0.356 0.033 0.192a 0.121 DF 1.004 0.056 2.299 0.375 4.942 0.542 2.749c 1.707 ED 0.217 0.035 0.923 0.100 7.144 0.976 2.761c 3.212 ES 0.129 0.039 0.311 0.066 0.271 0.024 0.237a 0.091 GD 0.189 0.036 0.468 0.074 1.868 0.177 0.842b 0.755 PR 0.526 0.027 0.728 0.060 1.286 0.180 0.846b 0.344 TC 0.258 0.037 0.635 0.073 1.772 0.182 0.888b 0.664 Total 0.349A 0.300 0.780B 0.690 2.520C 2.429 1.216 1.738
The data were analyzed by two-way ANOVA and Tukey’s test.
Different capital letters denote statistically significant among shade categories (p<0.05). Different small letters denote statistically significant among composite materials (p<0.05).
Figure 12. %T of composite materials in ascending order
The data were analyzed by one-way ANOVA and Tukey’s test for all 21 composites. Different letters denote statistically significant (p<0.05).
a a a a ab ab ab abc abc abc abcd bcde cde def ef f g gh h i j 0 1 2 3 4 5 6 7 8 9 E D D D D D T E T E D E E E D T T T E T T BF BF ES GD ED TC ES ES BF GD PR TC PR ED DF PR TC GD DF DF ED
Figure 13. %T of composite materials
The data were analyzed by one-way ANOVA and Tukey’s test for 7 composite groups in each shade category.
Different letters denote statistically significant (p<0.05).
Figure 14. %T of composite materials
The data were analyzed by one-way ANOVA and Tukey’s test for 3 shade categories in each composite material.
Different letters denote statistically significant (p<0.05).
a e bc a b d c a f e ab bc de cd a c d a b b b 0 1 2 3 4 5 6 7 8 9 BF DF ED ES GD PR TC BF DF ED ES GD PR TC BF DF ED ES GD PR TC D E T a a b a b c a b c a b b a b c a b c a b c 0 1 2 3 4 5 6 7 8 9 D E T D E T D E T D E T D E T D E T D E T BF DF ED ES GD PR TC
3. 두 가지 측정 방법을 이용한 결과간의 연관성 분석
가. 전체 결과에 대한 비교
7가지 종류, 세 가지 shade category에 해당하는 총 210개 복합레진 시편에 대한 TP와 %T 사이의 Pearson 상관계수는 0.626 (p<0.05)으로 나타났다 (Table 7). 두 가지 측정 방법에 의해 얻어진 결과의 산점도를 Figure 15에 나타내었다.나. 복합레진의 종류에 따른 결과에 대한 비교
7가지 복합레진 종류에 해당하는 각각 30개의 시편에 대한 TP와 %T 간의 Pearson 상관계수를 Table 7에 나타내었다. ES를 제외한 6종의 복합레진에서 각각 통계학적으로 유의한 강한 양의 상관관계를 나타내었으며, ES에서는 통계학적으로 유의한 상관관계가 나타나지 않았다.다. Shade category에 따른 결과에 대한 비교
세 가지 shade category에 해당하는 각각 70개의 시편에 대한 TP와 %T 간의 Pearson 상관계수를 Table 7에 나타내었다. 세 가지 shade category 모두에서 각각 통계학적으로 유의한 양의 상관관계가 나타났다.Table 7. Pearson correlation coefficient between TP and %T
Correlation coefficient Sig.
Total (N=210) 0.626 * < 0.001 Composite (N=30) BF 0.888* < 0.001 DF 0.927* < 0.001 ED 0.929* < 0.001 ES 0.356 0.054 GD 0.992* < 0.001 PR 0.977* < 0.001 TC 0.763* < 0.001 Shade Category (N=70) Dentin 0.528* < 0.001 Enamel 0.403* < 0.001 Translucent 0.407* < 0.001
Ⅳ. 고 찰
1. 복합레진의 종류와 shade에 따른 반투명도
복합레진의 반투명도에 관한 연구는 많이 이루어져 왔으나, 일정한 shade에 해당 하는 다양한 종류의 복합레진의 반투명도를 체계적으로 비교한 연구는 부족하다. 이 번 연구에서는 7종의 복합레진에 대하여 dentin, enamel, translucent의 일정한 shade category에 해당하는 시편의 반투명도를 측정함으로써 복합레진의 종류와 shade에 따른 반투명도를 비교할 수 있었으며, 연구 결과 복합레진의 반투명도는 종 류와 shade에 따라 다양하게 나타났다.
재료의 반투명도는 시편의 두께에 의해 영향을 받으며, 많은 연구에서 시편의 두께가 감소할수록 반투명도가 증가한다고 보고하였다.(M. Fujita, Kawakami, 등, 2005; Kamishima 등, 2005; Y. Lee and Powers, 2005; B. Yu and Lee, 2008c). 이번 연구에서는 1 ㎜ 두께의 시편만을 사용하였고, 따라서 시편의 두께에 의한 영향은 배제할 수 있었다.
복합레진의 반투명도는 matrix와 filler의 조성에 의해 영향을 받는다고 알려져 있다(Ikeda 등, 2005; J. Kim 등, 2006; Y. K. Lee 등, 2005; Nakamura 등, 2002; Sidhu 등, 2006). 이번 연구에 사용된 여러 종류와 shade의 복합레진에서 반투명도의 차이가 나타난 것은 복합레진의 matrix와 filler의 조성에 차이가 있기 때문일 것으로 생각된다.
Azzorpardi 등은 silica filler가 포함된 복합레진에서 matrix의 종류는 반투명도에 영향을 주지 않으며, filler에 대한 Bis-GMA의 비율이 높아질수록 light transmittance가
높아짐을 보고하였으며(Azzopardi 등, 2009), Lee는 filler 함량이 높아질수록 복합레진의 TP 값이 낮아짐을 보고하였다(Y. Lee, 2008). 이번 연구에 사용된 Beautifil II는 matrix의 함량이 12.5% 미만으로 다른 복합레진에 비해 낮다. Beautifil II는 dentin, enamel, translucent shade 모두에서 다른 복합레진에 비해 상대적으로 낮은 TP와 %T를 나타내었다. Empress Direct의 경우 filler의 함량이 52-59%로 다른 복합레진에 비해 낮다. Empress Direct의 경우 dentin shade에서 보통의 TP와 %T를 나타내었고, enamel과 translucent shade에서 높은 TP와 %T를 나타내었다.
Arikawa 등은 작고 불균일한 형태의 filler가 포함된 복합레진이 크고 둥근 형태의 filler가 포함된 복합레진에 비해 light transmittance가 높고, filler size가 작을수록 light transmittance가 높음을 보고하였다(Arikawa 등, 2007). Dos Santos 등은 0.6 ㎛의 filler가 포함된 복합레진에 비해 20 ㎚의 filler가 포함된 복합레진의 light transmittance가 높음을 보고하였다(dos Santos 등, 2008). 이번 연구에 사용된 Estellite Sigma Quick는 microfill type의 복합레진이며, filler의 크기가 0.1-0.3 ㎛로 다른 복합레진에 비해 크다. Estellite Sigma Quick 의 TP는 dentin, translucent shade에서는 보통으로, enamel shade에서는 낮게 나타났으며, %T는 dentin, enamel, translucent shade 모두에서 낮게 나타났다. Denfil의 경우 제조사의 정보가 불충분하여 결과를 고찰함에 있어 한계가 있었다. Microhybrid type으로 분류되는 복합레진이지만, filler의 크기가 barium silicate≤1 ㎛, fumed silica=0.04 ㎛로 nanofiller와 비슷한 크기의 filler가 포함되어 있음을 알 수 있다. Denfil의 TP는 dentin shade에서 높게, enamel과 translucent shade에서 낮게 나타났으며, %T는 dentin, enamel, translucent shade에서 모두 높게 나타났다.
100 ㎚ 이하의 입자 크기를 가지는 nanofiller가 함유된 경우 400-600 ㎚ 파장의 가시광선을 산란시키지 않기 때문에 refractive index와 관계 없이 높은 반투명도를 나타낸다(Mitra 등, 2003). 또한 nanofiller가 함유된 경우 복합레진의 반투명도를 저하시키지 않으면서 matrix의 refractive index를 변화시킬 수 있다고 알려져 있다(Ivoclar Vivadent AG, 2007). 이번 연구에 사용된 nanohybrid type의 복합레진은 Beautifil II, Empress Direct, Premisa, Tetric N-Ceram이다. Beautifil II의 경우는 nanofiller가 함유되었지만, 앞서 언급한 이유 -낮은 matrix 함량- 로 인해 낮은 TP와 %T를 나타내었을 가능성이 있다. Empress Direct의 경우 앞서 언급한 이유 -낮은 filler 함량- 에 nanofiller의 영향이 더해져서 높은 TP와 %T를 나타내었을 것이다. Premisa의 경우 TP는 dentin, enamel, translucent 모두 낮게 나타났고 %T는 보통으로 나타났는데, 이는 70%로 약간 높은 filler 함량 또는 포함되어 있는 prepolymerized filler의 영향을 받았을 가능성이 있다. Tetric N-Ceram의 경우, dentin, translucent shade의 TP는 낮게 나타났고, enamel shade의 TP 및, 모든 shade에서의 %T는 보통으로 나타났다.
Matrix와 filler의 refractive index가 비슷한 경우 높은 반투명도를 나타낸다(K. Fujita, Nishiyama, 등, 2005). Refractive index는 원자번호가 높은 원소를 포함함에 따라 높아지므로, metal oxide filler는 상대적으로 높은 refractive index를 가지게 된다. 예를 들어, Barium oxide의 refractive index는 1.98로, 통상적인 resin monomer의 1.49-1.56에 비해 높은 값을 나타내므로 복합레진의 반투명도를 감소시키는 영향을 미칠 수 있으며, Ytterbium trifluoride의 refractive index는 1.53으로 복합레진의 반투명도에 크게 영향을 미치지 않을 것으로 생각할 수
있다(Ivoclar Vivadent AG, 2007). 이번 연구에 사용된 Gradia Direct는 유일하게 barium glass를 함유하지 않아 방사선투과성을 가지는 복합레진이다. Gradia Direct의 TP는 dentin, enamel shade에서 보통으로, translucent shade에서 높게 나타났으며, %T는 dentin shade에서 낮게, enamel과 translucent shade에서 보통으로 나타났다. Microhybrid type의 복합레진인 것과 평균 0.85 ㎛의 상대적으로 큰 filler의 영향도 있을 것이다.
추가적으로, 자연치에서 상아질과 법랑질의 시편을 얻을 경우 표면이 편평하지 않고 조성이 불균일하기 때문에 자연치의 상아질과 법랑질의 반투명도에 대하여 이루어진 연구는 드문 상황이다. 최근의 연구들에 따르면 1 ㎜ 두께의 상아질의 TP 값을 16.4(Bin Yu 등, 2009)로, 법랑질의 TP 값을 28.45(Li 등, 2010), 18.7(Bin Yu 등, 2009) 보고하였으며, 연구에 따라 편차가 크게 나타난 것으로 보아 자연치의 반투명도에 대한 연구가 더 필요할 것으로 생각된다.
2. 두 가지 측정 방법을 이용한 결과간의 연관성
복합레진의 반투명도를 평가하기 위한 여러 방법이 소개되었지만, 각각의 방법이 반투명도를 정량화하여 나타낼 수 있는 적절한 방법인가에 대한 평가가 부족하며, 각각의 방법으로 얻어진 결과의 연관성에 관한 연구 역시 필요한 상황이다. 반투명도를 평가하기 위해 기존의 연구들에서 가장 많이 사용된 방법으로 transluceny parameter와 light transmittance가 있다. 이번 연구에서는 이 두 가지 반투명도 평가 방법을 사용한 결과 사이의 상관분석을 통해 두 가지 평가 방법에 의한 결과간의 연관성을 알아보고자 하였으며, 두 가지 평가 방법을 사용한 결과간에는 통계학적으로 유의한 양의 상관관계가 나타났다.
Translucency parameter와 같이 시편의 reflectance 측정을 시행할 경우에 시편의 모서리 쪽으로 산란된 빛이 흡수되지 못하고 소실되는 edge-loss 현상이 나타나며(Bolt 등, 1994), 이는 측정치의 정확도에 영향을 미칠 수 있다고 하였다(Ragain and Johnston, 2001). Edge-loss 현상을 최소화하기 위한 방법으로 시편을 plasticine에 묻어서 모서리 쪽으로 산란된 빛이 다시 시편으로 반사되어 돌아올 수 있도록 하여 reflectance를 측정하는 방법이 소개되었으며(Johnston 등, 1996), 실제로 이와 같은 방법으로 TP를 측정하였을 때 전통적인 방법으로 측정하였을 때보다 높은 값을 나타내었다는 보고가 있다(Bin Yu 등, 2009).
Translucency parameter는 white background가 빛을 완전히 반사하고, black background가 빛을 완전히 흡수할 수 있어야 측정이 정확히 이루어지는데, 기존 연구들에서 translucency parameter 측정의 background에 대한 기준이 명확하게
제시되지 않았고, 이번 실험에서도 사용된 background의 reflectance가 결과에 영향을 미쳤을 가능성이 있다.
Light transmittance를 측정할 때, 광원으로 사용되는 tungsten-halogen light source는 360-2000 ㎚ 파장의 빛을 내보내는데, 360-430 ㎚ 파장 영역에서는 빛의 세기가 일정하지 않고 불안정하게 나타나는 결과를 보인다. 이 영역에서 측정된 light transmittance가 mean light transmittance (%T)에 영향을 미쳤을 가능성이 있다.
Pearson 상관계수를 사용한 상관분석에서, Estellite Sigma Quick은 통계학적으로 유의한 상관관계를 나타내지 않았으며, 특히 %T에 있어서 상대적으로 낮은 값을 나타내었다. Estellite Sigma Quick은 이번 연구에 사용된 복합레진 중 유일하게 hybrid type이 아닌 microfill type의 복합레진으로, 0.1-0.3 ㎛ 크기의 filler를 포함하고 있으며, matrix와 filler의 함량에는 큰 차이가 없다. 이처럼 filler의 크기가 상대적으로 클 경우 빛의 진행 및 산란에 영향을 미쳐 반투명도 측정 결과에 차이가 나타났을 가능성이 있다.
두 가지 평가 방법간의 비교에서, 동일한 종류의 복합레진에 대하여 각각 상관분석을 시행한 경우 전체 결과에 대하여 시행한 경우에 비해 강한 상관관계를 나타냈다. 이로 미루어 볼 때, 동일하거나 비슷한 조성 또는 같은 종류의 복합레진의 반투명도 평가에 있어서는 translucency parameter와 light transmittance 사이에 큰 차이를 보이지 않으나, 서로 다른 종류의 복합레진의 반투명도를 평가할 때에 있어서는 반투명도를 정량적으로 측정할 수 있는 평가 방법을 사용하여야 하며, 복합레진의 반투명도 측정을 위한 정확한 기준이 필요할 것으로 생각된다.
Ⅴ. 결 론
1. Translucency parameter와 light transmittance를 통해 나타난 복합레진의 반투명도는 7종의 제조사에 따른 복합레진의 종류와 3가지 shade category에 따라 통계학적으로 유의한 차이를 나타내었다 (p<0.05).
2. Translucency parameter와 light transmittance 두 가지 평가 방법에 의한 결과는 통계학적으로 유의한 양의 상관관계를 나타내었다 (r=0.626, p<0.05).
7가지 복합레진 종류에 대한 상관분석에서, Estellite Sigma Quick을 제외한 6종의 복합레진에서 통계학적으로 유의한 강한 양의 상관관계를 나타내었다 (r=0.763-0.992, p<0.05). 세 가지 shade category에 대한 상관분석에서, 세 가지 shade category 모두에서 통계학적으로 유의한 양의 상관관계를 나타내었다 (r=0.403-0.528, p<0.05).
참고 문헌
Arikawa, H., Fujii, K., Kanie, T., Inoue, K. 1998. "Light transmittance characteristics of light-cured composite resins". Dental materials 14(6): 405-411.
Arikawa, H., Kanie, T., Fujii, K., Takahashi, H., Ban, S. 2007. "Effect of filler properties in composite resins on light transmittance characteristics and color".
Dental Materials Journal 26(1): 38-44.
Arimoto, A., Nakajima, M., Hosaka, K., Nishimura, K., Ikeda, M., Foxton, R. M., Tagami, J. 2010. "Translucency, opalescence and light transmission characteristics of light-cured resin composites". Dental materials 26(11): 1090-1097.
Azzopardi, N., Moharamzadeh, K., Wood, D. J., Martin, N., van Noort, R. 2009. "Effect of resin matrix composition on the translucency of experimental dental composite resins". Dental materials 25(12): 1564-1568.
Baldissara, P., Llukacej, A., Ciocca, L., Valandro, F. L., Scotti, R. 2010. "Translucency of zirconia copings made with different CAD/CAM systems". The Journal of prosthetic dentistry 104(1): 6-12.
Bolt, R. A., Bosch, J. J., Coops, J. C. 1994. "Influence of window size in small-window colour measurement, particularly of teeth". Physics in medicine and biology 39(7): 1133-1142.
Brodbelt, R. H., O'Brien, W. J., Fan, P. L. 1980. "Translucency of dental porcelains". Journal of dental research 59(1): 70-75.
del Mar Pérez, M., Saleh, A., Pulgar, R., Paravina, R. D. 2009. "Light polymerization-dependent changes in color and translucency of resin composites". American journal of dentistry 22(2): 97-101.
dos Santos, G. B., Alto, R. V., Filho, H. R., da Silva, E. M., Fellows, C. E. 2008. "Light transmission on dental resin composites". Dental materials 24(5): 571-576.
Fujita, K., Nishiyama, N., Nemoto, K., Okada, T., Ikemi, T. 2005. "Effect of base monomer's refractive index on curing depth and polymerization conversion of photo-cured resin composites". Dental Materials Journal 24(3): 403-408.
Fujita, M., Kawakami, S., Komatsu, H., Sano, H. 2005. "Translucency and characteristics of newly developed polymer-based dental tooth coating material". Dental Materials Journal 24(1): 111-116.
Ikeda, T., Murata, Y., Sano, H. 2004. "Translucency of opaque-shade resin composites". American journal of dentistry 17(2): 127-130.
Ikeda, T., Sidhu, S. K., Omata, Y., Fujita, M., Sano, H. 2005. "Colour and translucency of opaque-shades and body-shades of resin composites".
European journal of oral sciences 113(2): 170-173.
Ivoclar Vivadent AG: Ivoclar Vivadent Report. In Ivoclar Vivadent Report., Ivoclar AG, Schaan, Liechtenstein, 2007.
Johnston, W. M., Hesse, N. S., Davis, B. K., Seghi, R. R. 1996. "Analysis of edge-losses in reflectance measurements of pigmented maxillofacial elastomer".
Johnston, W. M., Ma, T., Kienle, B. H. 1995. "Translucency parameter of colorants for maxillofacial prostheses". The International journal of prosthodontics 8(1): 79-86.
Kamishima, N., Ikeda, T., Sano, H. 2005. "Color and translucency of resin composites for layering techniques". Dental Materials Journal 24(3): 428-432.
Kim, J., Lee, Y., Powers, J. M. 2006. "Influence of a series of organic and chemical substances on the translucency of resin composites". Journal of biomedical materials research. Part B, Applied biomaterials 77(1): 21-27.
Kim, S. J., Son, H. H., Cho, B. H., Lee, I. B., Um, C. M. 2009. "Translucency and masking ability of various opaque-shade composite resins". Journal of dentistry
37(2): 102-107.
Lee, Y. 2008. "Influence of filler on the difference between the transmitted and reflected colors of experimental resin composites". Dental materials 24(9): 1243-1247.
Lee, Y., Powers, J. M. 2005. "Metameric effect between resin composite and dentin". Dental materials 21(10): 971-976.
Lee, Y. K., Lim, B. S., Rhee, S. H., Yang, H. C., Powers, J. M. 2005. "Color and translucency of A2 shade resin composites after curing, polishing and thermocycling". Oper Dent 30(4): 436-442.
Li, Q., Xu, B. T., Li, R., Wang, Y. N. 2010. "Spectrophotometric comparison of translucent composites and natural enamel". J Dent 38 Suppl 2: e117-122.
Lim, H., Yu, B., Lee, Y. 2010. "Spectroradiometric and spectrophotometric translucency of ceramic materials". The Journal of prosthetic dentistry 104(4): 239-246.
Masotti, A. S., Onfrio, A. B., Conceio, E. N., Spohr, A. M. 2007. "UV-vis spectrophotometric direct transmittance analysis of composite resins". Dental materials 23(6): 724-730.
Mitra, S. B., Wu, D., Holmes, B. N. 2003. "An application of nanotechnology in advanced dental materials". The Journal of the American Dental Association
134(10): 1382-1390.
Miyagawa, Y., Powers, J. M., O'Brien, W. J. 1981. "Optical properties of direct restorative materials". Journal of dental research 60(5): 890-894.
Nakamura, T., Saito, O., Mizuno, M., Tanaka, H. 2002. "Changes in translucency and color of particulate filler composite resins". The International journal of prosthodontics 15(5): 494-499.
Peixoto, R. T., Paulinelli, V. M., Sander, H., Lanza, M. D., Cury, L. A., Poletto, L. T. 2007. "Light transmission through porcelain". Dental materials 23(11): 1363-1368.
Perez, M. M., Ghinea, R., Ugarte-Alvan, L. I., Pulgar, R., Paravina, R. D. 2010. "Color and translucency in silorane-based resin composite compared to universal and nanofilled composites". J Dent 38 Suppl 2: e110-116.
Ragain, J. C., Johnston, W. M. 2001. "Accuracy of Kubelka-Munk reflectance theory applied to human dentin and enamel". Journal of dental research 80(2): 449-452.
Rasetto, F. H., Driscoll, C. F., Prestipino, V., Masri, R., von Fraunhofer, J. A. 2004. "Light transmission through all-ceramic dental materials: a pilot study".
The Journal of prosthetic dentistry 91(5): 441-446.
Ryan, E. A., Tam, L. E., McComb, D. 2010. "Comparative translucency of esthetic composite resin restorative materials". J Can Dent Assoc 76: a84.
Sidhu, S. K., Ikeda, T., Omata, Y., Fujita, M., Sano, H. 2006. "Change of color and translucency by light curing in resin composites". Operative dentistry 31(5): 598-603.
Terry, D. A., Geller, W., Tric, O., Anderson, M. J., Tourville, M., Kobashigawa, A. 2002. "Anatomical form defines color: function, form, and aesthetics".
Practical procedures & aesthetic dentistry 14(1): 59-67.
Winter, R. 1993. "Visualizing the natural dentition". Journal of esthetic dentistry
5(3): 102-117.
Woo, S. T., Yu, B., Ahn, J. S., Lee, Y. K. 2008. "Comparison of translucency between indirect and direct resin composites". J Dent 36(8): 637-642.
Yu, B., Ahn, J., Lee, Y. 2009. "Measurement of translucency of tooth enamel and dentin". Acta odontologica scandinavica 67(1): 57-64.
Yu, B., Lee, Y. 2008a. "Influence of color parameters of resin composites on their translucency". Dental materials 24(9): 1236-1242.
Yu, B., Lee, Y. 2008b. "Translucency of varied brand and shade of resin composites". American journal of dentistry 21(4): 229-232.
Yu, B., Lee, Y. K. 2008c. "Differences in color, translucency and fluorescence between flowable and universal resin composites". J Dent 36(10): 840-846.
Abstract
Evaluation of translucency of resin composites
by two different methods
Dohyun Kim Department of Dentistry
The Graduate School, Yonsei University
(Directed by Sungho Park, D.D.S., M.S.D., Ph.D.)
The purpose of this study was 1) to compare the translucency among seven different kinds of composite materials and among three different shade categories - dentin, enamel and translucent - by determining translucency parameter (TP) and light transmittance (%T), and 2) to evaluate the correlation between the results of two evaluation methods.
3 shades (dentin A3, enamel A3, clear translucent) of 7 composite materials (Beautifil II(BF), Denfil(DF), Empress Direct(ED), Estellite Sigma Quick(ES), Gradia Direct(GD), Premisa(PR), Tetric N-Ceram(TC)) from different manufacturers were screened in this study. 10 disk-shaped specimens (10 ㎜ in diameter and 1 ㎜ in thickness) were prepared for each material. For TP measurement, values for color of each specimen were recorded according to CIELAB color scale against white and black backgrounds with a colorimeter and TP values were calculated. For %T measurement, by using spectrometer and computer software, the light spectrum passed through the specimen was analyzed by determining the mean value for the percentage of direct transmittance in the range between 380 and 780 ㎚. Two-way ANOVA was
performed to compare TP and %T for composite materials and shade categories. One-way ANOVA and Tukey’s test for 7 composite materials in each shade category and for 3 shade categories in each composite material were followed. Correlation between two evaluation methods was determined by Pearson correlation coefficient. All statistical procedures were performed within the confidence level of 95%.
TP and %T showed significant differences among the composite materials and shade categories (p<0.05). TP of different composite materials showed significant differences in various orders in each shade category (p<0.05), and TP of different shade categories showed significant differences in each composite material (p<0.05). %T of different composite materials showed significant differences in various orders in each shade category (p<0.05), and %T of different shade categories showed significant differences in each composite material (p<0.05) except BF and ES.
There was a positive correlation between two evaluation methods, TP and %T (r=0.626, p<0.05). The methods showed strong correlation in each of six composite material (r=0.763-0.992, p<0.05) except ES, and showed moderate correlation in each of three shade categories (r=0.403-0.528, p<0.05).
In this study, two methods showed much stronger correlation when analyzed in each composite material respectively rather than analyzed together, therefore the results suggest that we should use a method that can measure translucency more quantitative in evaluating different kinds of composite materials and it is necessary to establish the standard evaluation for the translucency of composite materials.