2020
E E I
K o r e a M i d - t e r m E n e r g y D e m a n d O u t l o o k ( 2 0 1 9 ~ 2 0 2 4 )
405-11, Jongga-ro, Jung-gu, Ulsan, Korea, 44543 Tel. +82-52-714-2114 Fax. +82-52-714-2028
Korea Mid-term Energy Demand
Outlook (2019~2024)
2020
Korea Mid-term Energy Demand
Outlook (2019~2024)
KOREA ENERGY ECONOMICS INSTITUTE
0 5
1. Total Primary Energy Supply and Total Final Consumption 1
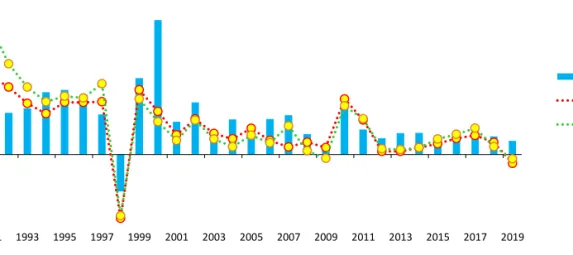
□ Total Primary Energy Supply (“TPES”) grew more slowly than in the past, at an annual average rate of 1.4% between 2014 to 2019.
o TPES grew by 1.6-2.8% annually between 2014 to 2018, but the average growth rate fell to the mid-1 % level from 2014 to 2019, as it dropped by 1.3% in 2019.
o Total Final Consumption (“TFC”) rose by 1.2-3.9% annually from 2014 to 2018, but the average growth rate fell to 1.9% from 2014 to 2019, as it fell by 0.6% in 2019.
o The slower growth of TPES is attributed to the economic slowdown, changing industrial structure and stagnant electricity consumption and etc.
Figure 1.1 TPES, TFC and GDP growth rates
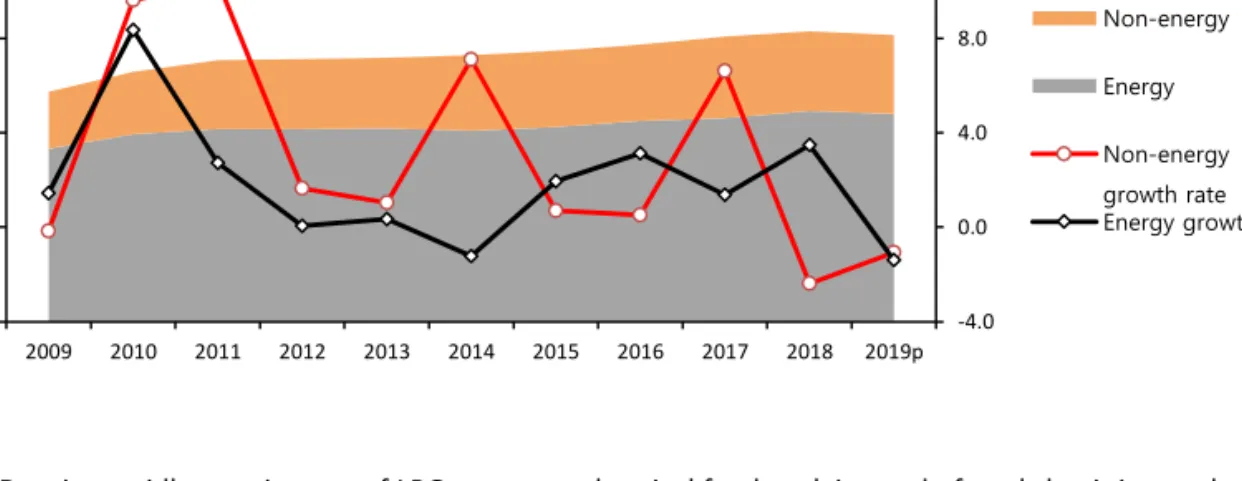
□ Feedstock energy use rose by no more than 0.8% on annual average between 2014 to 2019, because coking coal use declined in the iron & steel industry due to business slowdown.
o The use of feedstock energy (non-energy oil, coking coal) soared by 5.9% on annual average from 2009 to 2014, led by a strong growth in coking coal use, but the growth rate fell to 0.8% from 2014 to 2019, as coking coal use declined.
1 Growth rates of TPES and TFC by energy sources and sectors could be converted to tonnes of oil equivalent, and therefore they could be different from those measured with own unit of energy in (KEEI’s) reports on energy trend and outlook by energy sources.
-10.0 -5.0 0.0 5.0 10.0 15.0 20.0
1991 1993 1995 1997 1999 2001 2003 2005 2007 2009 2011 2013 2015 2017 2019
%
GDP TPES TFC
Korea Mid-term Energy Demand Outlook 2020 3 Figure 1.2 Energy (fuel) and non-energy (feedstock) consumption trend
o Despite rapidly growing use of LPG as a petrochemical feedstock instead of naphtha, it is not classified in the current energy balance as feedstock energy, which implies that the total use of feedstock energy is statistically underestimated.
□ Energy intensity improved rapidly, as energy consumption grew more slowly or decreased.
o Energy intensity (toe/KRW1 million), an indicator of energy efficiency, improved rapidly from 2014 to 2019 compared to the previous five-year period (2009-2014).
o In the case of 2019, a drop in energy consumption was attributed to some factors such as weather conditions rather than energy efficiency, and therefore that year’s energy intensity should not be directly linked to an improvement in energy efficiency.
Figure 1.3 Per capita energy use and energy intensity trend
-4.0 0.0 4.0 8.0 12.0
- 100 200 300 400
2009 2010 2011 2012 2013 2014 2015 2016 2017 2018 2019p
Non-energy Energy Non-energy growth rate Energy growth rate
Mtoe yoy, %
0.12 0.14 0.16 0.18 0.20
- 2.0 4.0 6.0 8.0
2009 2010 2011 2012 2013 2014 2015 2016 2017 2018 2019p
toe/million won toe
Energy consumption per person Energy intensity
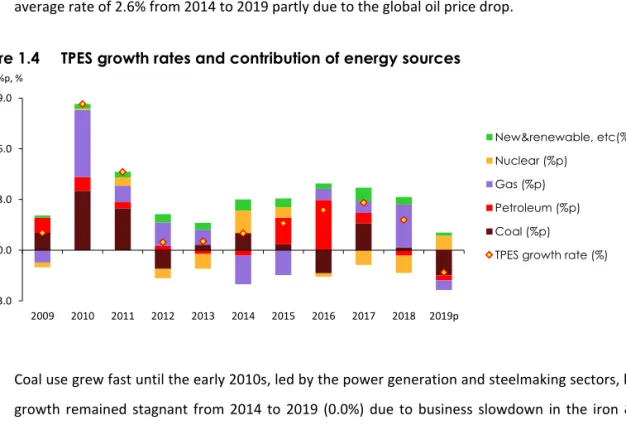
□ Petroleum and gas use grew decently for the past five years (2014-2019), while coal use remained flat, and the use of nuclear energy declined.
o Petroleum use grew at slower rates until the early 2010s due to high oil prices, but it grew at an annual average rate of 2.6% from 2014 to 2019 partly due to the global oil price drop.
Figure 1.4 TPES growth rates and contribution of energy sources
o Coal use grew fast until the early 2010s, led by the power generation and steelmaking sectors, but the growth remained stagnant from 2014 to 2019 (0.0%) due to business slowdown in the iron & steel industry and restrictions on coal-fired generation aimed at fine dust reduction.
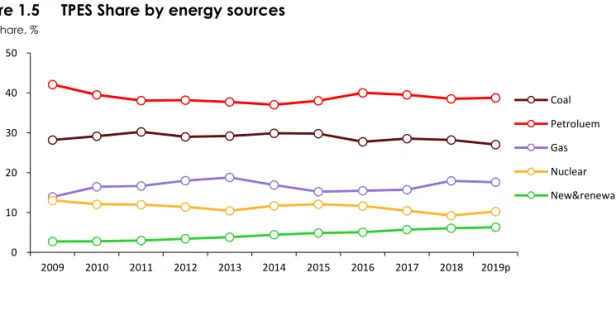
Figure 1.5 TPES Share by energy sources
o Natural gas use rose by 2.2% on annual average from 2014 to 2019, as its use for power generation and district heating grew decently, though it remained flat in the case of city gas production.
- 3.0 0.0 3.0 6.0 9.0
2009 2010 2011 2012 2013 2014 2015 2016 2017 2018 2019p
%p, %
New&renewable, etc(%p) Nuclear (%p)
Gas (%p) Petroleum (%p) Coal (%p)
TPES growth rate (%)
0 10 20 30 40 50
2009 2010 2011 2012 2013 2014 2015 2016 2017 2018 2019p
Share, %
Coal Petroluem Gas Nuclear New&renewable
Korea Mid-term Energy Demand Outlook 2020 5 o Nuclear generation dropped by 1.4% on annual average between 2014 to 2019 as a result of the shutdown of two reactors and increased preventive maintenance under the government’s policy of stricter safety inspections, although it increased in 2019 following the commissioning of a new reactor and due to the low base effect of the previous year.
o Renewable and ‘other’ energy generation rose by 8.8% on annual average from 2014 to 2019 as a result of the government’s support for renewable energy deployment.
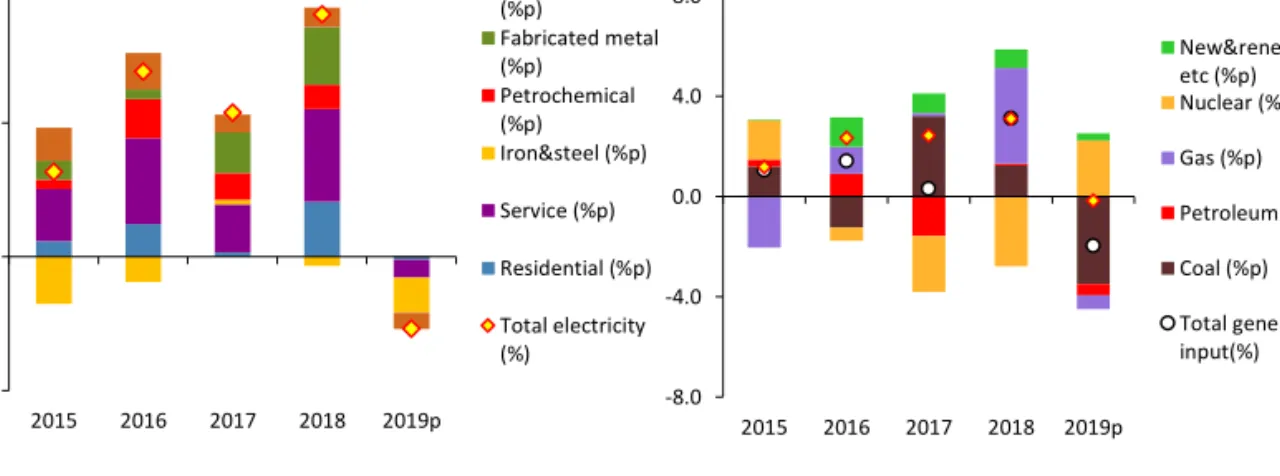
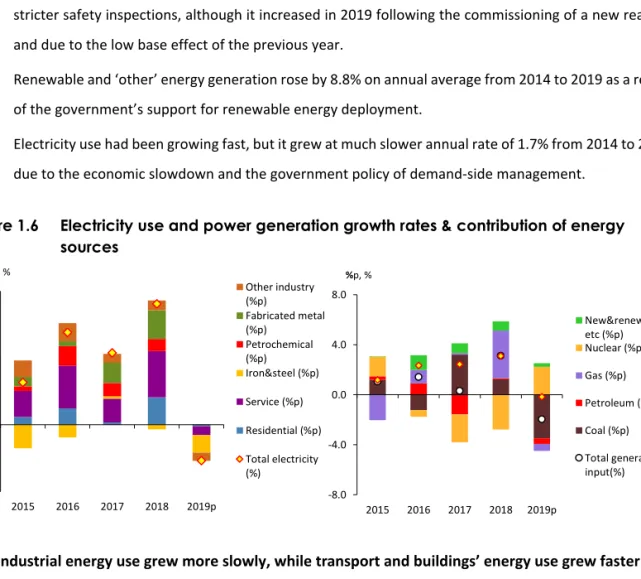
o Electricity use had been growing fast, but it grew at much slower annual rate of 1.7% from 2014 to 2019 due to the economic slowdown and the government policy of demand-side management.
Figure 1.6 Electricity use and power generation growth rates & contribution of energy sources
□ Industrial energy use grew more slowly, while transport and buildings’ energy use grew faster.
o Industrial energy use posted an annual average growth rate of 4.7% from 2009 to 2014, led by the iron
& steel industry, but it plunged to 1.5% from 2014 to 2019 due to weak iron & steel business.
Figure 1.7 Industrial energy use growth rates and contribution of energy sources
- 2.0 0.0 2.0 4.0
2015 2016 2017 2018 2019p
%p, %
Other industry (%p)
Fabricated metal (%p)
Petrochemical (%p) Iron&steel (%p) Service (%p) Residential (%p) Total electricity (%)
-8.0 -4.0 0.0 4.0 8.0
2015 2016 2017 2018 2019p
%p, %
New&renewable, etc (%p) Nuclear (%p) Gas (%p) Petroleum (%p) Coal (%p) Total generation input(%)
- 3.0 0.0 3.0 6.0 9.0
2009 2010 2011 2012 2013 2014 2015 2016 2017 2018 2019p
%p, %
New&renewable (%p) Electricity (%p) Gas (%p) Petroleum (%p) Coal (%p)
Industry Growth rate (%)
o Transport energy use grew by 2.7% on annual average from 2014 to 2019, which is much faster than the previous five-year period, as it surged between 2015 to 2016 in line with the oil price plunge.
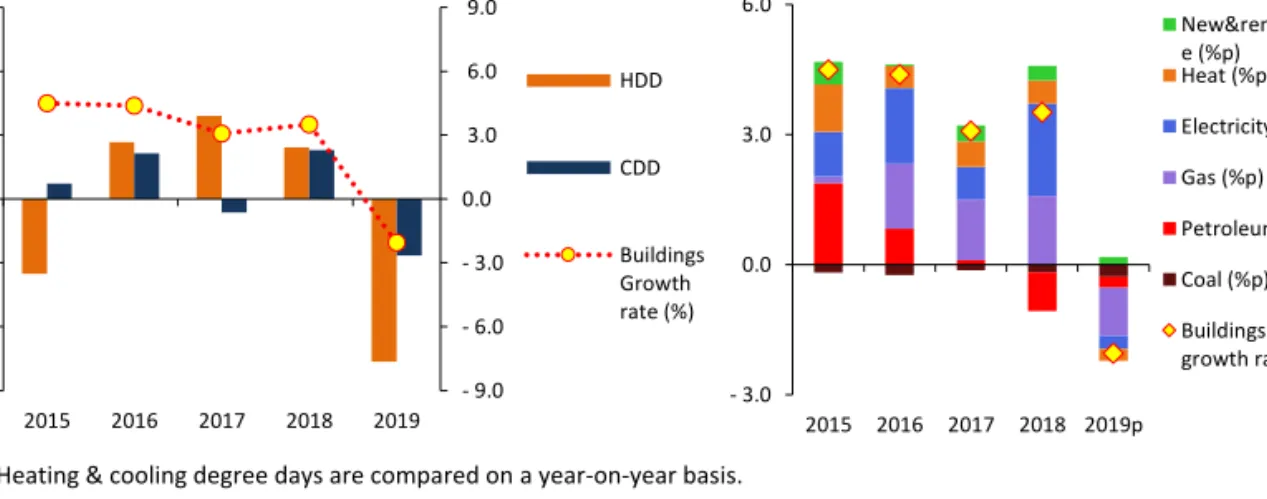
Figure 1.8 Heating & cooling degree days and buildings’ energy use growth rates &
contribution of energy sources
Note: Heating & cooling degree days are compared on a year-on-year basis.
o The growth of buildings’ energy use had continuously slowed down due to the stagnant population growth and enhanced energy efficiency, but it grew at faster rate of 2.7% on annual average from 2014 to 2019 affected by abnormal weather conditions such as extreme heat and cold waves.
- 9.0 - 6.0 - 3.0 0.0 3.0 6.0 9.0
- 300 - 200 - 100 0 100 200 300
2015 2016 2017 2018 2019
Degree days %
HDD
CDD
Buildings Growth rate (%)
- 3.0 0.0 3.0 6.0
2015 2016 2017 2018 2019p
%p, %
New&renewabl e (%p) Heat (%p) Electricity (%p) Gas (%p) Petroleum (%p) Coal (%p) Buildings growth rate(%)
Korea Mid-term Energy Demand Outlook 2020 7
2. TPES & TFC Outlook
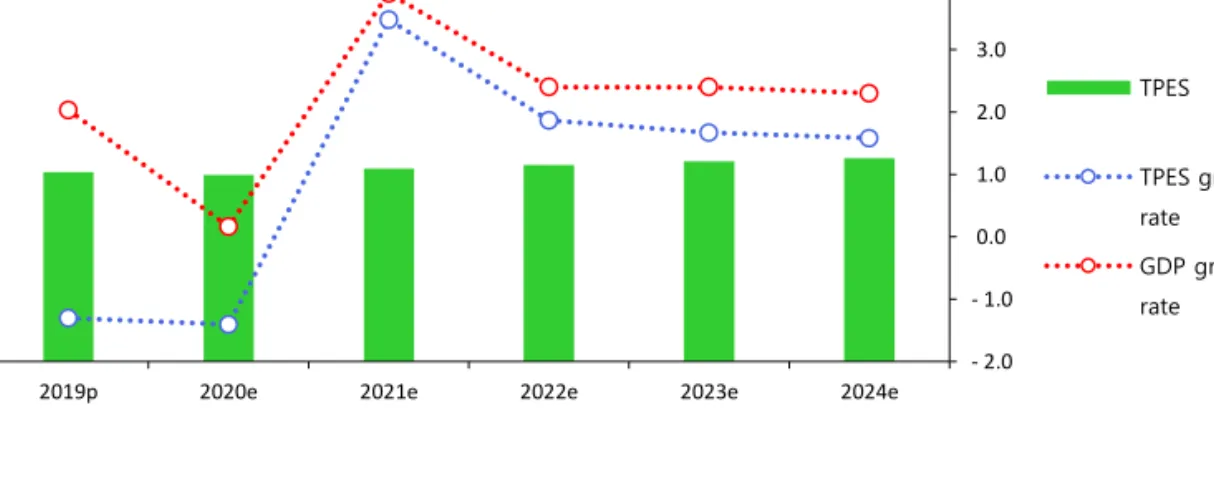
□ TPES is projected to increase at an annual rate of 1.4% from 2019 to 2024, posting 325.8Mtoe in 2024.
o The growth of TPES is likely to fluctuate in a wide range in early years of the outlook period due to the impact of COVID-19, and later the growth will be stabilized at around or over 1.5%.
Figure 2.1 TPES outlook and TPES, GDP growth rate
□ Energy intensity will improve steadily, though its pace could be slower than in the past.
o Energy intensity (toe/KRW 1 million) declined by an annual average rate of 1.2% from 2014 to 2019, and it will continue to improve during the next outlook period, though the rate is projected to drop to 0.8%.
o Per capita energy consumption is forecast to grow from 5.9 toe in 2019 to 6.3 toe in 2024, with an annual average rate of 1.4%.
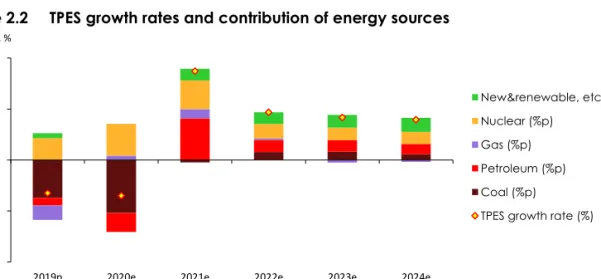
Figure 2.2 TPES growth rates and contribution of energy sources
- 2.0 - 1.0 0.0 1.0 2.0 3.0 4.0
- 100 200 300 400 500 600
2019p 2020e 2021e 2022e 2023e 2024e
yoy, % Mtoe
TPES
TPES growth rate GDP growth rate
- 4.0 - 2.0 0.0 2.0 4.0
2019p 2020e 2021e 2022e 2023e 2024e
%p, %
New&renewable, etc (%p) Nuclear (%p)
Gas (%p) Petroleum (%p) Coal (%p)
TPES growth rate (%)
□ Demand for most energy sources, except nuclear and renewable energy, is expected to grow more slowly than before or decrease.
o Petroleum demand is projected to grow at an annual rate of 1.3% during the outlook period, as the demand rebounds in the transport sector from 2021 after it drops sharply in 2020 hit by COVID-19, and as the demand increases in the industrial sector following the construction or expansion of petrochemical facilities.
o Coal demand is forecast to drop at an annual rate of 0.7% from 2019 to 2024, as its industrial use continues to be stagnant, and the demand drops in the power generation sector despite the commissioning of a new plant, owing to the retirement of old plants and sustained restrictions on coal- fired generation as part of the government’s fine dust reduction efforts.
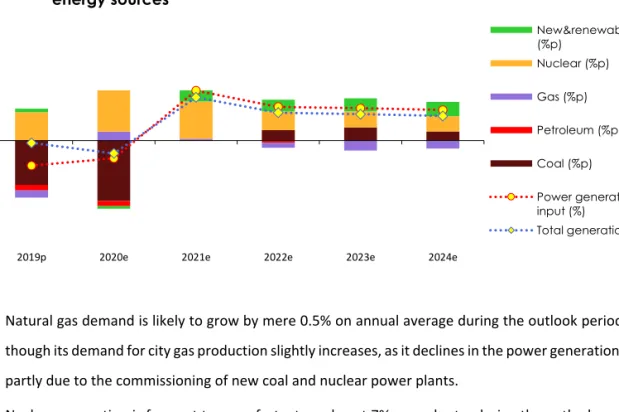
Figure 2.3 Growth rates of energy input for electricity generation and contribution of energy sources
o Natural gas demand is likely to grow by mere 0.5% on annual average during the outlook period, even though its demand for city gas production slightly increases, as it declines in the power generation sector partly due to the commissioning of new coal and nuclear power plants.
o Nuclear generation is forecast to grow fast, at an almost 7% annual rate, during the outlook period, as nuclear capacity factor that was recently extremely low returns to normal level, and a number of new reactors are to be commissioned.
-8.0 -4.0 0.0 4.0 8.0
2019p 2020e 2021e 2022e 2023e 2024e
%p, %
New&renewable, etc (%p)
Nuclear (%p)
Gas (%p)
Petroleum (%p)
Coal (%p)
Power generation input (%)
Total generation (%)
Korea Mid-term Energy Demand Outlook 2020 9 Figure 2.4 TPES growth outlook by energy sources
o Renewable & ‘other’ energy demand is expected to grow from 19.2 Mtoe in 2019 to 25.3 Mtoe in 2024 at an annual average growth rate of 5.7% supported by the government’s renewable energy development policy.
o Electricity demand by end-use is forecast to increase by 1.7% on annual average during the outlook period, even though the demand is likely to drop in 2020 due to the impact of COVID-19, as it rapidly rebounds in the following years.
□ Nuclear and renewable & ‘other’ energy will lead the growth of TPES during the outlook period, accounting for a larger share of TPES.
o Petroleum’s share of TPES is expected to slightly decrease, despite growing use of naphtha and LPG as petrochemical feedstock, as it is continuously replaced by alternate energy sources such as natural gas and electricity to fill fuel demand.
o Still, petroleum will take up the largest share of TPES (38%) in 2024.
o Coal accounted for 27.0% of TPES in 2019, but the share will shrink to 24% by 2024, as its consumption remains stagnant in the industrial sector and decreases in the power generation sector due to the government’s fine dust reduction measures.
o Nuclear energy’s share of TPES is expected to grow from 10.2% in 2019 to 13% in 2024, as its capacity factor that was recently at low level slowly recovers during the outlook period, and four new reactors with a total installed capacity of 1.4GW are scheduled for commissioning.
o Gas share of TPES is expected to drop by around 1%p from 17.6% in 2019 (during the outlook period), as electricity demand comes to a standstill, and its demand declines in the power generation sector with increased share of nuclear energy in total power generation.
-10.0 0.0 10.0 20.0
2019p 2020e 2021e 2022e 2023e 2024e
yoy, %
Coal Petroleum Nuclear Gas
New&renewable
o Renewable & ‘other’ energy’s share of TPES is forecast to expand steadily from 6.3% in 2019 to 8% in 2024 under the government’s renewable energy deployment policy.
Figure 2.5 TPES share forecast by energy sources
□ Final energy demand by end-use sector is forecast to increase at an annual average rate of 1.2%
during the outlook period, reaching 244.9Mtoe in 2024.
o Industrial energy demand is expected to increase, led by the petrochemical and fabricated metals sectors, though its annual growth rate is to be no more than slightly over 1%, as the economic growth stabilizes at low level.
o Transport energy demand is forecast to grow by mere 0.9% on annual average during the outlook period, as it plunges in 2020, especially in the road transport and aviation sectors, due to the impact of COVID- 19 and gradually recovers in the following years.
o Buildings’ energy demand is projected to grow by slightly over 1% annually during the outlook period, mostly electricity and gas.
Figure 2.6 TFC growth rates and contribution of end-use sectors
- 10.0 20.0 30.0 40.0
2019p 2020e 2021e 2022e 2023e 2024e
share, %
Coal Petroleum Nuclear Gas
New&renewable
- 2.0 0.0 2.0 4.0
2019p 2020e 2021e 2022e 2023e 2024e
%p, %
Buildings (%p) Transport (%p) Industry (%p) TFC growth rate (%)
Korea Mid-term Energy Demand Outlook 2020 11
3. Key Features and Implications
Key features of energy consumption in 2019
□ TPES dropped in 2019 for the first time since the 1998 financial crisis.
2o TPES fell by 1.3% year-on-year in 2019 to 303.5Mtoe, despite the 2.0% economic growth.
o The drop in energy use is attributed to decreased energy demand in buildings due to weather conditions, a sharp decline in bunker-c use in the domestic navigation sector following the International Maritime Organization’s environmental regulation and improved generation efficiency with decreased share of coal-fired generation.
□ Coal use dropped most sharply among energy sources, followed by gas and petroleum.
o Coal use dropped by 5.7% year-on-year in 2019, led by a sharp drop (-7.6%) in the power generation sector owing to the shutdown of some plants after safety issues, limited operation of coal power plants as part of the government’s fine dust reduction efforts and increased planned preventive maintenance, although the pace of decline wasn’t fast in the industrial sector.
o Natural gas use was down 3.2% year-on-year in 2019, as it declined in the power generation sector due to falling electricity demand, and also affected by decreased city gas use for heating amid decreased number of heating degree days.
o Petroleum use slid by 0.3% year-on-year in 2019, despite the strong growth in LPG use as industrial feedstock, because the use of naphtha as petrochemical feedstock decreased and bunker-c use plunged as well in the domestic navigation sector.
2
In 1998, the year of the financial crisis, GDP and TPES fell by 5.5% and 9.5% respectively.
Figure 3.1 TPES & TFC growth rates and contribution of energy sources and end-use sectors
Note: The growth rate of TPES (%) = Aggregated total contribution of energy sources (%p), the growth rate of TFC (%) = Aggregated total contribution of end-use sectors (%p)
o Nuclear generation posted a year-on-year growth of 9.3% in 2019, as its installed capacity increased with the commissioning of Shinkori unit 4 (Aug. 2019) and the capacity factor also increased after a large number of reactors resumed operation with the completion of planned preventive maintenance.
o Final use of electricity dropped by 1.1% in 2019 from the previous year, as it declined in both of the industrial and buildings sectors, because the manufacturing production index remained stagnant amid the economic slowdown, and the number of cooling & heating degree days decreased.
□ TFC dropped by 0.6% year-on-year in 2019, as energy consumption declined in all end-use sectors.
o Industrial energy use fell by 0.1% in 2019 from the previous year due to decreased use of electricity and naphtha amid increased maintenance at naphtha cracking centers, despite slightly increased use of bituminous coal for steelmaking in the primary metals sector and growing LPG use in the petrochemical sector.
o Transport energy use decreased by 0.9% year-on-year in 2019, as bunker-c use plunged in the domestic navigation sector following the environmental regulation by the IMO, even though energy use increased in the road transport sector owing to the decreased petroleum product prices as a result of the global oil price decrease and temporary fuel tax relief.
o Buildings’ energy use went down by 2.0% year-on-year in 2019, as the number of cooling & heating degree days fell sharply compared to 2018 when extreme weather events—heat and cold waves—were observed.
- 4.0 - 2.0 0.0 2.0 4.0 6.0
2017 2018 2019p
%p, %
New&renewable, etc (%p) Nuclear (%p) Gas (%p) Petroleum (%p) Coal (%p) TPES growth rate (%)
- 1.0 0.0 1.0 2.0 3.0 4.0 5.0
2017 2018 2019p
%p, %
Buildings (%p) Transport (%p) Industry (%p) TFC growth rate (%)
Korea Mid-term Energy Demand Outlook 2020 13 The COVID-19 crisis and economic uncertainties
□ The global COVID-19 situation needs to be considered when forecasting the future energy demand, as it is maximizing global economic uncertainties.
o The global economic growth was strongly hindered by the COVID-19 pandemic in 1H 2020, as countries around the world imposed nationwide lockdown measures, shut down the borders and enhanced disease prevention efforts, which led to a contraction in production. The COVID-19 spread is expected to be brought under control in the near future with the development of a vaccine or treatment. However, the global economic growth will return in a gradual manner, as there will be repeated outbreaks in each country at different times and the government’s intervention measures have varying levels of success.
o The pace of economic recovery will differ by region, depending on how far the virus spreads and the success of disease prevention measures.
□ Changing behaviors and ways of living due to COVID-19 are likely to affect the economic recovery and energy demand growth.
o Public concerns over COVID-19 infection is changing their behaviors and ways of living, which could affect the pace of economic recovery, recovery by type of business & sector and structure and level of energy use.
High and low economic growth scenarios
□ TPES increases at an annual rate of 1.8% under a high economic growth scenario and 0.9% under a low economic growth scenario during the outlook period.
o Considering economic uncertainties created by COVID-19 during the outlook period, the high and low growth scenarios were devised.
o During the outlook period, TPES grows by an annual rate of 1.8% to 331.7Mtoe in 2024 under the high
growth scenario and no more than 0.9% to 317.2Mtoe in 2024 under the low growth scenario.
Figure 3.2 GDP assumptions and TPES outlook across three scenarios
o During the outlook period (2019-2024), TFC increases by an annual rate of 1.6% to 250.0Mtoe in 2024 under the high economic growth scenario and remains almost flat with an annual average growth rate of 0.6%, reaching 238.2Mtoe in 2024 under the low economic growth scenario.
Figure 3.3 TPES & TFC outlook in 2024 across three scenarios
o Energy intensity improves by 1.0% on annual average to 0.157(toe/KRW 1 million) in 2024 under the high economic growth scenario and by 0.6% to 0.160 (toe/ KRW 1 million) in 2024 under the low economic growth scenario.
290 300 310 320 330 340
2019 2020 2021 2022 2023 2024
Mtoe TPES
1,700 1,800 1,900 2,000 2,100 2,200
2019 2020 2021 2022 2023 2024
Trilion won
GDP
BAU HEG LEG
77.1 78.3 79.0
120.7 124.4 127.3
51.2 54.7 56.9
43.0 43.0 43.0
25.2 25.3 25.5
- 100 200 300 400
LEG BAU HEG
Mtoe TPES
Coal Petroleum Gas Nuclear New&renwable, hydro
147.7 151.7 154.8
43.2 44.6 45.9
47.3 48.7 49.4
- 100 200 300 400
LEG BAU HEG
Mtoe TPES
Industry Transport Buildings
Korea Mid-term Energy Demand Outlook 2020 15
The Main Indicator and Energy Outlook Result
Main Economic and Energy Indicators - BAU Scenario
CAGR (%)
2016 2017 2018 2019p 2020e 2021e 2022e 2023e 2024e 09-19 19-24
Economy and Population
GDP (2010 trillion won) 1 706.9 1 760.8 1 807.7 1 844.5 1 847.5 1 919.6 1 965.7 2 012.9 2 059.2 3.3 2.2 Industrial Production(2010=100) 102.2 104.8 106.4 106.3 107.5 109.9 111.4 113.7 115.5 2.9 1.7 Crude Oil Price (Dubai, USD/bbl) 41.2 53.2 69.4 63.5 37.2 54.4 57.1 59.7 63.2 0.3 - 0.1
Working Days 273.0 269.5 270.0 272.5 275.0 276.0 275.5 274.5 272.5 - -
Population (million) 51.2 51.4 51.6 51.7 51.8 51.8 51.8 51.9 51.9 0.5 0.1
Average Temperature (ºC) 13.6 13.1 13.0 13.5 13.5 13.1 13.1 13.1 13.1 0.4 - 0.7 Cooling Degree days 154.1 132.7 209.0 120.4 112.1 112.1 112.1 112.1 112.1 10.5 - 1.4 Heating Degree days 2 386.8 2 517.1 2 597.8 2 342.9 2 348.4 2 486.7 2 486.7 2 486.7 2 501.5 - 0.3 1.3
Energy Indicators
Total Primary Energy Demand (Mtoe) 293.8 302.1 307.5 303.5 299.2 309.7 315.4 320.7 325.8 2.2 1.4 Energy Intensity (toe/million won) 0.172 0.172 0.170 0.165 0.162 0.162 0.161 0.160 0.158 - 1.0 - 0.8 TPED/capita (toe/capita) 5.736 5.881 5.959 5.869 5.779 5.975 6.084 6.183 6.278 1.7 1.4 Electricity Generation (TWh) 540.4 553.5 570.6 569.6 563.9 583.1 595.9 608.4 620.2 2.8 1.7 Electricity Generation/capita (MWh/capita) 10.6 10.8 11.1 11.0 10.9 11.3 11.5 11.7 12.0 2.3 1.6 Electricity Demand/capita (MWh/capita) 9.7 9.9 10.2 10.1 10.0 10.3 10.5 10.7 10.9 2.3 1.6
Energy Demand - BAU Scenario
CAGR (%)
2016 2017 2018 2019p 2020e 2021e 2022e 2023e 2024e 09-19 19-24 Total Primary
Energy Supply
Coal (Mton) 129.3 139.8 141.0 133.0 122.8 123.4 125.1 127.1 128.7 2.1 - 0.7 Oil (Mbbl) 921.1 937.1 931.8 929.0 920.2 957.3 969.4 981.4 991.9 1.8 1.3
Gas (Bm3) 34.9 36.4 42.3 40.9 41.3 42.2 42.3 42.1 41.9 4.6 0.5
Hydro (TWh) 6.6 7.0 7.3 6.2 6.6 7.5 7.5 7.5 7.5 1.0 3.7
Nuclear (TWh) 162.0 148.4 133.5 145.9 163.7 179.5 187.7 194.9 202.1 - 0.1 6.7 Other Renewables
(Mtoe) 13.6 15.8 17.1 17.9 17.8 19.0 20.4 22.0 23.7 12.6 5.8
Total (Mtoe) 293.8 302.1 307.5 303.5 299.2 309.7 315.4 320.7 325.8 2.2 1.4
Coal 81.5 86.2 86.7 82.1 75.8 75.5 76.5 77.5 78.3 1.8 - 0.9
Oil 117.6 119.4 118.5 117.6 115.4 120.2 121.7 123.1 124.4 1.4 1.1
Gas 45.5 47.5 55.2 53.5 54.0 55.1 55.3 54.9 54.7 4.7 0.5
Nuclear 1.4 1.5 1.5 1.3 1.4 1.6 1.6 1.6 1.6 0.9 3.7
Hydro 34.2 31.6 28.4 31.1 34.9 38.2 40.0 41.5 43.0 - 0.2 6.7
Other Renewables 13.6 15.8 17.1 17.9 17.8 19.0 20.4 22.0 23.7 12.6 5.8
Total Final
Consumption
Coal (Mton) 49.0 50.4 49.2 48.2 47.4 47.9 48.0 47.9 47.9 3.4 - 0.1
Oil (Mbbl) 899.3 926.6 920.0 920.3 913.4 950.5 963.8 975.7 986.3 2.0 1.4
Gas (Bm3) 21.3 22.6 24.3 23.3 23.0 23.7 24.2 24.6 24.9 2.4 1.4
Electricity (TWh) 497.0 507.7 526.1 520.5 517.4 532.8 544.1 555.4 566.2 2.8 1.7
Heat (Mtoe) 2.2 2.4 2.7 2.6 2.6 2.7 2.7 2.8 2.9 4.1 2.8
Other Renewables
(Mtoe) 7.2 8.6 9.1 9.3 9.6 9.9 10.3 10.6 10.9 6.7 3.2
Total (Mtoe) 221.4 230.0 232.7 231.2 228.2 235.4 239.0 242.0 244.9 2.5 1.2
Coal 32.3 33.4 32.4 32.0 31.2 30.9 30.9 30.7 30.5 3.3 - 0.9
Oil 114.3 117.9 116.8 116.4 114.5 119.4 121.0 122.4 123.7 1.7 1.2
Gas 22.7 24.1 26.4 26.1 25.8 26.7 27.2 27.7 28.1 3.0 1.5
Electricity 42.7 43.7 45.2 44.8 44.5 45.8 46.8 47.8 48.7 2.8 1.7
Heat 2.2 2.4 2.7 2.6 2.6 2.7 2.7 2.8 2.9 4.1 2.8
Other Renewables 7.2 8.6 9.1 9.3 9.6 9.9 10.3 10.6 10.9 6.7 3.2
Industry 135.2 141.9 142.9 142.7 142.7 146.0 148.0 150.0 151.7 3.1 1.2
Transport 42.3 42.8 43.0 42.6 40.1 42.9 43.7 44.1 44.6 1.7 0.9
Buildings 44.0 45.3 46.9 46.0 45.4 46.6 47.3 48.0 48.7 1.4 1.2
Korea Mid-term Energy Demand Outlook 2020 17 Energy Demand - BAU Scenario
(yoy, %)
CAGR (%)
2016 2017 2018 2019p 2020e 2021e 2022e 2023e 2024e 09-19 19-24 Total Primary
Energy Supply
Coal (Mton) - 4.3 8.1 0.9 - 5.7 - 7.7 0.5 1.4 1.6 1.2 2.1 - 0.7
Oil (Mbbl) 8.0 1.7 - 0.6 - 0.3 - 0.9 4.0 1.3 1.2 1.1 1.8 1.3
Gas (Bm3) 4.4 4.3 16.2 - 3.2 1.0 2.0 0.3 - 0.6 - 0.4 4.6 0.5
Hydro (TWh) 14.5 5.5 3.9 - 14.3 6.4 12.6 0.0 0.0 0.3 1.0 3.7
Nuclear (TWh) - 1.7 - 8.4 - 10.1 9.3 12.2 9.7 4.6 3.9 3.7 - 0.1 6.7
Other Renewables
(Mtoe) 5.7 16.7 8.0 4.7 - 0.6 6.6 7.5 7.7 7.9 12.6 5.8
Total (Mtoe) 2.4 2.8 1.8 - 1.3 - 1.4 3.5 1.9 1.7 1.6 2.2 1.4
Coal - 4.6 5.7 0.6 - 5.3 - 7.7 - 0.4 1.3 1.4 1.0 1.8 - 0.9
Oil 7.8 1.5 - 0.7 - 0.8 - 1.9 4.2 1.2 1.2 1.1 1.4 1.1
Gas 4.4 4.4 16.2 - 3.2 1.0 2.0 0.3 - 0.6 - 0.4 4.7 0.5
Nuclear 14.5 6.5 3.9 - 14.3 6.4 12.6 0.0 0.0 0.3 0.9 3.7
Hydro - 1.7 - 7.5 - 10.1 9.3 12.2 9.7 4.6 3.9 3.7 - 0.2 6.7
Other Renewables 5.7 16.7 8.0 4.7 - 0.6 6.6 7.5 7.7 7.9 12.6 5.8
Total Final
Consumption
Coal (Mton) - 6.8 2.7 - 2.3 - 2.1 - 1.7 1.2 0.2 - 0.4 0.1 3.4 - 0.1
Oil (Mbbl) 7.3 3.0 - 0.7 0.0 - 0.7 4.1 1.4 1.2 1.1 2.0 1.4
Gas (Bm3) 2.3 6.3 7.4 - 4.1 - 1.1 3.1 2.0 1.7 1.3 2.4 1.4
Electricity (TWh) 2.8 2.2 3.6 - 1.1 - 0.6 3.0 2.1 2.1 1.9 2.8 1.7
Heat (Mtoe) 11.0 11.8 9.9 - 4.9 0.2 3.8 2.3 3.3 4.5 4.1 2.8
Other Renewables
(Mtoe) - 5.6 20.4 5.5 2.6 2.4 3.8 3.3 3.3 3.2 6.7 3.2
Total (Mtoe) 3.0 3.9 1.2 - 0.6 - 1.3 3.2 1.5 1.3 1.2 2.5 1.2
Coal - 7.2 3.1 - 2.8 - 1.4 - 2.4 - 0.9 - 0.1 - 0.8 - 0.5 3.3 - 0.9
Oil 6.9 3.1 - 0.9 - 0.3 - 1.7 4.3 1.4 1.2 1.1 1.7 1.2
Gas 2.6 6.0 9.9 - 1.1 - 1.2 3.2 2.1 1.8 1.4 3.0 1.5
Electricity 2.8 2.2 3.6 - 1.1 - 0.6 3.0 2.1 2.1 1.9 2.8 1.7
Heat 11.0 11.8 9.9 - 4.9 0.2 3.8 2.3 3.3 4.5 4.1 2.8
Other Renewables - 5.6 20.4 5.5 2.6 2.4 3.8 3.3 3.3 3.2 6.7 3.2
Industry 1.6 5.0 0.7 - 0.1 - 0.0 2.3 1.4 1.3 1.2 3.1 1.2
Transport 6.1 1.2 0.4 - 0.9 - 5.7 6.8 1.9 1.1 1.1 1.7 0.9
Buildings 4.4 3.1 3.5 - 2.0 - 1.2 2.6 1.5 1.5 1.5 1.4 1.2
Energy Demand by Sector - BAU Scenario
(Mtoe)
CAGR (%)
2016 2017 2018 2019p 2020e 2021e 2022e 2023e 2024e 09-19 19-24 Industry 135.2 141.9 142.9 142.7 142.7 146.0 148.0 150.0 151.7 3.1 1.2
Coal 31.8 32.8 32.0 31.7 30.9 30.6 30.6 30.4 30.2 3.7 - 0.9
Oil 66.8 69.8 69.3 69.4 70.5 72.5 73.5 74.6 75.5 2.1 1.7
Gas 8.0 8.8 10.5 10.7 10.5 11.1 11.4 11.7 12.0 6.2 2.3
Electricity 23.2 23.8 24.4 24.1 23.7 24.5 25.1 25.6 26.1 3.5 1.6
Heat - - - -
Other Renewables 5.3 6.6 6.7 6.8 7.0 7.2 7.4 7.6 7.8 5.8 2.8
Transport 42.3 42.8 43.0 42.6 40.1 42.9 43.7 44.1 44.6 1.7 0.9
Coal - - - -
Oil 40.3 40.9 40.8 40.4 38.0 40.7 41.5 41.9 42.4 1.6 1.0
Gas 1.3 1.3 1.2 1.2 1.2 1.2 1.2 1.1 1.1 2.4 - 1.4
Electricity 0.2 0.2 0.3 0.3 0.3 0.3 0.3 0.3 0.3 3.0 6.1
Heat - - - -
Other Renewables 0.4 0.4 0.7 0.7 0.7 0.7 0.7 0.7 0.7 10.5 1.1
Buildings* 44.0 45.3 46.9 46.0 45.4 46.6 47.3 48.0 48.7 1.4 1.2
Coal 0.6 0.5 0.4 0.3 0.3 0.3 0.3 0.3 0.3 - 10.7 - 1.0
Oil 7.1 7.2 6.8 6.6 6.0 6.2 6.0 5.9 5.8 - 1.1 - 2.5
Gas 13.4 14.0 14.7 14.2 14.1 14.4 14.6 14.8 15.0 1.2 1.1
Electricity 19.3 19.6 20.6 20.5 20.5 21.0 21.5 21.9 22.3 2.0 1.7
Heat 2.2 2.4 2.7 2.6 2.6 2.7 2.7 2.8 2.9 4.1 2.8
Other Renewables 1.4 1.6 1.7 1.8 1.9 2.0 2.1 2.2 2.4 9.5 5.5
Transform 139.5 141.4 147.7 143.5 141.8 147.1 150.9 154.6 158.1 2.1 2.0
Coal 49.2 52.8 54.2 50.1 44.6 44.6 45.6 46.8 47.7 0.9 - 1.0
Oil 3.3 1.5 1.7 1.2 0.9 0.9 0.7 0.7 0.7 - 11.5 - 10.9
Gas 45.0 46.7 53.8 51.3 51.8 52.8 52.9 52.5 52.3 4.2 0.4
Nuclear 34.2 31.6 28.4 31.1 34.9 38.2 40.0 41.5 43.0 - 0.2 6.7
Hydro 1.4 1.5 1.5 1.3 1.4 1.6 1.6 1.6 1.6 0.9 3.7
Renewables 6.4 7.2 8.0 8.6 8.2 9.1 10.2 11.4 12.8 30.2 8.3
* include residential, commercial, public∙etc usage
Korea Mid-term Energy Demand Outlook 2020 19 Coal - BAU Scenario
(Mton)
CAGR (%)
2016 2017 2018 2019p 2020e 2021e 2022e 2023e 2024e 09-19 19-24 Total Coal Demand 129.3 139.8 141.0 133.0 122.8 123.4 125.1 127.1 128.7 2.1 - 0.7
Transform 80.3 89.4 91.8 84.8 75.4 75.4 77.1 79.3 80.8 1.4 - 1.0
Power Generation 80.3 89.4 91.8 84.8 75.4 75.4 77.1 79.3 80.8 1.4 - 1.0
Heat - - - -
Gas Manufacture - - - -
Total Final
Consumption 49.0 50.4 49.2 48.2 47.4 47.9 48.0 47.9 47.9 3.4 - 0.1
Industry 47.8 49.3 48.3 47.6 46.8 47.5 47.7 47.5 47.6 3.8 0.0
Transport - - - -
Buildings 1.3 1.1 0.9 0.6 0.5 0.4 0.4 0.3 0.3 - 10.5 - 15.4
-
Consumption by
products
Anthracite 10.8 8.3 9.2 7.9 7.0 7.2 6.9 6.8 6.8 - 1.9 - 3.0
Bituminous 118.5 131.5 131.8 125.1 115.8 116.2 118.2 120.3 121.9 2.4 - 0.5
Iron making 33.5 36.3 34.6 35.0 35.0 35.6 36.1 36.3 36.5 5.4 0.9
Cement 4.6 4.2 3.7 4.0 3.9 3.7 3.5 3.2 3.0 - 1.1 - 5.2
Power
Generation 77.8 88.3 90.8 83.6 74.5 74.5 76.3 78.4 80.0 1.6 - 0.9
Oil - BAU Scenario
(Mbbl)
CAGR (%)
2016 2017 2018 2019p 2020e 2021e 2022e 2023e 2024e 09-19 19-24 Total Oil Demand 921.1 937.1 931.8 929.0 920.2 957.3 969.4 981.4 991.9 1.8 1.3
Transform 21.8 10.5 11.7 8.7 6.8 6.8 5.6 5.6 5.6 - 10.5 - 8.4
Power Generation 19.3 8.1 8.6 5.4 2.3 2.2 0.8 0.7 0.6 - 13.1 - 36.3
Heat 1.3 1.2 1.1 2.1 3.4 3.4 3.5 3.6 3.8 - 0.5 11.9
Gas Manufacture 1.2 1.2 2.0 1.2 1.2 1.2 1.2 1.2 1.3 - 7.1 1.5
Total Final
Consumption 899.3 926.6 920.0 920.3 913.4 950.5 963.8 975.7 986.3 2.0 1.4
Industry 542.6 567.0 564.1 567.2 580.6 596.4 604.7 613.9 621.7 2.7 1.9
Transport 300.5 303.2 302.3 300.3 282.6 302.3 308.2 311.5 314.8 1.5 0.9
Buildings 56.3 56.4 53.7 52.8 50.3 51.7 51.0 50.3 49.8 - 1.0 - 1.1
Consumption by
products
Gasoline 78.9 79.6 79.7 82.8 78.8 83.3 84.9 85.3 85.8 2.3 0.7
Diesel (including
Transformation) 163.5 165.9 164.1 167.0 155.4 166.0 167.1 168.2 169.0 2.4 0.2 Kerosene
(including Transformation)
19.1 19.0 18.9 17.1 15.4 15.7 14.9 14.3 13.8 - 4.1 - 4.2
B-C (including
Transformation) 47.5 35.8 33.7 24.4 22.7 23.7 22.8 21.8 21.4 - 9.9 - 2.6
Jet Oil 37.0 38.2 39.9 38.8 33.9 40.0 42.1 44.0 46.1 4.0 3.5
LPG (including
Transformation) 109.0 105.1 109.4 122.1 139.6 142.8 144.6 147.0 148.4 1.4 4.0
Naphtha 430.1 458.4 451.2 438.6 437.2 447.6 454.3 461.4 467.7 3.1 1.3
Other Non-Energy 36.1 35.1 35.1 38.0 37.3 38.3 38.8 39.3 39.7 2.5 0.9
Korea Mid-term Energy Demand Outlook 2020 21 Gas - BAU Scenario
CAGR (%)
2016 2017 2018 2019p 2020e 2021e 2022e 2023e 2024e 09-19 19-24 Total Gas Demand
(Mton) 34.9 36.4 42.3 40.9 41.3 42.2 42.3 42.1 41.9 4.6 0.5
Transform 34.5 35.8 41.2 39.3 39.7 40.4 40.5 40.2 40.0 4.2 0.4
Power Generation 15.5 15.6 18.9 18.4 19.1 19.2 18.8 18.1 17.5 6.6 - 1.0
Heat 1.6 1.7 2.3 1.9 1.9 1.9 2.0 2.1 2.1 13.8 2.5
Gas Manufacture 17.5 18.5 20.0 18.9 18.7 19.3 19.7 20.1 20.3 1.8 1.5
Industry 0.4 0.6 1.1 1.7 1.6 1.7 1.8 1.8 1.9 - 2.1
City Gas (Bm3) 21.3 22.6 24.3 23.3 23.0 23.7 24.2 24.6 24.9 2.4 1.4
Industry* 7.2 7.8 8.8 8.3 8.1 8.6 8.8 9.1 9.3 4.0 2.3
Transport 1.2 1.2 1.2 1.2 1.2 1.1 1.1 1.1 1.1 2.6 - 1.4
Buildings 12.8 13.6 14.3 13.8 13.7 14.0 14.2 14.4 14.5 1.4 1.1
* exclude industrial LNG usage
Electricity - BAU Scenario
(TWh)
증가율 (%)
2016 2017 2018 2019p 2020e 2021e 2022e 2023e 2024e 09-
19 19-
24 Net Electricity Demand 540.4 553.5 570.6 569.6 563.9 583.1 595.9 608.4 620.2 2.8 1.7
Own use and Losses 43.4 45.8 44.5 49.1 46.5 50.3 51.8 52.9 54.0 2.3 1.9
Total Final Consumption 497.0 507.7 526.1 520.5 517.4 532.8 544.1 555.4 566.2 2.8 1.7
Industry 270.0 276.7 283.7 279.8 275.9 285.1 291.3 297.5 303.4 3.5 1.6
Transport 2.7 2.8 3.0 2.9 3.0 3.2 3.4 3.6 3.9 3.0 6.0
Buildings 224.4 228.3 239.5 237.8 238.4 244.5 249.5 254.3 259.0 2.0 1.7
Installed Electrical Capacity (GW)* 104.1 116.4 118.5 123.7 127.7 132.9 135.6 141.2 145.6 5.3 3.3
Coal 31.4 36.8 37.0 37.0 37.2 38.6 38.7 40.8 40.7 4.3 1.9
Oil 4.1 4.1 4.3 3.9 2.1 2.1 0.9 0.9 0.4 - 3.4 -
35.4
Gas 32.6 37.5 37.9 39.4 41.3 41.3 42.3 41.7 42.3 8.2 1.4
Nuclear 22.2 22.5 21.9 23.3 24.7 26.1 26.1 26.8 27.3 2.8 3.2
Hydro 6.5 6.5 6.5 6.5 6.5 6.5 6.5 6.5 6.5 1.7 0.0
Other Renewables 7.3 8.9 11.0 13.6 15.9 18.3 21.2 24.5 28.4 17.4 15.8
Electricity Generation of Power Plants* 540.4 553.5 570.6 560.2 562.0 583.1 595.9 608.4 620.2 2.7 2.1
Coal 213.8 238.8 238.4 227.4 207.5 207.5 212.1 218.1 222.3 1.6 - 0.5
Oil 14.0 5.3 5.7 4.2 1.8 1.8 0.7 0.6 0.5 - 11.5 -
35.6
Gas 121.0 126.0 153.5 143.7 151.0 152.4 149.4 144.0 139.4 8.2 - 0.6
Nuclear 162.0 148.4 133.5 145.9 163.7 179.5 187.7 194.9 202.1 - 0.1 6.7
Hydro 6.6 7.0 7.3 6.2 6.6 7.5 7.5 7.5 7.5 - 2.0 3.7
Other Renewables 23.0 28.0 32.2 32.8 31.3 34.4 38.5 43.2 48.5 - 8.1
Fuel Consumption of Power Plants (Mtoe)* 114.4 114.7 118.3 116.0 114.3 118.8 122.0 125.1 128.2 2.0 2.0
Coal 49.2 52.8 54.2 50.1 44.6 44.6 45.6 46.8 47.7 0.9 - 1.0
Oil 3.0 1.2 1.3 0.8 0.3 0.3 0.1 0.1 0.1 - 13.5 -
36.2
Gas 20.2 20.4 24.7 24.1 24.9 25.1 24.6 23.7 22.9 6.7 - 1.0
Nuclear 34.2 31.6 28.4 31.1 34.9 38.2 40.0 41.5 43.0 - 0.2 6.7
Hydro 1.4 1.5 1.5 1.3 1.4 1.6 1.6 1.6 1.6 0.9 3.7
Other Renewables 6.4 7.2 8.0 8.6 8.2 9.1 10.2 11.4 12.8 30.2 8.3
* District Heat is classified by fuel type since 2014
Korea Mid-term Energy Demand Outlook 2020 23 Heat and Other Renewables - BAU Scenario
(Mtoe)
CAGR (%)
2016 2017 2018 2019p 2020e 2021e 2022e 2023e 2024e 09-19 19-24
Net Heat Demand 2.2 2.4 2.6 2.5 2.5 2.6 2.7 2.8 2.9 4.4 2.8
Own use and
Losses 0.0 0.0 - 0.0 - 0.0 - 0.0 - 0.0 - 0.0 - 0.0 - 0.0 - 10.8 4.0
Total Final
Consumption 2.2 2.4 2.7 2.6 2.6 2.7 2.7 2.8 2.9 4.1 2.8
Industry - - - -
Transport - - - -
Buildings 2.2 2.4 2.7 2.6 2.6 2.7 2.7 2.8 2.9 4.1 2.8
Heat Production
by fuel
Coal - - - -
Oil 1.4 1.5 1.7 1.7 1.7 1.7 1.8 1.8 1.9 5.7 2.8
Gas 0.8 1.0 0.9 0.9 0.9 0.9 0.9 0.9 1.0 2.4 2.7
Nuclear - - - -
Hydro - - - -
Other Renewables - - - -
Fuel Consumption
of District Heat
Coal - - - -
Oil 0.2 0.2 0.2 0.3 0.4 0.4 0.4 0.4 0.5 - 2.7 11.1
Gas 2.0 2.2 2.9 2.5 2.5 2.5 2.6 2.7 2.8 13.8 2.5
Nuclear - - - -
Hydro - - - -
Other Renewables - - - -
Other Renewables 15.0 17.3 18.7 19.2 19.2 20.6 22.0 23.6 25.3 11.1 5.7
Hydro 1.4 1.5 1.5 1.3 1.4 1.6 1.6 1.6 1.6 0.9 3.7
Transform 6.4 7.2 8.0 8.6 8.2 9.1 10.2 11.4 12.8 30.2 8.3
Total Final
Consumption 7.2 8.6 9.1 9.3 9.6 9.9 10.3 10.6 10.9 6.7 3.2
Industry 5.3 6.6 6.7 6.8 7.0 7.2 7.4 7.6 7.8 5.8 2.8
Transport 0.4 0.4 0.7 0.7 0.7 0.7 0.7 0.7 0.7 10.5 1.1
Buildings 1.4 1.6 1.7 1.8 1.9 2.0 2.1 2.2 2.4 9.5 5.5
Main Economic and Energy Indicators - HEG Scenario
GACR (%)
2016 2017 2018 2019p 2020e 2021e 2022e 2023e 2024e 09-19 19-24
Economy and Population
GDP (2010 trillion won) 1 706.9 1 760.8 1 807.7 1 844.5 1 864.0 1 946.0 2 002.4 2 060.5 2 118.2 3.3 2.8 Industrial Production(2010=100) 102.2 104.8 106.4 106.3 108.0 110.7 112.6 115.3 117.5 2.9 2.0 Crude Oil Price (Dubai, USD/bbl) 41.2 53.2 69.4 63.5 37.2 54.4 57.1 59.7 63.2 0.3 - 0.1 Working Days 273.0 269.5 270.0 272.5 275.0 276.0 275.5 274.5 272.5 - 0.0 -
Population (million) 51.2 51.4 51.6 51.7 51.8 51.8 51.8 51.9 51.9 0.5 0.1
Average Temperature (ºC) 13.6 13.1 13.0 13.5 13.5 13.1 13.1 13.1 13.1 0.4 - 0.7 Cooling Degree days 154.1 132.7 209.0 120.4 112.1 112.1 112.1 112.1 112.1 10.5 - 1.4 Heating Degree days 2 386.8 2 517.1 2 597.8 2 342.9 2 348.4 2 486.7 2 486.7 2 486.7 2 501.5 - 0.3 1.3
Energy Indicators
Total Primary Energy Demand (Mtoe) 293.8 302.1 307.5 303.5 300.7 311.8 318.6 325.1 331.7 2.2 1.8 Energy Intensity (toe/million won) 0.172 0.172 0.170 0.165 0.162 0.160 0.159 0.158 0.157 - 1.0 - 1.0 TPED/capita (toe/capita) 5.736 5.881 5.959 5.869 5.807 6.018 6.145 6.267 6.394 1.7 1.7 Electricity Generation (TWh) 540.4 553.5 570.6 563.0 566.5 587.3 602.0 616.1 629.5 2.6 2.3 Electricity Generation/capita (MWh/capita) 10.6 10.8 11.1 10.9 10.9 11.3 11.6 11.9 12.1 2.2 2.2 Electricity Demand/capita (MWh/capita) 9.7 9.9 10.2 10.1 10.0 10.4 10.6 10.8 11.1 2.3 1.9
Korea Mid-term Energy Demand Outlook 2020 25 Energy Demand - HEG Scenario
증가율 (%)
2016 2017 2018 2019p 2020e 2021e 2022e 2023e 2024e 09-19 19-24
Total Primary Energy Supply
Coal (Mton) 129.3 139.8 141.0 133.0 123.1 123.9 126.0 128.0 129.8 2.1 - 0.5 Oil (Mbbl) 921.1 937.1 931.8 929.0 925.0 966.1 982.3 998.8 1 014.8 1.8 1.8
Gas (Bm3) 34.9 36.4 42.3 40.9 41.8 42.7 43.0 43.2 43.6 4.6 1.3
Hydro (TWh) 6.6 7.0 7.3 6.2 6.6 7.5 7.5 7.5 7.5 1.0 3.7
Nuclear (TWh) 162.0 148.4 133.5 145.9 163.7 179.5 187.7 194.9 202.1 - 0.1 6.7 Other Renewables (Mtoe) 13.6 15.8 17.1 17.9 17.8 19.0 20.5 22.1 23.9 12.6 5.9
Total (Mtoe) 293.8 302.1 307.5 303.5 300.7 311.8 318.6 325.1 331.7 2.2 1.8
Coal 81.5 86.2 86.7 82.1 76.0 75.9 77.0 78.1 79.0 1.8 - 0.8
Oil 117.6 119.4 118.5 117.6 116.0 121.4 123.3 125.3 127.3 1.4 1.6
Gas 45.5 47.5 55.2 53.5 54.6 55.8 56.2 56.4 56.9 4.7 1.3
Nuclear 1.4 1.5 1.5 1.3 1.4 1.6 1.6 1.6 1.6 0.9 3.7
Hydro 34.2 31.6 28.4 31.1 34.9 38.2 40.0 41.5 43.0 - 0.2 6.7
Other Renewables 13.6 15.8 17.1 17.9 17.8 19.0 20.5 22.1 23.9 12.6 5.9
Total Final Consumption
Coal (Mton) 49.0 50.4 49.2 48.2 47.7 48.5 48.9 48.8 49.0 3.4 0.3
Oil (Mbbl) 899.3 926.6 920.0 920.3 918.2 959.3 976.7 993.1 1 009.1 2.0 1.9
Gas (Bm3) 21.3 22.6 24.3 23.3 23.3 24.1 24.6 25.1 25.4 2.4 1.8
Electricity (TWh) 497.0 507.7 526.1 520.5 519.8 536.6 549.7 562.5 574.8 2.8 2.0
Heat (Mtoe) 2.2 2.4 2.7 2.6 2.6 2.7 2.7 2.8 2.9 4.1 2.9
Other Renewables (Mtoe) 7.2 8.6 9.1 9.3 9.6 10.0 10.3 10.7 11.1 6.7 3.5
Total (Mtoe) 221.4 230.0 232.7 231.2 229.5 237.7 242.2 246.1 250.0 2.5 1.6
Coal 32.3 33.4 32.4 32.0 31.4 31.3 31.4 31.3 31.2 3.3 - 0.5
Oil 114.3 117.9 116.8 116.4 115.1 120.5 122.7 124.7 126.7 1.7 1.7
Gas 22.7 24.1 26.4 26.1 26.2 27.1 27.7 28.3 28.7 3.0 1.9
Electricity 42.7 43.7 45.2 44.8 44.7 46.2 47.3 48.4 49.4 2.8 2.0
Heat 2.2 2.4 2.7 2.6 2.6 2.7 2.7 2.8 2.9 4.1 2.9
Other Renewables 7.2 8.6 9.1 9.3 9.6 10.0 10.3 10.7 11.1 6.7 3.5
Industry 135.2 141.9 142.9 142.7 143.5 147.4 150.1 152.5 154.8 3.1 1.6
Transport 42.3 42.8 43.0 42.6 40.4 43.3 44.3 45.0 45.9 1.7 1.5
Buildings 44.0 45.3 46.9 46.0 45.6 47.0 47.8 48.6 49.4 1.4 1.4
Energy Demand - HEG Scenario
(yoy, %)
GACR (%)
2016 2017 2018 2019p 2020e 2021e 2022e 2023e 2024e 09-19 19-24 Total Primary
Energy Supply
Coal (Mton) - 4.3 8.1 0.9 - 5.7 - 7.4 0.7 1.6 1.6 1.4 2.1 - 0.5
Oil (Mbbl) 8.0 1.7 - 0.6 - 0.3 - 0.4 4.4 1.7 1.7 1.6 1.8 1.8
Gas (Bm3) 4.4 4.3 16.2 - 3.2 2.2 2.1 0.8 0.4 0.9 4.6 1.3
Hydro (TWh) 14.5 5.5 3.9 - 14.3 6.4 12.6 0.0 0.0 0.3 1.0 3.7
Nuclear (TWh) - 1.7 - 8.4 - 10.1 9.3 12.2 9.7 4.6 3.9 3.7 - 0.1 6.7
Other Renewables
(Mtoe) 5.7 16.7 8.0 4.7 - 0.5 6.7 7.7 7.9 8.0 12.6 5.9
Total (Mtoe) 2.4 2.8 1.8 - 1.3 - 0.9 3.7 2.2 2.0 2.1 2.2 1.8
Coal - 4.6 5.7 0.6 - 5.3 - 7.5 - 0.1 1.5 1.4 1.1 1.8 - 0.8
Oil 7.8 1.5 - 0.7 - 0.8 - 1.4 4.6 1.6 1.6 1.6 1.4 1.6
Gas 4.4 4.4 16.2 - 3.2 2.2 2.1 0.8 0.4 0.9 4.7 1.3
Nuclear 14.5 6.5 3.9 - 14.3 6.4 12.6 0.0 0.0 0.3 0.9 3.7
Hydro - 1.7 - 7.5 - 10.1 9.3 12.2 9.7 4.6 3.9 3.7 - 0.2 6.7
Other Renewables 5.7 16.7 8.0 4.7 - 0.5 6.7 7.7 7.9 8.0 12.6 5.9
Total Final
Consumption
Coal (Mton) - 6.8 2.7 - 2.3 - 2.1 - 1.1 1.7 0.7 - 0.2 0.5 3.4 0.3
Oil (Mbbl) 7.3 3.0 - 0.7 0.0 - 0.2 4.5 1.8 1.7 1.6 2.0 1.9
Gas (Bm3) 2.3 6.3 7.4 - 4.1 0.1 3.5 2.3 1.9 1.3 2.4 1.8
Electricity (TWh) 2.8 2.2 3.6 - 1.1 - 0.1 3.3 2.4 2.3 2.2 2.8 2.0
Heat (Mtoe) 11.0 11.8 9.9 - 4.9 0.4 3.8 2.4 3.3 4.6 4.1 2.9
Other Renewables
(Mtoe) - 5.6 20.4 5.5 2.6 2.5 4.0 3.6 3.6 3.5 6.7 3.5
Total (Mtoe) 3.0 3.9 1.2 - 0.6 - 0.8 3.6 1.9 1.6 1.6 2.5 1.6
Coal - 7.2 3.1 - 2.8 - 1.4 - 1.9 - 0.3 0.5 - 0.6 - 0.1 3.3 - 0.5
Oil 6.9 3.1 - 0.9 - 0.3 - 1.1 4.7 1.8 1.6 1.6 1.7 1.7
Gas 2.6 6.0 9.9 - 1.1 0.0 3.6 2.4 2.0 1.4 3.0 1.9
Electricity 2.8 2.2 3.6 - 1.1 - 0.1 3.3 2.4 2.3 2.2 2.8 2.0
Heat 11.0 11.8 9.9 - 4.9 0.4 3.8 2.4 3.3 4.6 4.1 2.9
Other Renewables - 5.6 20.4 5.5 2.6 2.5 4.0 3.6 3.6 3.5 6.7 3.5
Industry 1.6 5.0 0.7 - 0.1 0.5 2.7 1.8 1.6 1.5 3.1 1.6
Transport 6.1 1.2 0.4 - 0.9 - 5.1 7.2 2.3 1.7 1.8 1.7 1.5
Buildings 4.4 3.1 3.5 - 2.0 - 0.8 3.0 1.8 1.7 1.6 1.4 1.4
Korea Mid-term Energy Demand Outlook 2020 27 Energy Demand by Sector - HEG Scenario
(Mtoe)
GACR (%)
2016 2017 2018 2019p 2020e 2021e 2022e 2023e 2024e 09-19 19-24 Industry 135.2 141.9 142.9 142.7 143.5 147.4 150.1 152.5 154.8 3.1 1.6
Coal 31.8 32.8 32.0 31.7 31.1 31.0 31.2 31.0 30.9 3.7 - 0.5
Oil 66.8 69.8 69.3 69.4 70.8 73.1 74.4 75.8 77.0 2.1 2.1
Gas 8.0 8.8 10.5 10.7 10.7 11.3 11.7 12.1 12.3 6.2 2.8
Electricity 23.2 23.8 24.4 24.1 23.8 24.7 25.3 25.9 26.5 3.5 2.0
Heat - - - -
Other Renewables 5.3 6.6 6.7 6.8 7.0 7.3 7.5 7.7 8.0 5.8 3.1
Transport 42.3 42.8 43.0 42.6 40.4 43.3 44.3 45.0 45.9 1.7 1.5
Coal - - - -
Oil 40.3 40.9 40.8 40.4 38.3 41.1 42.1 42.9 43.7 1.6 1.6
Gas 1.3 1.3 1.2 1.2 1.2 1.2 1.2 1.1 1.1 2.4 - 1.4
Electricity 0.2 0.2 0.3 0.3 0.3 0.3 0.3 0.3 0.3 3.0 6.1
Heat - - - -
Other Renewables 0.4 0.4 0.7 0.7 0.7 0.7 0.7 0.7 0.7 10.5 1.0
Buildings* 44.0 45.3 46.9 46.0 45.6 47.0 47.8 48.6 49.4 1.4 1.4
Coal 0.6 0.5 0.4 0.3 0.3 0.3 0.3 0.3 0.3 - 10.7 - 0.8
Oil 7.1 7.2 6.8 6.6 6.0 6.2 6.1 6.0 6.0 - 1.1 - 2.0
Gas 13.4 14.0 14.7 14.2 14.2 14.6 14.9 15.1 15.2 1.2 1.4
Electricity 19.3 19.6 20.6 20.5 20.6 21.2 21.7 22.1 22.6 2.0 2.0
Heat 2.2 2.4 2.7 2.6 2.6 2.7 2.7 2.8 2.9 4.1 2.9
Other Renewables 1.4 1.6 1.7 1.8 1.9 2.0 2.1 2.3 2.4 9.5 5.7
Transform 139.5 141.4 147.7 143.5 142.4 147.8 151.8 156.0 160.3 2.1 2.2
Coal 49.2 52.8 54.2 50.1 44.6 44.6 45.6 46.8 47.7 0.9 - 1.0
Oil 3.3 1.5 1.7 1.2 0.9 0.9 0.7 0.7 0.7 - 11.5 - 10.7
Gas 45.0 46.7 53.8 51.3 52.4 53.5 53.8 54.0 54.4 4.2 1.2
Nuclear 34.2 31.6 28.4 31.1 34.9 38.2 40.0 41.5 43.0 - 0.2 6.7
Hydro 1.4 1.5 1.5 1.3 1.4 1.6 1.6 1.6 1.6 0.9 3.7
Renewables 6.4 7.2 8.0 8.6 8.2 9.1 10.2 11.4 12.8 30.2 8.3
* include residential, commercial, public∙etc usage
Coal - HEG Scenario
(Mton)
GACR (%)
2016 2017 2018 2019p 2020e 2021e 2022e 2023e 2024e 09-19 19-24 Total Coal Demand 129.3 139.8 141.0 133.0 123.1 123.9 126.0 128.0 129.8 2.1 - 0.5
Transform 80.3 89.4 91.8 84.8 75.4 75.4 77.1 79.3 80.8 1.4 - 1.0
Power Generation 80.3 89.4 91.8 84.8 75.4 75.4 77.1 79.3 80.8 1.4 - 1.0
Heat - - - -
Gas Manufacture - - - -
Total Final
Consumption 49.0 50.4 49.2 48.2 47.7 48.5 48.9 48.8 49.0 3.4 0.3
Industry 47.8 49.3 48.3 47.6 47.2 48.1 48.5 48.5 48.7 3.8 0.5
Transport - - - -
Buildings 1.3 1.1 0.9 0.6 0.5 0.4 0.4 0.3 0.3 - 10.5 - 15.0
-
Consumption by
products
Anthracite 10.8 8.3 9.2 7.9 7.1 7.2 7.0 6.8 6.9 - 1.9 - 2.8
Bituminous 118.5 131.5 131.8 125.1 116.0 116.7 119.0 121.2 122.9 2.4 - 0.4
Iron making 33.5 36.3 34.6 35.0 35.2 36.0 36.6 36.8 37.1 5.4 1.2
Cement 4.6 4.2 3.7 4.0 3.9 3.8 3.7 3.6 3.4 - 1.1 - 2.9
Power
Generation 77.8 88.3 90.8 83.6 74.5 74.5 76.3 78.4 80.0 1.6 - 0.9
Korea Mid-term Energy Demand Outlook 2020 29 Oil - HEG Scenario
(Mbbl)
GACR (%)
2016 2017 2018 2019p 2020e 2021e 2022e 2023e 2024e 09-19 19-24 Total Oil Demand 921.1 937.1 931.8 929.0 925.0 966.1 982.3 998.8 1 014.8 1.8 1.8
Transform 21.8 10.5 11.7 8.7 6.8 6.8 5.6 5.7 5.7 - 10.5 - 8.2
Power Generation 19.3 8.1 8.6 5.4 2.3 2.2 0.8 0.7 0.6 - 13.1 - 36.3
Heat 1.3 1.2 1.1 2.1 3.4 3.4 3.5 3.6 3.8 - 0.5 12.1
Gas Manufacture 1.2 1.2 2.0 1.2 1.2 1.2 1.2 1.3 1.3 - 7.1 2.1
Total Final
Consumption 899.3 926.6 920.0 920.3 918.2 959.3 976.7 993.1 1 009.1 2.0 1.9
Industry 542.6 567.0 564.1 567.2 583.3 601.6 612.3 623.9 634.4 2.7 2.3
Transport 300.5 303.2 302.3 300.3 284.5 305.6 312.8 318.1 323.9 1.5 1.5
Buildings 56.3 56.4 53.7 52.8 50.4 52.1 51.6 51.1 50.8 - 1.0 - 0.8
Consumption by
products
Gasoline 78.9 79.6 79.7 82.8 79.5 84.6 86.1 87.0 87.8 2.3 1.2
Diesel (including
Transformation) 163.5 165.9 164.1 167.0 156.4 167.4 169.8 172.2 175.0 2.4 0.9 Kerosene (including
Transformation) 19.1 19.0 18.9 17.1 15.4 16.2 15.6 15.2 15.0 - 4.1 - 2.6
B-C (including
Transformation) 47.5 35.8 33.7 24.4 22.8 23.7 22.8 21.8 21.2 - 9.9 - 2.7
Jet Oil 37.0 38.2 39.9 38.8 34.2 40.5 42.8 44.9 47.4 4.0 4.1
LPG (including
Transformation) 109.0 105.1 109.4 122.1 140.1 143.7 146.0 148.7 150.7 1.4 4.3
Naphtha 430.1 458.4 451.2 438.6 439.1 451.4 460.0 469.1 477.3 3.1 1.7
Other Non-Energy 36.1 35.1 35.1 38.0 37.5 38.5 39.2 39.8 40.3 2.5 1.2
Gas - HEG Scenario
GACR (%)
2016 2017 2018 2019p 2020e 2021e 2022e 2023e 2024e 09-19 19-24 Total Gas Demand
(Mton) 34.9 36.4 42.3 40.9 41.8 42.7 43.0 43.2 43.6 4.6 1.3
Transform 34.5 35.8 41.2 39.3 40.2 40.9 41.2 41.3 41.7 4.2 1.2
Power Generation 15.5 15.6 18.9 18.4 19.4 19.7 19.6 19.0 18.6 6.6 0.2
Heat 1.6 1.7 2.3 1.9 1.9 2.0 2.0 2.1 2.2 13.8 2.7
Gas Manufacture 17.5 18.5 20.0 18.9 18.9 19.3 19.6 20.2 20.9 1.8 2.0
Industry 0.4 0.6 1.1 1.7 1.7 1.8 1.8 1.9 1.9 - 2.7
City Gas (Bm3) 21.3 22.6 24.3 23.3 23.3 24.1 24.6 25.1 25.4 2.4 1.8
Industry* 7.2 7.8 8.8 8.3 8.3 8.8 9.1 9.3 9.6 4.0 2.9
Transport 1.2 1.2 1.2 1.2 1.2 1.1 1.1 1.1 1.1 2.6 - 1.4
Buildings 12.8 13.6 14.3 13.8 13.8 14.2 14.5 14.7 14.8 1.4 1.4
* exclude industrial LNG usage
Korea Mid-term Energy Demand Outlook 2020 31 Electricity - HEG Scenario
(TWh)
GACR (%)
2016 2017 2018 2019p 2020e 2021e 2022e 2023e 2024e 09-
19 19-
24 Net Electricity Demand 540.4 553.5 570.6 563.0 566.5 587.3 602.0 616.1 629.5 2.6 2.3
Own use and Losses 43.4 45.8 44.5 42.5 46.7 50.7 52.3 53.6 54.8 0.8 5.2
Total Final Consumption 497.0 507.7 526.1 520.5 519.8 536.6 549.7 562.5 574.8 2.8 2.0
Industry 270.0 276.7 283.7 279.8 277.3 287.2 294.5 301.6 308.5 3.5 2.0
Transport 2.7 2.8 3.0 2.9 3.0 3.2 3.4 3.6 3.9 3.0 6.0
Buildings 224.4 228.3 239.5 237.8 239.4 246.2 251.8 257.2 262.4 2.0 2.0
Installed Electrical Capacity (GW)* 104.1 116.4 118.5 123.7 127.7 132.9 135.6 141.2 145.6 5.3 3.3
Coal 31.4 36.8 37.0 37.0 37.2 38.6 38.7 40.8 40.7 4.3 1.9
Oil 4.1 4.1 4.3 3.9 2.1 2.1 0.9 0.9 0.4 - 3.4 -
35.4
Gas 32.6 37.5 37.9 39.4 41.3 41.3 42.3 41.7 42.3 8.2 1.4
Nuclear 22.2 22.5 21.9 23.3 24.7 26.1 26.1 26.8 27.3 2.8 3.2
Hydro 6.5 6.5 6.5 6.5 6.5 6.5 6.5 6.5 6.5 1.7 0.0
Other Renewables 7.3 8.9 11.0 13.6 15.9 18.3 21.2 24.5 28.4 17.4 15.8
Electricity Generation of Power Plants* 540.4 553.5 570.6 560.2 564.6 587.3 602.0 616.1 629.5 2.7 2.4
Coal 213.8 238.8 238.4 227.4 207.5 207.5 212.1 218.1 222.3 1.6 - 0.5
Oil 14.0 5.3 5.7 4.2 1.8 1.8 0.7 0.6 0.5 - 11.5 -
35.6
Gas 121.0 126.0 153.5 143.7 153.6 156.7