JHEP12(2020)082
Published for SISSA by Springer
Received:May 11, 2020 Accepted: November 3, 2020 Published: December 11, 2020
Dependence of inclusive jet production on the anti-k
Tdistance parameter in pp collisions at √
s = 13 TeV
The CMS collaboration
E-mail: [email protected]
Abstract: The dependence of inclusive jet production in proton-proton collisions with a center-of-mass energy of 13 TeV on the distance parameter R of the anti-kT algorithm is studied using data corresponding to integrated luminosities up to 35.9 fb−1 collected by the CMS experiment in 2016. The ratios of the inclusive cross sections as functions of transverse momentum pT and rapidity y, for R in the range 0.1 to 1.2 to those using R = 0.4 are presented in the region 84 < pT < 1588 GeV and |y| < 2.0. The results are compared to calculations at leading and next-to-leading order in the strong coupling constant using different parton shower models. The variation of the ratio of cross sections with R is well described by calculations including a parton shower model, but not by a leading-order quantum chromodynamics calculation including nonperturbative effects. The agreement between the data and the theoretical predictions for the ratios of cross sections is significantly improved when next-to-leading order calculations with nonperturbative effects are used.
Keywords: Hadron-Hadron scattering (experiments), Jets, QCD ArXiv ePrint: 2005.05159
JHEP12(2020)082
Contents
1 Introduction 1
2 The CMS detector 3
3 Jet reconstruction 4
4 Event samples 6
4.1 Collision data 6
4.2 Simulated samples 6
5 Measurement of cross sections and cross section ratios 8
5.1 Unfolding 8
5.2 Nonperturbative corrections for fixed-order calculations 9 6 Experimental uncertainties in the measurement 10
7 Theoretical uncertainties 13
8 Results 14
8.1 Comparison of ratio of cross sections 14
8.2 Variation of the ratio of cross sections with jet size 16
9 Summary 16
The CMS collaboration 23
1 Introduction
Quantum chromodynamics (QCD) is a gauge theory describing the strong interaction be- tween partons (quarks and gluons). Jets are reconstructed using hadron particles produced by the fragmentation of partons in collisions [1]. Thus jets approximate the original par- tons created in short-distance scatterings. The production cross sections for high transverse momentum (pT) partons can be calculated using perturbative QCD (pQCD). Specifically, predictions for hadron production in proton-proton collisions require models for parton showering [2–4] and nonperturbative (NP) effects such as hadronization [5] and underlying event (UE) [6]. When the fixed-order prediction in pQCD is not adequate, higher-order terms must be included using resummation methods [7–9].
The results of measurements of inclusive jet production cross sections for proton-proton collisions are typically presented using the anti-kT jet algorithm [10] characterized by a dis- tance parameter R, which is a measure of the jet size in rapidity-azimuth plane. Anti-kT
JHEP12(2020)082
jets with distance parameterRare referred to as AKnjets, whereR= 0.1n. The CMS col- laboration [11] has reported measurements at center-of-mass energy (√
s) of 7 TeV [12] and 8 TeV [13] using AK5 and AK7 jets. The CMS results at √
s= 13 TeV for AK4 and AK7 jets are reported in ref. [14]. After the application of a correction for NP and electroweak effects, the results for AK7 jets are well described by next-to-leading order (NLO) calcu- lations based on thenlojet++ [15] program used in thefastnlo software package [16].
The prediction from thepowheg [17] generator, which also computes matrix elements at NLO and is used with parton showering simulated with pythia8 [18] orherwig++ [19], describes results well for both AK7 and AK4 jets. However, the ATLAS collaboration has measured the production cross sections for both AK4 and AK6 jets and finds a discrepancy between the measured results and the powheg prediction [20]. The ATLAS collaboration has also compared the measurements of inclusive jet production at √
s= 13 TeV with the next-to-next-to-leading order (NNLO) prediction in pQCD [21].
The measurement of a jet production cross section as a function of the distance pa- rameter is sensitive to the details of the theoretical modeling of the perturbative and NP processes involved in the evolution of the partons. The measurement of the ratio of cross sections with two jet sizes was first performed by the ALICE collaboration with AK2 and AK4 jets [22]. A similar study was also produced by the CMS collaboration with AK5 and AK7 jets [23]. We explore this topic further in the present paper by extending the mea- surement to various values of jet size. Recently, ALICE collaboration has also measured both the absolute cross sections of inclusive jet production and the ratio of cross sections forR= 0.1–0.6 in 20< pT<140 GeV [24]. Dependence of inclusive jet production on the distance parameter is also studied in detail in ref. [25].
Quarks and gluons radiate secondary gluons that can be emitted outside of the catch- ment area of the jet definition, which is the region in rapidity-azimuth plane contributing to the jet. This lostpT is calculated using a QCD splitting function, with the leading-order (LO) result [26–28] in the small-R approximation (R1)
(δpT)q=−CFαSpT π ln
1 R
2 ln 2−3 8
+O(αS), (1.1)
for quark-initiated jets and (δpT)g =−αSpT
π ln 1
R CA(2 ln 2−43
96) +TRnf 7 48
+O(αS), (1.2) for gluon-initiated jets.
HereCF= 43andCA(= 3) are the Casimir factors for quarks and gluons respectively, TR= 12 is the SU(3) quantum number, and nf is the number of active quark flavors.
Larger values of R capture a larger fraction of the radiation.
Properties of jets are also modified by hadronization, an NP process describing the transition of partons into hadrons. As described in ref. [29], some theoretical models parameterize the effect of hadronization by taking αS(µ) =µlδ(µ−µl), where µl is com- mensurate with the Landau pole, yielding
(δpT)had ' −2CA(µl)
πR +O(R), (1.3)
JHEP12(2020)082
in the small-Rlimit, whereC=CF(CA) for quark (gluon) initiated jets, andA(µl) is related to the scale appearing in the calculations of hadronization. Losses are again minimized at larger values of R.
The algorithm defining the jets can also select particles from the underlying event, which in general involves low momentum transfer. These particles typically have low pT. The energy density (ΛUE per unity) from these sources is approximately uniform over the jet area, and their contribution to the jet pT is approximately given [28,30] by
(δpT)UE ' 1
2ΛUER2, (1.4)
for small R values.
Since, as discussed above, the contributions of various perturbative and NP effects de- pend on the jet size, and because radiation and hadronization are different for jets initiated by quarks and by gluons, comparisons of jets with different cone sizes yield information about these processes, and can be used to improve theoretical calculations.
In this paper, we present measurements of the ratio of the cross section for inclusive anti-kT jets with distance parameters of R= 0.1,0.2, . . . ,1.2 to that of AK4 jets. The re- sults are compared with predictions from different Monte Carlo (MC) generators, involving matrix element calculations at different orders and utilizing different parton shower and hadronization models. Predictions for cross section ratios have also been obtained using a pQCD calculation at NLO that uses the following convention
Ratio(R, pT) =
dσ(R)
dpT −dσdp(0.4)
T
dσ(0.4) dpT
+ 1, (1.5)
where R is the anti-kT jet distance parameter, and R = 0.4 is taken as the reference jet size. The terms in eq. (1.5) are differential cross sections for three-jet production and are calculated at fixed-order usingnlojet++with terms up toα4S[31,32]. Measurements are restricted topT<1588 GeV because of the large experimental uncertainty in the calibration of high energy jets, which was not optimized for the cross section ratios.
2 The CMS detector
The central feature of the CMS apparatus is a superconducting solenoid of 6 m internal diameter, providing a magnetic field of 3.8 T. Within the solenoid volume are a silicon pixel and strip tracker, a lead tungstate crystal electromagnetic calorimeter (ECAL), and a brass and scintillator hadron calorimeter (HCAL), each composed of a barrel and two endcap sections. Forward calorimeters extend the pseudorapidity (η) coverage provided by the barrel and endcap detectors. Muons are detected in gas-ionization chambers embedded in the steel flux-return yoke outside the solenoid. A more detailed description of the CMS detector, together with a definition of the coordinate system used and the relevant kinematic variables, can be found in ref. [11].
The silicon tracker measures charged particles within the range |η|< 2.5. It consists of 1440 silicon pixel and 15 148 silicon strip detector modules. For nonisolated particles
JHEP12(2020)082
of 1 < pT < 10 GeV and |η| < 1.4, the track resolutions are typically 1.5% in pT and 25–90 (45–150)µm in the transverse (longitudinal) impact parameter [33]. In the barrel section of the ECAL, an energy resolution of about 1% is achieved for unconverted or late- converting photons that have energies in the range of tens of GeV. The remaining barrel photons have a resolution of about 1.3% up to|η|= 1, rising to about 2.5% at|η|= 1.4. In the endcaps, the resolution of unconverted or late-converting photons is about 2.5%, while the remaining endcap photons have a resolution between 3 and 4% [34]. In the region
|η| < 1.74, the HCAL cells have widths of 0.087 in η and 0.087 radians in azimuth (φ).
In the η–φ plane, and for |η| < 1.48, the HCAL cells map on to 5×5 arrays of ECAL crystals to form calorimeter towers projecting radially outwards from close to the nominal interaction point. For |η| > 1.74, the coverage of the towers increases progressively to a maximum of 0.174 in ∆η and ∆φ[35]. Within each tower, the energy deposits in ECAL and HCAL cells are summed to define the calorimeter tower energies, subsequently used to provide the energies and directions of hadronic jets. When combining information from the entire detector, the jet energy resolution amounts typically to 15% at 30 GeV, 10% at 100 GeV, and 5% at 1 TeV at|η|<0.5, while at|η|= 2.0 the jet energy resolution increases by 1–2% at low pT [36].
Events of interest are selected using a two-tiered trigger system [37]. The first level, composed of custom hardware processors, uses information from the calorimeters and muon detectors to select events at a rate of around 100 kHz. The second level, known as the high-level trigger (HLT), consists of a farm of processors running a version of the full event reconstruction software optimized for fast processing that reduces the event rate to around 1 kHz before data storage.
3 Jet reconstruction
The CMS particle-flow algorithm [38] reconstructs and identifies each individual particle in an event with an optimized combination of information from the various elements of the CMS detector. The energy of photons is obtained from the ECAL measurement. The energy of electrons is determined from a combination of the electron momentum at the primary interaction vertex as determined by the tracker, the energy of the corresponding ECAL cluster, and the energy sum of all bremsstrahlung photons spatially compatible with originating from the electron track. The energy of muons is obtained from the curvature of the corresponding track as determined using the tracker and the muon system. The energy of charged hadrons is determined from a combination of their momentum measured in the tracker and the matching ECAL and HCAL energy deposits, corrected for zero-suppression effects and for the response function of the calorimeters to hadronic showers. Finally, the energy of neutral hadrons is obtained from the corresponding corrected ECAL and HCAL energy deposits.
For each event, hadronic jets are clustered from these reconstructed particles (particle- flow candidates) using the infrared- and collinear-safe anti-kT algorithm [10], as imple- mented in the FastJet package [39]. The jet momentum is determined as the vectorial sum of all particle momenta in the jet, and is found from simulation to be, on average,
JHEP12(2020)082
within 5 to 10% of the momentum of the particle-level jets reconstructed using stable par- ticles (lifetime >30 ps) excluding neutrinos, for jet pT > 50 GeV and rapidity |y| < 2.5.
Additional proton-proton interactions within the same or nearby bunch crossings (pileup) can contribute additional tracks and calorimetric energy depositions, increasing the ap- parent jet momentum. To mitigate this effect, tracks identified as originating from pileup vertices are discarded and an offset correction [40] is applied to correct for remaining contri- butions [41]. Additional selection criteria are applied to each jet to remove jets potentially dominated by instrumental effects or reconstruction failures [42]. These criteria consist of the following conditions: the energy fraction of the jet carried by neutral hadrons and photons should be less than 90%, the jet should have at least two constituents, and at least one of those should be a charged hadron. This set of criteria is more than 99% efficient for genuine jets.
The missing transverse momentum vector (~pTmiss) is defined as the negative vector sum of the pT of all reconstructed particle-flow objects in an event; its magnitude is de- noted using pmissT . A set of algorithms is used to reject events with anomalous high-pmissT arising from a variety of reconstruction failures, detector malfunctions, or noncollision backgrounds; these algorithms are designed to identify more than 85–90% of the spurious high-pmissT events with a misidentification rate of less than 0.1% [43].
Jet energy corrections are derived using simulated pythia inclusive jet samples dis- cussed in section4.2so that the average measured transverse momentum of jets is the same as the corresponding particle-level jets. This methodology is used to derive nominal jet energy correction factors only for AK4 and AK8 jets. The nominal corrections for AK4 jets are used for AK1 to AK6 jets. For larger jet sizes (R >0.6) the nominal correction factors derived for AK8 jets are applied. To account for the differences in the distance parameter, an extra correction factor (CR) is determined in case of each distance parameter for the average pileup condition based purely on simulation and applied to the corresponding jets.
A detailed discussion on the derivation ofCR is made later in this section. Measurements of the momentum balance in dijet, photon+jet, Z+jet, and multijet events are used to determine any residual differences between the jet energy scale in data and simulation, and appropriate corrections are made [41]. The in situ techniques are based on the missing transverse momentum projection fraction method, which is fundamentally insensitive to jet size, and on particle-flow reconstruction, whose reliance on tracking and particle-flow hadron calibration further reduces differences in energy response between jets of different radii. Residual corrections are derived using only AK4 jets and applied to jets of all the sizes.
The factor CR is derived in the following way. In simulated pythia inclusive jet samples, the detector- and particle-level jets are required to be geometrically matched satisfying ∆R <(0.5×jet size); the ratio of the average detector-level jetpTto the particle- level jetpTis calculated as a function of the particle-level jetpTfor all the jet sizes and then used as an extra correction factor CR for both data and simulation. The CR factors are also derived using simulated herwig++ inclusive jet samples, so the jet energy response is calibrated to unity for all the jet sizes in herwig++ samples as well. The difference in CRfactors derived using pythiaand herwig++inclusive jet samples is used to estimate
JHEP12(2020)082
the systematic uncertainties in CR separately for each of the distance parameters. The CRfactors are important to ensure that the jet energy resolution in simulation is properly corrected to match the data without changing the jet energy scale, and that pythia and herwig++ are on equal footing with respect to jet energy scale and resolution when unfolding the data in section 5.1. The value of the CR factor ranges from 0.95 to 1.10 depending on the energy, rapidity, and size of the reconstructed jets; this correction is significant only for very small and very large jet sizes. However, CR corrects the jet energy response for different jet sizes at the level of simulation only and no dedicated residual correction is derived for data as a function of jet size. Nevertheless, it has been checked that the difference in averagepT between AK8 and AK4 jets pointing in the same direction in data is smaller than the difference of the same betweenpythiaandherwig++
simulations.
4 Event samples
4.1 Collision data
Proton-proton collision data collected by the CMS experiment during 2016, corresponding to an integrated luminosity of 35.9 fb−1, are used for this analysis. The data sample is collected using single-jet triggers, which select events containing at least one AK8 jet, formed from particle-flow candidates, with pT exceeding one of the threshold values listed in table 1. Absolute trigger efficiency is measured with a tag-and-probe procedure [44]
using the events having a back-to-back dijet topology, where the tag jet is matched to a single-jet trigger, and the efficiency is measured using the probe jet.
Because of limited bandwidth and storage space, only a fraction of the events satisfying the triggering condition with lower thresholds are recorded. For this reason, in each jet-pT bin, only the trigger that has the highest effective integrated luminosity and is also more than 99% efficient is used.
Offline, events are required to contain at least one jet with pT above that value for which the trigger is 99% efficient. These values are also used to define the pT bins for the measurement.
Similarly to other CMS publications [12, 13], we require that pmissT /PipTi < 0.3, where the indexiruns over all particle-flow candidates in the event andPipTi denotes the scalar sum of transverse momenta; this rejects calorimeter noise and a part of electroweak backgrounds from the production of W(→ lepton) + jets, Z(→ lepton) + jets, and top quarks when the top quarks decay to final states with leptons.
4.2 Simulated samples
The data are compared to predictions from several different MC generators, listed below.
The pythiav8.212 [18] generator computes matrix elements only for 2→2 Feynman diagrams at LO; the missing orders in the perturbation series are approximated using pT- ordered dipole showering. Thepythiagenerator employs the empirical Lund string model to hadronize the partons. The NNPDF2.3 [45] LO parton distribution function (PDF) set
JHEP12(2020)082
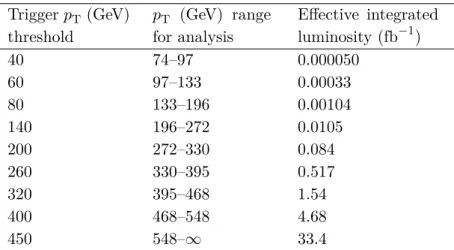
TriggerpT (GeV) threshold
pT (GeV) range for analysis
Effective integrated luminosity (fb−1)
40 74–97 0.000050
60 97–133 0.00033
80 133–196 0.00104
140 196–272 0.0105
200 272–330 0.084
260 330–395 0.517
320 395–468 1.54
400 468–548 4.68
450 548–∞ 33.4
Table 1. Trigger pT thresholds and effective integrated luminosity of the HLT triggers based on AK8 jets. These triggers were not active during the initial part of data taking in 2016, thus the maximum integrated luminosity is less than 35.9 fb−1.
is used to describe the momentum fractions carried by the partons within the incoming protons; our UE model is the CUETP8M1 tune [46] (CMS Underlying Event Tune for pythia8 based on Monash [47]), which was derived by tuning the model parameters using minimum bias data collected by the CMS collaboration.
The herwig++v2.7.1 [19] generator also calculates only 2→2 scatterings, but has a different fragmentation and hadronization model thanpythia. It employs angular-ordered showers to radiate the partons and a cluster model to produce the hadrons. The NNPDF3.0 LO PDF set is used, and the UE modeling is described by the CUETHppS1 tune [46].
The MadGraph (MadGraph5_amc@nloV5 2.2.2) [48] generator provides calcu- lations of matrix elements with up to four outgoing partons in the final state at LO. The partons are showered and hadronized with pythiacombined withMadGraph, using the MLM merging scheme [49]. The NNPDF3.0 NLO PDF set and the CUETP8M1 UE tune are used here as well.
Thepowhegv2 [17,50] generator computes the dijet production cross section at NLO in pQCD. Successive parton showering, hadronization, and UE modeling is performed either using pythia with the CUETP8M1 tune (referred to as PH+P8 in the figures) or herwig++with the CUETHppS1 and EE5C [51] tunes (referred to as PH+Herwig in the figures). The NNPDF3.0 NLO PDF set is used for powheg as well, and the value of the hdamp parameter inpowheg is 250 GeV.
The herwig 7.1.1 [52] generator, used with the NNPDF3.1 NNLO PDF set with αS (mZ) = 0.118, also evaluates the matrix elements for dijet production at NLO, and is matched to theherwig7parton shower using the FxFx [53] jet merging method. The CH2 tune is used to model UE. This prediction is referred to as herwig7.
Fixed-order predictions for dijet production at NLO are computed using nlojet++
within the framework of thefastnlopackage. To account for the effects of hadronization, an additional correction factor is used, which will be discussed in section 5.2. This predic- tion is referred to as NLO⊗NP in the figures. Predictions from nlojet++ are obtained using the CT14NLO PDF set.
JHEP12(2020)082
Recently, a prediction for single-inclusive jet production using joint resummation in the threshold energy in the small-R limit has been computed at next-to-leading logarithmic (NLL) accuracy in the framework of Soft Collinear Effective Theory in refs. [9, 54]; the CT14NLO PDF set is also used for this prediction, which is referred to as (NLO+NLL).
This prediction is compared with the measurements reported in this paper.
5 Measurement of cross sections and cross section ratios
The inclusive jet cross section is calculated as d2σ
dpTdy = 1 Lint
Njets
∆pT∆y, (5.1)
where Njets is the number of jets in a pT and y bin, Lint is the integrated luminosity of the data set, is the product of trigger and event selection efficiencies, and ∆pT and ∆y are the bin widths in pT and y. The widths of pT bins are proportional to the jet energy resolution and increase with jet pT. The ratios of cross sections for the different jet sizes with respect to AK4 jets is calculated as the bin-by-bin quotient of the cross sections of AKn (n= 1,2, . . . ,12) and AK4 jets respectively; in the ratios, all the terms in eq. (5.1) exceptNjets and cancel.
5.1 Unfolding
To correct for detector inefficiencies and resolution, a number of methods available in the RooUnfold package [55] are used to unfold the jet pT spectra.
The nominal choice of unfolding technique in this paper is the D’Agostini unfolding [56]
with early stopping. Up to 5–8 iterations are used depending on jet size and rapidity region.
An alternative method is singular value decomposition (SVD) [57]. A third method is called bin-by-bin [58], which multiplies the particle-level spectra by the ratio between the detector-level spectra in data and simulation.
The SVD and bin-by-bin techniques are used to cross-check the result of unfolding with the D’Agostini unfolding. As an additional cross-check, unfolding is also performed using aχ2 minimization without regularization using the TUnfoldpackage [59].
Response matrices between pT spectra of detector-level and generator-level jets are obtained by one-to-one matching of the nearest detector- and particle-level jets, excluding matches with ∆R > (0.5×jet size), where ∆R denotes the distance between detector- and particle-level jets in the rapidity-azimuth plane. This criterion leads to almost 100%
matching efficiency between the detector-level and the particle-level jets. Response ma- trices are constructed, for all rapidity and jet sizes, from the CMS detector simulation based onGeant4 [60] using simulated samples from three MC event generators, pythia, herwig++, and MadGraph. For the particle-level results, response matrices based on the pythia simulation are used for the unfolding. The response matrix for AK4 jets in the first rapidity region for the pythiasample is shown in figure 1. The response matrix is diagonal, which shows that unfolding works well.
JHEP12(2020)082
(GeV) Detector-level jet pT
200 400 600 800 1000 1200 1400 (GeV)TParticle-level jet p
200 400 600 800 1000 1200 1400
Probability (detector | particle level)
0 0.1 0.2 0.3 0.4 0.5
Anti-kT
R = 0.4
|y| < 0.5 Pythia
CMS Simulation
(GeV) Jet pT
200 400 600 800 1000 1200 1400 (GeV)TJet p
200 400 600 800 1000 1200 1400
Correlation coefficient
−0.4
−0.2 0 0.2 0.4 0.6 0.8 1
Anti-kT
R = 0.4
|y| < 0.5
Unfolded by Pythia
CMS < 35.9 fb-1 (13 TeV)
Figure 1. Response matrix constructed from a simulation of a sample generated using pythia, for AK4 jets in the |y|<0.5 bin (left). A correlation matrix generated after data is unfolded by the D’Agostini unfolding usingpythiasimulation for AK4 jets (right).
For both the D’Agostini and SVD unfolding techniques, the nearest neighbor pT bins are correlated, and the next-to-nearest bins are anti-correlated (right plot in figure 1 for AK4 jets with the D’Agostini unfolding). Next-to-next-to-nearest bins are again correlated.
Several cross-checks are made regarding the unfolding. To investigate possible bias due to the choice of MC generator used to construct the response matrices, event samples are generated using three different generators: pythia,herwig++, andMadGraph, fol- lowed by the detector simulation whose output is scaled and smeared independently for each generator to match the energy scale and resolution of jets in data. Detector-level distributions from each of the samples are unfolded using these three response matrices, and the unfolded distributions are compared to the corresponding particle-level distribu- tions. No evidence for significant bias is observed. Similarly, the data are unfolded using response matrices from these three simulated samples; the differences among the unfolded spectra are within systematic uncertainties corresponding to the correction factorCR. The same conclusion holds when comparing the unfolded distributions obtained using different unfolding techniques, such as D’Agostini, SVD, bin-by-bin, and χ2 minimization.
5.2 Nonperturbative corrections for fixed-order calculations
Fixed-order NLO calculations yield predictions for the partonic fields, but in experimen- tal measurements, jets are composed of hadrons. To evolve the parton-level prediction to the hadron level, NP corrections are calculated and applied. Although generators such as pythiaandherwigcome with MC-based phenomenological simulation of these processes, nlojet++does not. The impact of NP on thenlojet++ prediction is approximated as a multiplicative correction factor as follows. The NP correction is the ratio of an observ- able from a generator, which includes NP effects with hadronization and multiple parton interaction (MPI) processes switched on, to the same observable obtained from the same generator without NP effects, i.e., by switching off hadronization and MPI processes.
Simulated powheg+pythia (CUETP8M1 tune) and powheg+herwig++ (EE5C and CUETHppS1 tunes) samples are used to compute NP factors for all the jet sizes in all thepT and rapidity bins. The average NP correction obtained from the powheg+pythia
JHEP12(2020)082
(GeV) Jet pT
100 1000
NP correction for cross section ratio 0.8 0.9 1 1.1 1.2 1.3 1.4
1.5 (13 TeV)
CMS Simulation PH+P8(CUETP8M1) PH+Herwig(EE5C) PH+Herwig(CUETHppS1) Final correction
Anti-kT
R = 0.2
|y| < 0.5
(GeV) Jet pT
100 1000
NP correction for cross section ratio 0.8 0.9 1 1.1 1.2 1.3 1.4
1.5 (13 TeV)
CMS Simulation PH+P8(CUETP8M1) PH+Herwig(EE5C) PH+Herwig(CUETHppS1) Final correction
Anti-kT
R = 0.8
|y| < 0.5
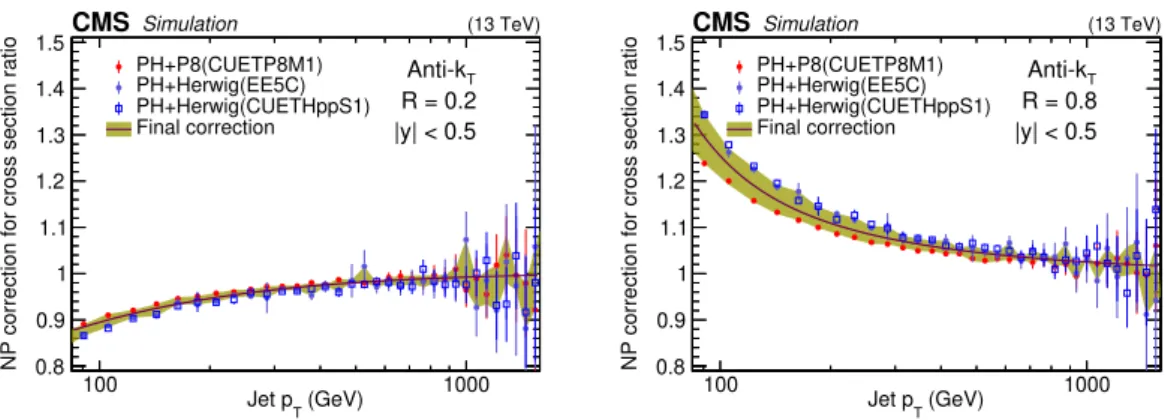
Figure 2. Nonperturbative correction factor for the cross section ratio of inclusive AK2 (left) and AK8 jets (right) with respect to the AK4 jets in the rapidity bin |y| < 0.5. Vertical error bars represent the statistical uncertainty of the NP correction for different predictions.
and powheg+herwig++ (EE5C) samples is defined as the final NP correction, and the envelope of the differences is taken as its uncertainty.
Figure2depicts the NP corrections for the cross section ratio of the AK2 and AK8 jets with respect to the AK4 jets. Hadronization corrections are larger for smaller jet sizes, and MPI introduces a larger correction for large-R jets. Because both hadronization and MPI are important for low-pT jets, the NP correction is also significant in the low-pTportion of phase space; in the high-pT region, the NP correction factor approaches 1. For AK4 jets, the corrections for hadronization and MPI almost cancel, and the resulting NP correction is close to unity throughout the pT range. At around pT = 85 GeV, the correction goes down to 0.8 for AK2 jets, and it goes up to 1.25 for AK8 jets.
6 Experimental uncertainties in the measurement
Multiple sources of uncertainty affect the precision of the measurement: statistical, jet en- ergy scale (JES) uncertainties, jet energy resolution (JER) uncertainties, and uncertainties in the pileup condition. We also include systematic uncertainties corresponding to the use of JES corrections derived for oneRalong with theR-dependentCR factor on jets formed using another R.
To estimate the statistical uncertainty in data, thejackknife resampling [61] method is used. In this technique, ten different data samples, each containing 90% events of the full data sample, are constructed such that the removed 10% of the events are complementary for each subsample. These subsamples are chosen in such a way that they correspond to very similar phase space regions. The statistical uncertainty is the standard deviation of the ten distributions multiplied by√
9 = 3. The resulting statistical uncertainty is roughly
<1% for jet pT < 1 TeV, and increases at high jet pT. A similar procedure is followed to estimate the statistical uncertainty due to the response matrices used for unfolding.
Here also, ten subsets of the simulated sample are considered, each with a nonoverlapping 10% of events removed. The distributions in data are unfolded using each subsample, and the standard deviation of ten unfolded distributions, multiplied by a factor of 3, is the
JHEP12(2020)082
statistical uncertainty due to the response matrices; in this case the statistical uncertainty is roughly 0.5–1.0% for the cross section ratio throughout the pT range.
The jet energy scale corrections have a number of uncertainties corresponding to the techniques used and the amount of pileup. The JES has an uncertainty of about 1–2%
in the central region [62]. The uncertainty is larger in the forward region and at low jet pT. To evaluate the uncertainty in the measurement of the cross section ratio, the JES is varied upwards and downwards by the uncertainties corresponding to different sources.
The difference in the unfolded cross section ratios using the nominal and varied JES is the uncertainty. Twenty-seven different sources of JES uncertainty are considered individually and added in quadrature. The uncertainty because of JES is very similar for all the jet sizes, except for the pileup component. The uncertainties mostly cancel out in the ratio, but there is a small residual, which is about 0.5–1.0% for |y| ≤2.0 up to 1 TeV of jet pT and goes up to 2% for very high jetpT.
To estimate the uncertainty in the ratio of cross sections with respect to that of AK4 jets because of using JES corrections derived for one value of Rwith jets from other values of R and then applying the CRfactor, the standard calibration factors from the AK8 jets are applied to AK1 to AK6 jets, and, for jets of other sizes, the calibration factors for the AK4 jets are used. The CR factors for jets of all sizes are derived for this scenario. The systematic uncertainties in the inclusive jet cross section ratios are evaluated using the difference between the results obtained by these two procedures. The uncertainty coming from the CR correction is more significant for larger jet sizes.
TheCRcalibration factors are derived using bothpythiaandherwig++simulations as a function of jet pT in different rapidity bins for all jet sizes. The difference in the resulting CR corrections is an ‘R-dependent’ uncertainty, and it is defined such that it vanishes for AK4 jets, which is used as the reference.
The JER and its associated uncertainty are obtained from a dijet balance tech- nique [62]. The JER in data is worse than in simulation. To match the JER in data and simulation, a spreading is added to the jets in simulation. Here also, as in the case for the JES, cross section ratios are obtained using upward and downward variations of the energy resolution factors for simulation while unfolding the data. The difference with respect to the nominal unfolding is used as an estimate of the uncertainty. The uncertainty due to JER is more important for large-R jets at low pT. The uncertainty also grows in regions of larger rapidities.
To match the pileup conditions in data and in MC simulation, pileup profile weighting is performed for the simulated samples. The weighting factors depend on the total inelastic cross section; we vary its nominal value of 67.5 mb [63] up and down by its uncertainty of 2.6% when reconstructing the response matrices, and take the difference in the unfolded data as the uncertainty. This source of systematic uncertainty is larger at low pT for large jet sizes, although its absolute value is small.
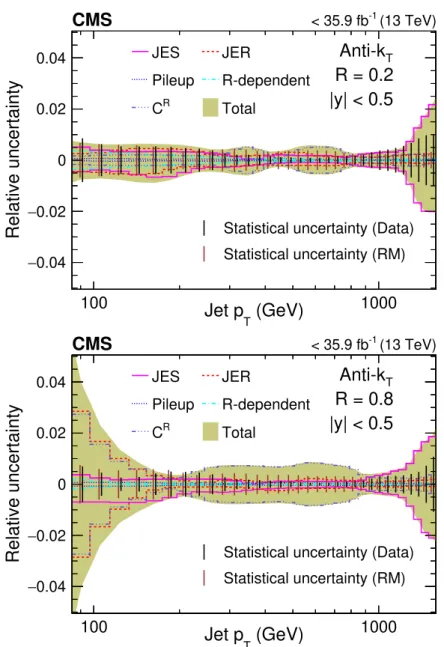
The uncertainties from different experimental sources are added in quadrature, and the total uncertainty is shown in figure 3 for the cross section ratios of the AK2 and AK8 jets with respect to the AK4 jets.
JHEP12(2020)082
(GeV) Jet pT
100 1000
Relative uncertainty
−0.04
−0.02 0 0.02 0.04
(13 TeV)
< 35.9 fb-1
CMS
Anti-kT
R = 0.2
|y| < 0.5
JES JER
Pileup R-dependent
CR Total
Statistical uncertainty (Data) Statistical uncertainty (RM)
(GeV) Jet pT
100 1000
Relative uncertainty
−0.04
−0.02 0 0.02 0.04
(13 TeV)
< 35.9 fb-1
CMS
Anti-kT
R = 0.8
|y| < 0.5
JES JER
Pileup R-dependent
CR Total
Statistical uncertainty (Data) Statistical uncertainty (RM)
Figure 3. Total uncertainty (relative) from experimental sources for the ratio of cross section of inclusive jets of size 0.2 (top) and 0.8 (bottom) with respect to that of AK4 jets in the rapidity bin
|y|<0.5. Statistical uncertainties are also overlaid as vertical black (red) bars for data (response matrices, RM, in simulation).
In the cross section ratio, many of the systematic uncertainties almost cancel, so the final uncertainty is small. The statistical component of the uncertainty is also shown in the same figure.
The experimental systematic uncertainty at low pT and large R is dominated by the pileup uncertainty. The JER uncertainty is also larger there because of additional spreading caused by pileup. At intermediatepT, the uncertainty is dominated by theCRuncertainty;
at high pT the JES dominates the experimental uncertainty because the cross sections fall very steeply and event counts are small at high jet pT. The sizes of the statistical
JHEP12(2020)082
uncertainties are similar to those of the total systematic uncertainties and are dominated by data at high pT and by the uncertainty in the response matrix because of the number of MC events at intermediatepT. At lowpT, the data have similar statistical uncertainties as the simulated sample, since the corresponding triggers are prescaled.
Another source of uncertainty, which is relevant only for jets with R > 0.8, is the uncertainty in the trigger efficiency correction. The AK8 single-jet triggers are not fully efficient for larger jet sizes near the trigger turn-on points for AK8 jets; an efficiency correction is applied for those jet sizes following eq. (5.1). The difference in the absolute value of the trigger efficiency from the curve used to model the variation of trigger efficiency as a function of jetpTis the uncertainty. The size of this uncertainty is 0.5–1.0% throughout thepT range.
7 Theoretical uncertainties
Apart from the systematic uncertainties due to experimental sources, theoretical calcula- tions and generators have uncertainties in their predictions for the cross section ratio. For the fixed-order predictions, the contributing factors include the choice of renormalization and factorization scales (scale), the PDF uncertainty (PDF), the uncertainty from αS, and the uncertainty due to the NP corrections (NP correction).
In the matrix element computation, the coupling (αS for QCD) is evaluated at an energy scale known as the renormalization scale (µR). Another scale is chosen to compute the PDF, in order to resum initial-state radiation below that scale, called the factorization scale (µF). For the fixed-order calculations, both are set equal to thepT of individual jets.
The scale uncertainty is evaluated using the following combinations of factors for (µR,µF):
(2, 1), (1, 2), (0.5, 1), (1, 0.5), (2, 2), (0.5, 0.5). The envelope of the variations is the scale uncertainty in the prediction. Scale variations in the numerator and the denominator of the ratio of cross sections are fully correlated since the underlying parton configuration is the same. This is one of the largest sources of theoretical uncertainties.
The PDFs are determined using data from several experiments. The PDFs there- fore have uncertainties from the experimental measurements, modeling, and parameteri- zation assumptions. The resulting uncertainty is calculated according to the prescription of CT14 [64] at the 90% confidence level and then scaled to the 68.3% confidence level.
The PDF uncertainty is independent of jet size within statistical uncertainties, and thus cancels in the ratios.
The cross section measurement for inclusive jets depends on the value of αS. In the nlojet++ prediction, its value (0.118) is varied by ±0.001. The uncertainty is taken as the difference between the results with varied and nominal values of αS and this difference is scaled to correspond to ∆αS ' 0.0015, as recommended in ref. [65]. For the jet cross section ratio, the uncertainty due to the αS variation in the numerator and denominator cancels.
As mentioned in section5.2, the envelope of the differences between the NP correction factors obtained using different parton showering algorithms to determine the NP correction is the uncertainty in the NP correction. The uncertainty is significant only at low pT.
JHEP12(2020)082
(GeV) Jet p
T100 1000
dy w.r.t. AK4 jets T / dpσ2 Ratio of d 0
2 4 6 8
(13 TeV)
< 35.9 fb-1
CMS
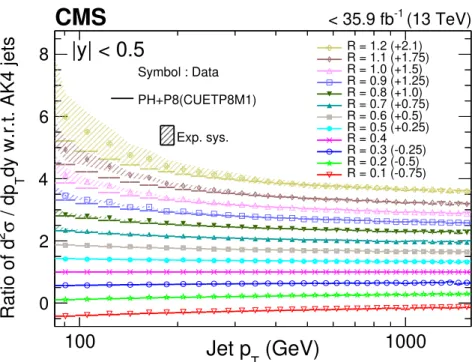
R = 1.2 (+2.1) R = 1.1 (+1.75) R = 1.0 (+1.5) R = 0.9 (+1.25) R = 0.8 (+1.0) R = 0.7 (+0.75) R = 0.6 (+0.5) R = 0.5 (+0.25) R = 0.4 R = 0.3 (-0.25) R = 0.2 (-0.5) R = 0.1 (-0.75) Exp. sys.
|y| < 0.5
Symbol : Data PH+P8(CUETP8M1)
Figure 4. Comparison of the ratio of the differential cross sections of jets of different sizes with respect to that of AK4 jets from data and from NLO predictions using powheg+pythia (CUETP8M1 tune) in the region |y|<0.5. Colored symbols indicate data and colored lines repre- sent prediction from simulation. Offsets by the amount written in the parentheses have been added to the corresponding data points to separate the results for different jet sizes.
All these uncertainties are added in quadrature, and are collectively referred as the theoretical uncertainty in what follows.
The correlation between the experimental and the theoretical uncertainties is not studied.
8 Results
8.1 Comparison of ratio of cross sections
The ratios of cross sections with respect to the AK4 jets are shown in figure4in the central region (|y|<0.5) for all the jet sizes using unfolded data and the prediction from the NLO MC generatorpowheg with pythiaparton showering; they are offset by fixed quantities for clarity.
The NLO powheg generator, interfaced with the parton showering model, describes the data well at moderate values of jet size, but there is a deviation at low pT for very large values of jet size.
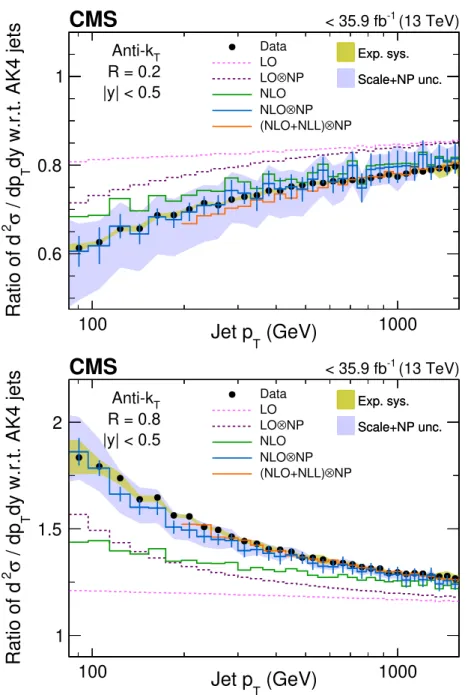
The ratios of the cross sections of inclusive AK2 and AK8 jets with respect to those of AK4 jets are computed at LO and NLO in pQCD, following eq. (1.5), withnlojet++for the most central region (|y|<0.5). The comparison with data is shown in figure 5. Both the LO and NLO predictions are systematically below data for AK8 jets and above data for AK2 jets. The NP correction is essential to describe the trend in data below medium jetpT
JHEP12(2020)082
(GeV) Jet p
T100 1000
dy w.r.t. AK4 jets
T/ dp σ
2Ratio of d
0.6 0.8 1
(13 TeV)
< 35.9 fb-1
CMS
Data LO
NP LO⊗ NLO
NP NLO⊗
NP (NLO+NLL)⊗
Exp. sys.
Scale+NP unc.
Anti-kT
R = 0.2
|y| < 0.5
Exp. sys.
Scale+NP unc.
(GeV) Jet p
T100 1000
dy w.r.t. AK4 jets
T/ dp σ
2Ratio of d
1 1.5
2
(13 TeV)
< 35.9 fb-1
CMS
Data LO
NP LO⊗ NLO
NP NLO⊗
NP (NLO+NLL)⊗
Exp. sys.
Scale+NP unc.
Anti-kT
R = 0.8
|y| < 0.5
Exp. sys.
Scale+NP unc.
Figure 5. Comparison of the ratios of differential cross sections for the AK2 (upper) and AK8 (lower) jets with respect to that of AK4 jets from data and pQCD predictions using nlojet++
in the region|y|<0.5. Black symbols indicate data and colored lines represent pQCD predictions.
Statistical uncertainties are shown as vertical bars for the data and the NLO⊗NP prediction. The yellowish olive region around data represents the experimental systematic uncertainty whereas the region shaded in light blue color around NLO⊗NP prediction shows the theoretical uncertainty in the prediction.
values. Also, the NLO calculation improves data-theory agreement significantly over LO, bringing data and theoretical prediction into agreement within statistical and systematic uncertainties atpT>1000 GeV for both AK2 and AK8 jets. Resummed calculations bring the theoretical prediction even closer to the data, especially for AK8 jets. The uncertainty
JHEP12(2020)082
corresponding to the resummed calculations is within 5% for cross section ratio, and is not shown here to avoid congestion in the figure.
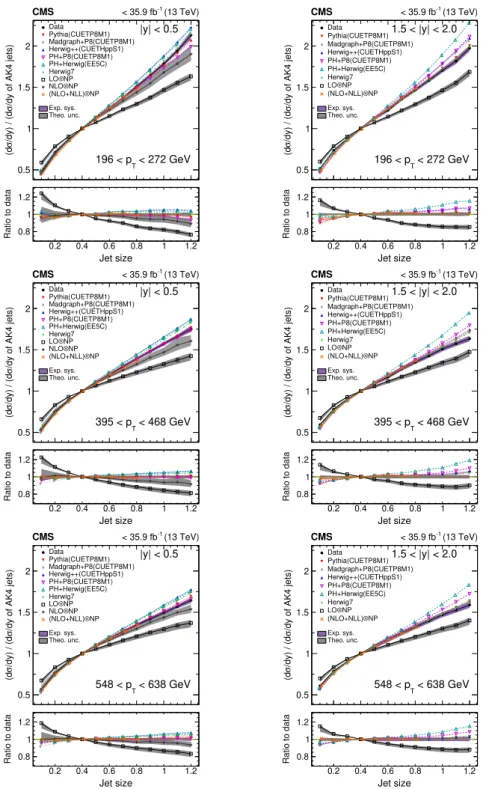
8.2 Variation of the ratio of cross sections with jet size
The cross section is determined as a function of pT for both data and theoretical predic- tions. The numbers are then divided by the cross section for the AK4 jets in the same pT and rapidity window separately for data and each theoretical prediction, and presented in figure 6, in three ranges of pT for the most central (|y| < 0.5) and the most forward (1.5<|y|<2.0) regions as a function of jet size. Almost all the MC simulations involving resummation via parton shower can describe the trend with jet size seen in data, whereas the LO calculation exhibits different behavior. Prediction from NLO calculation, as shown in |y| < 0.5, improves significantly the description of cross section ratio, as observed in data, for small jet sizes, and lies between the LO prediction and data for large jet sizes.
Analytic calculations with joint resummation, available for jet sizes up to 0.8, provide an advancement with respect to fixed-order predictions, and lead to a better agreement with data. Similar behavior is observed in all the rapidity regions reported.
9 Summary
A measurement has been made of the ratio of cross sections of inclusive anti-kT jets of multiple sizes with respect to jets with the distance parameter R = 0.4; this is the first such result from the CMS collaboration. Because of cancellation of many experimental and theoretical systematic uncertainties for the ratio, it is more sensitive to perturbative and nonperturbative effects than the absolute cross section measurement; the experimental sys- tematic uncertainty in the cross section ratio is of similar size as the statistical uncertainty, whereas the theoretical uncertainty is dominated by the choice of the renormalization and factorization scales.
From the ratio measurement, we observe that the nonperturbative correction is impor- tant in describing the data at low transverse momentum. Thus, the modeling of nonper- turbative effects, such as hadronization and the underlying event has a significant impact on the description of the data in different regions of phase space.
Finally, the variation of the ratio of cross sections with jet size R emphasizes the importance of the inclusion of parton showering algorithms to capture the effects of higher- order terms in the perturbation series by the resummation approach, which are absent in the case of fixed-order computation. This is also demonstrated by the analytic calculations using joint resummation in threshold for single jet production, and jet size. Therefore, this study shows the importance of final-state radiation modeled in Monte Carlo simulation to describe the data, and also implies that the differences between various parton showering and hadronization models are significant.
Acknowledgments
We congratulate our colleagues in the CERN accelerator departments for the excellent per- formance of the LHC and thank the technical and administrative staffs at CERN and at
JHEP12(2020)082
/dy of AK4 jets)σ/dy) / (dσ(d
0.5 1 1.5 2
Data Pythia(CUETP8M1) Madgraph+P8(CUETP8M1) Herwig++(CUETHppS1) PH+P8(CUETP8M1) PH+Herwig(EE5C) Herwig7
NP LO⊗
NP NLO⊗
NP (NLO+NLL)⊗ Exp. sys.
Theo. unc.
|y| < 0.5
< 272 GeV 196 < pT
CMS < 35.9 fb-1 (13 TeV)
Jet size
0.2 0.4 0.6 0.8 1 1.2
Ratio to data 0.8 1 1.2
/dy of AK4 jets)σ/dy) / (dσ(d
0.5 1 1.5 2
Data Pythia(CUETP8M1) Madgraph+P8(CUETP8M1) Herwig++(CUETHppS1) PH+P8(CUETP8M1) PH+Herwig(EE5C) Herwig7
NP LO⊗
NP (NLO+NLL)⊗ Exp. sys.
Theo. unc.
1.5 < |y| < 2.0
< 272 GeV 196 < pT
CMS < 35.9 fb-1 (13 TeV)
Jet size
0.2 0.4 0.6 0.8 1 1.2
Ratio to data 0.8 1 1.2
/dy of AK4 jets)σ/dy) / (dσ(d
0.5 1 1.5 2
Data Pythia(CUETP8M1) Madgraph+P8(CUETP8M1) Herwig++(CUETHppS1) PH+P8(CUETP8M1) PH+Herwig(EE5C) Herwig7
NP LO⊗
NP NLO⊗
NP (NLO+NLL)⊗ Exp. sys.
Theo. unc.
|y| < 0.5
< 468 GeV 395 < pT
CMS < 35.9 fb-1 (13 TeV)
Jet size
0.2 0.4 0.6 0.8 1 1.2
Ratio to data 0.8 1 1.2
/dy of AK4 jets)σ/dy) / (dσ(d
0.5 1 1.5 2
Data Pythia(CUETP8M1) Madgraph+P8(CUETP8M1) Herwig++(CUETHppS1) PH+P8(CUETP8M1) PH+Herwig(EE5C) Herwig7
NP LO⊗
NP (NLO+NLL)⊗ Exp. sys.
Theo. unc.
1.5 < |y| < 2.0
< 468 GeV 395 < pT
CMS < 35.9 fb-1 (13 TeV)
Jet size
0.2 0.4 0.6 0.8 1 1.2
Ratio to data 0.8 1 1.2
/dy of AK4 jets)σ/dy) / (dσ(d
0.5 1 1.5 2
Data Pythia(CUETP8M1) Madgraph+P8(CUETP8M1) Herwig++(CUETHppS1) PH+P8(CUETP8M1) PH+Herwig(EE5C) Herwig7
NP LO⊗
NP NLO⊗
NP (NLO+NLL)⊗ Exp. sys.
Theo. unc.
|y| < 0.5
< 638 GeV 548 < pT
CMS < 35.9 fb-1 (13 TeV)
Jet size
0.2 0.4 0.6 0.8 1 1.2
Ratio to data 0.8 1 1.2
/dy of AK4 jets)σ/dy) / (dσ(d
0.5 1 1.5 2
Data Pythia(CUETP8M1) Madgraph+P8(CUETP8M1) Herwig++(CUETHppS1) PH+P8(CUETP8M1) PH+Herwig(EE5C) Herwig7
NP LO⊗
NP (NLO+NLL)⊗ Exp. sys.
Theo. unc.
1.5 < |y| < 2.0
< 638 GeV 548 < pT
CMS < 35.9 fb-1 (13 TeV)
Jet size
0.2 0.4 0.6 0.8 1 1.2
Ratio to data 0.8 1 1.2
Figure 6. Comparison of the ratio of cross sections of inclusive jets of various sizes with respect to AK4 jets, as a function of jet size in different regions of jetpTin data, and for multiple theoretical predictions in rapidity bins |y|<0.5 (left column) and 1.5<|y| <2.0 (right column) at particle level. When the dijet production cross section ratio is presented using pure NLO predictions for two jet sizes, the ratio becomes LO atαS; this is quoted as LO⊗NP in the figure. Points corresponding to a particular prediction are connected via lines to guide the eye. Experimental uncertainties in the ratio of cross sections are shown with bands around the data points, whereas theoretical uncertainties are shown with the bands around the fixed-order predictions.
JHEP12(2020)082
other CMS institutes for their contributions to the success of the CMS effort. In addition, we gratefully acknowledge the computing centers and personnel of the Worldwide LHC Computing Grid for delivering so effectively the computing infrastructure essential to our analyses. Finally, we acknowledge the enduring support for the construction and operation of the LHC and the CMS detector provided by the following funding agencies: BMBWF and FWF (Austria); FNRS and FWO (Belgium); CNPq, CAPES, FAPERJ, FAPERGS, and FAPESP (Brazil); MES (Bulgaria); CERN; CAS, MoST, and NSFC (China); COL- CIENCIAS (Colombia); MSES and CSF (Croatia); RPF (Cyprus); SENESCYT (Ecuador);
MoER, ERC IUT, PUT and ERDF (Estonia); Academy of Finland, MEC, and HIP (Fin- land); CEA and CNRS/IN2P3 (France); BMBF, DFG, and HGF (Germany); GSRT (Greece); NKFIA (Hungary); DAE and DST (India); IPM (Iran); SFI (Ireland); INFN (Italy); MSIP and NRF (Republic of Korea); MES (Latvia); LAS (Lithuania); MOE and UM (Malaysia); BUAP, CINVESTAV, CONACYT, LNS, SEP, and UASLP-FAI (Mexico);
MOS (Montenegro); MBIE (New Zealand); PAEC (Pakistan); MSHE and NSC (Poland);
FCT (Portugal); JINR (Dubna); MON, RosAtom, RAS, RFBR, and NRC KI (Russia);
MESTD (Serbia); SEIDI, CPAN, PCTI, and FEDER (Spain); MOSTR (Sri Lanka); Swiss Funding Agencies (Switzerland); MST (Taipei); ThEPCenter, IPST, STAR, and NSTDA (Thailand); TUBITAK and TAEK (Turkey); NASU (Ukraine); STFC (United Kingdom);
DOE and NSF (U.S.A.).
Individuals have received support from the Marie-Curie program and the European Research Council and Horizon 2020 Grant, contract Nos. 675440, 752730, and 765710 (Eu- ropean Union); the Leventis Foundation; the A.P. Sloan Foundation; the Alexander von Humboldt Foundation; the Belgian Federal Science Policy Office; the Fonds pour la Forma- tion à la Recherche dans l’Industrie et dans l’Agriculture (FRIA-Belgium); the Agentschap voor Innovatie door Wetenschap en Technologie (IWT-Belgium); the F.R.S.-FNRS and FWO (Belgium) under the “Excellence of Science — EOS” — be.h project n. 30820817;
the Beijing Municipal Science & Technology Commission, No. Z191100007219010; the Ministry of Education, Youth and Sports (MEYS) of the Czech Republic; the Deutsche Forschungsgemeinschaft (DFG) under Germany’s Excellence Strategy — EXC 2121 “Quan- tum Universe” — 390833306; the Lendület (“Momentum”) Program and the János Bolyai Research Scholarship of the Hungarian Academy of Sciences, the New National Excellence Program ÚNKP, the NKFIA research grants 123842, 123959, 124845, 124850, 125105, 128713, 128786, and 129058 (Hungary); the Council of Science and Industrial Research, India; the HOMING PLUS program of the Foundation for Polish Science, cofinanced from European Union, Regional Development Fund, the Mobility Plus program of the Min- istry of Science and Higher Education, the National Science Center (Poland), contracts Harmonia 2014/14/M/ST2/00428, Opus 2014/13/B/ST2/02543, 2014/15/B/ST2/03998, and 2015/19/B/ST2/02861, Sonata-bis 2012/07/E/ST2/01406; the National Priorities Re- search Program by Qatar National Research Fund; the Ministry of Science and Education, grant no. 14.W03.31.0026 (Russia); the Tomsk Polytechnic University Competitiveness En- hancement Program and “Nauka” Project FSWW-2020-0008 (Russia); the Programa Es- tatal de Fomento de la Investigación Científica y Técnica de Excelencia María de Maeztu, grant MDM-2015-0509 and the Programa Severo Ochoa del Principado de Asturias; the
JHEP12(2020)082
Thalis and Aristeia programs cofinanced by EU-ESF and the Greek NSRF; the Rachada- pisek Sompot Fund for Postdoctoral Fellowship, Chulalongkorn University and the Chu- lalongkorn Academic into Its 2nd Century Project Advancement Project (Thailand); the Kavli Foundation; the Nvidia Corporation; the SuperMicro Corporation; the Welch Foun- dation, contract C-1845; and the Weston Havens Foundation (U.S.A.).
Open Access. This article is distributed under the terms of the Creative Commons Attribution License (CC-BY 4.0), which permits any use, distribution and reproduction in any medium, provided the original author(s) and source are credited.
References
[1] G.F. Sterman and S. Weinberg,Jets from Quantum Chromodynamics,Phys. Rev. Lett.39 (1977) 1436[INSPIRE].
[2] T. Sjöstrand,A Model for Initial State Parton Showers,Phys. Lett. B157(1985) 321 [INSPIRE].
[3] T.D. Gottschalk,Backwards evolved initial state parton showers,Nucl. Phys. B 277(1986) 700[INSPIRE].
[4] G. Marchesini and B.R. Webber,Simulation of QCD Jets Including Soft Gluon Interference, Nucl. Phys. B 238(1984) 1[INSPIRE].
[5] Y.L. Dokshitzer and B.R. Webber,Calculation of power corrections to hadronic event shapes, Phys. Lett. B352(1995) 451[hep-ph/9504219] [INSPIRE].
[6] CDFcollaboration, Charged Jet Evolution and the Underlying Event inp¯pCollisions at 1.8TeV,Phys. Rev. D 65(2002) 092002[INSPIRE].
[7] N. Kidonakis, G. Oderda and G.F. Sterman,Threshold resummation for dijet cross-sections, Nucl. Phys. B 525(1998) 299[hep-ph/9801268] [INSPIRE].
[8] M.H. Seymour,Jet shapes in hadron collisions: Higher orders, resummation and hadronization,Nucl. Phys. B 513(1998) 269[hep-ph/9707338] [INSPIRE].
[9] X. Liu, S.-O. Moch and F. Ringer,Threshold and jet radius joint resummation for single-inclusive jet production,Phys. Rev. Lett.119(2017) 212001[arXiv:1708.04641]
[INSPIRE].
[10] M. Cacciari, G.P. Salam and G. Soyez, The anti-kt jet clustering algorithm,JHEP 04(2008) 063[arXiv:0802.1189] [INSPIRE].
[11] CMScollaboration, The CMS Experiment at the CERN LHC,2008JINST 3S08004 [INSPIRE].
[12] CMScollaboration, Measurement of the Inclusive Jet Cross Section inpp Collisions at
√s= 7TeV, Phys. Rev. Lett.107(2011) 132001[arXiv:1106.0208] [INSPIRE].
[13] CMScollaboration, Measurement and QCD analysis of double-differential inclusive jet cross sections in pp collisions at√
s= 8TeV and cross section ratios to 2.76and7TeV,JHEP 03 (2017) 156[arXiv:1609.05331] [INSPIRE].
[14] CMScollaboration, Measurement of the double-differential inclusive jet cross section in proton-proton collisions at√
s= 13TeV,Eur. Phys. J. C 76(2016) 451[arXiv:1605.04436]
[INSPIRE].