저작자표시-비영리-변경금지 2.0 대한민국 이용자는 아래의 조건을 따르는 경우에 한하여 자유롭게
l 이 저작물을 복제, 배포, 전송, 전시, 공연 및 방송할 수 있습니다. 다음과 같은 조건을 따라야 합니다:
l 귀하는, 이 저작물의 재이용이나 배포의 경우, 이 저작물에 적용된 이용허락조건 을 명확하게 나타내어야 합니다.
l 저작권자로부터 별도의 허가를 받으면 이러한 조건들은 적용되지 않습니다.
저작권법에 따른 이용자의 권리는 위의 내용에 의하여 영향을 받지 않습니다. 이것은 이용허락규약(Legal Code)을 이해하기 쉽게 요약한 것입니다.
Disclaimer
저작자표시. 귀하는 원저작자를 표시하여야 합니다.
비영리. 귀하는 이 저작물을 영리 목적으로 이용할 수 없습니다.
변경금지. 귀하는 이 저작물을 개작, 변형 또는 가공할 수 없습니다.
Master’s Thesis of Science in Agriculture
Surface Energy and Microstructure of Fresh and Processed Foods and Their Relation to Foreign
Matters Adhesion
신선식품과 가공식품의 표면에너지 및 미세구조와 외부물질 흡착과의 관계
August 2021
Dayoung Lim
Department of International Agricultural Technology Graduate School of International Agricultural Technology
Seoul National University
Abstract
Food surface properties, such as wettability and microstructure, are primarily responsible for the adhesion of foreign matters (particulate matters, pesticides, microorganisms, etc.) to foods. Among the foreign matters, air pollution caused by particulate matters (PM) has become a global issue. PM is known to threaten human health by causing respiratory and cardiovascular disease. PM can be introduced to human gastrointestinal tract through food intake, causing inflammation and changes in gut microbiota. Even at low PM concentrations, prolonged exposure to PM can cause significant accumulation of PM in food surfaces is expected to be strongly influenced by properties of food surfaces, but few studies have been reported. Fresh foods are perishable, therefore, postharvest technology is required to reduce quality loss during storage and retail process. Commonly used food packaging material is chemical synthesized and their non-degradable characteristics cause environmental issues. Edible coating is an alternative material, a thin material attached to the surface forming a barrier and functioning as a physical protectant.
This paper examines surface properties that may affect the interaction between foreign matters, PM and edible coating solution, and food surfaces, including surface wettability and surface microstructure. Understanding the adhesion of PM onto food surfaces can provide useful guidance for classifying foreign matter-interactive foods and controlling food chains to ensure food safety against PM or an efficient use of resources to prevent any waste or product loss.
Six popular food products (perilla, scallion, bell pepper, red lettuce, sundae, and laver) were analyzed. To determine the SFE, static contact angles of six liquids (water, diiodomethane, 2-propanol, ethylene glycol, formamide, and
Kaelble) and Zisman methods. To quantify the microstructure, amplitude and distance roughness parameters, such as arithmetical mean height (Ra and Sa), root mean square height (Rq and Sq), maximum height (Rz and Sz), and mean width of profile elements (RSm), were measured by confocal laser scanning microscopy. Laver and sundae showed highSFE (45.5 ~ 58.7 mN/m), while scallion tail had the lowest value (17.6 mN/m), indicating that sundae had the strongest tendency to interact with foreign matters among the tested foods and scallion tail had the lowest tendency. The red lettuce (adaxial) showed relatively high amplitude roughness, whereas the laver, perilla (adaxial), and bell pepper were low. Distance parameters were high at scallion tail and low at perilla adaxial.
The adhesion of PM and chitosan solution to the real food surfaces were determined by the amount of adsorbed PM on the surface and the wettability of coating solution, respectively, followed by statistical analysis to correlate the adhesion and the food surface properties. The result shows that the PM adhesion on the food surface was mainly affected by the surface microstructre, more specifically, mean width between the surface elements.
The results obtained in this study provide a useful information to understand the surface characteristics and their effects on the foreign matter adhesion which can be a guideline to ensure food safety related to contamination of PM, a potential risk to human health, and efficient use of resources to prevent any waste or product loss.
Key words: Food surface, Adhesion, Surface wettability, Microstructure, Particulate matter, Edible coating
Student number: 2019-21780
Contents
Abstract ··· i
Contents ··· iii
List of Tables ··· vii
List of Figures ··· ix
Chapter 1 Research background ··· 1
1. Food surface ··· 1
1.1. Surface properties ··· 1
1.1.1. Surface wettability ··· 1
1.1.1.1. Definition ··· 1
1.1.1.2. Main technologies for surface tension measurement ··· 6
1.1.2. Surface microstructure ··· 11
1.1.2.1. Definition ··· 11
1.1.2.2. Main technologies for microstructure measurement ··· 12
2. Foreign matters ··· 14
2.1. Types of foreign matters ··· 14
2.2. Particulate matters ··· 14
2.2.1. Definition ··· 14
2.2.2. Characteristics and emission source ··· 15
2.2.3. Impact on human health ··· 16
2.3. Edible coating ··· 19
2.3.1. Definition ··· 19
2.3.2. Applications ··· 19
2.3.3. Materials for edible coating ··· 20
2.3.4. Chitosan for edible coating ··· 21
3. Adhesion of foreign matters to food surfaces ··· 23
3.1. Thermodynamic aspects ··· 23
4. Research significance ··· 24
5. Overall Objectives ··· 27
Chapter 2 Determination of food surface properties ··· 28
1. Introduction ··· 28
2. Materials and methods ··· 29
2.1. Materials ··· 29
2.1.1. Fresh produce ··· 29
2.1.2. Processed foods ··· 29
2.1.3. Liquids for wettability measurement ··· 30
2.2. Contact angle measurement ··· 32
2.3. Calculation of surface free energy of solid··· 33
2.3.1. Zisman method ··· 33
2.3.2. OWRK method ··· 33
2.4. Roughness ··· 34
2.5. Statistical analysis ··· 36
3. Results and discussion··· 36
3.1. Contact angle ··· 36
3.2. Wettability ··· 38
3.3.1. Zisman method ··· 38
3.3.2. OWRK method ··· 40
3.3. Roughness ··· 42
4. Conclusion ··· 47
Chapter 3 Correlation between food surface properties and adsorption of foreign matters ··· 48
1. Introduction ··· 48
2. Materials and methods ··· 50
2.1. Materials ··· 50
2.1.1. Food surfaces ··· 50
2.1.2. Chitosan ··· 50
2.2 Adhesion of particulate matter on food surface ··· 52
2.2.1 Particulate matter dispersion in chamber ··· 52
2.2.2 Particle size measurement ··· 53
2.3 Adhesion of chitosan edible coating solution on food surface ·· 53
2.3.1 Preparation of chitosan solution ··· 53
2.3.2 Surface tension measurement ··· 53
2.3.3 Contact angle measurement ··· 54
2.3.4 Wettability of the solution ··· 54
2.4 Statistical analysis ··· 54
3. Results and discussions ··· 57
3.1. Particulate matter adhesion ··· 58
3.2. Chitosan edible coating adhesion ··· 65
3.2.1 Surface tension measurement ··· 65
3.2.2 Contact angle measurement ··· 67
3.2.3 Wettability of the solution ··· 72
4. Conclusions ··· 76
References ··· 77 Abstract in Korean ··· 92
List of Tables
Chapter 1
Table. 1.1. Main technologies for surface microstructure measurements ··· 13 Table. 1.2. Potential deposition locations of particulate matters according to the size in respiratory system ··· 18
Chapter 2
Table. 2.1. Surface tension parameters (mN/m) of six liquids used for experiments ··· 31 Table. 2.2. Profile and areal roughness parameters evaluated ··· 35 Table. 2.3. Contact angle (CA) at equilibrium and time for equilibrium (EQT) from the deposition ··· 37 Table. 2.4. Result of surface profile and areal roughness in amplitude parameters ··· 44 Table. 2.5. Result of surface profile roughness parameter for mean width of profile elements ··· 45
Chapter 3
Table. 3.1. Specification information of chitosan used in the experiments
··· 51
Table. 3.2. Values of surface wettability and roughness parameters
obtained for perilla (adaxial), red lettuce (adaxial), and bell pepper,
which were correlated to the amount of PM adhered to the surfaces of
the foods ··· 56
Table. 3.3. Spearman correlation coefficient values for factors of surface
properties and particulate matter adhesion ··· 64
Table. 3.4. The surface tension of the chitosan solution ··· 66
Table. 3.5. Contact angle of chitosan solution on the food surfaces ··· 70
Table. 3.6. Work of adhesion (W
a) and spreading coefficient (W
s) values
of solutions ··· 74
Table. 3.7. Spearman’s correlation coefficient values for surface
properties factors related with the adhesion of chitosan edible coating
solution ··· 75
List of Figures
Chapter 1
Fig. 1.1. Contact angle (θ) between liquid droplet and solid surface ···· 4 Fig. 1.2. Contact angle (θ) of a droplet on a solid surface ··· 5 Fig. 1.3. Schematics of surface tension measurement methods ··· 10 Fig. 1.4. Research strategy ··· 27
Chapter 2
Fig. 2.1. Zisman plot to estimate the critical surface tension (γ
c) of foods.
··· 39 Fig. 2.2. Surface free energy of foods calculated by OWRK method. 41 Fig. 2.3. 2D surface image (grayscale) obtained by CLSM ··· 46
Chapter 3
Fig. 3.1. Particle size distribution of model particulate matter ··· 55 Fig. 3.2. Number density of model PM deposited on food surfaces (perilla, ●; red lettuce, ■; bell pepper, ▲) during 2 hours exposure in chamber. ··· 60 Fig. 3.3. Linear regression analysis between the total surface free energy (
𝛾SG, mN/m) of food samples and number density of model PM (x10
5/cm
2) at different exposure time (30 min, ●; 60 min, ▼; 90 min,
■; 120 min ◆; slope, ▲). ··· 61
Fig. 3.4. Linear regression analysis between the polar component of
surface free energy (𝛾
𝑝, mN/m) of food samples and number density of
model PM (x10
5/cm
2) at different exposure time (30 min, ●; 60 min,
▼; 90 min, ■; 120 min ◆; slope, ▲). ··· 62 Fig. 3.5. Linear regression analysis between the surface mean width (RSm) parameter of food samples and number of model PM at different exposure time (30 min, ● ; 60 min, ▼ ; 90 min, ■ ; 120 min ◆ ; slope,
▲). ··· 63
Fig. 3.6. Contact angle of chitosan solution on the food surfaces··· 71
Chapter 1.
Research background 1. Food Surface
Food surface is the outmost layer of food acting as a barrier exposed to atmosphere and plays an important role in the interactions with foreign matters, for example, rain drops retention on the agricultural products, attachment of microbial contaminants, chemical contaminants including pesticide residues or detergent used in kitchen, air pollutants such as particulate matter and cooking ingredients. (Ashokkumar et al., 2012; Fernandes et al., 2014; Gao et al., 2020;
Noh et al., 2019; Przybysz et al., 2020). Food surface properties are related to the physical, sensory, and textural properties of final products, such as product appearance, texture, shelf-life, taste perception, and rheology of the products (Rosell et al., 2018).
1.1. Surface properties
Adhesion of foreign matters such as microbial, chemical contaminants and particulate matters occur at food surface and affected by various food surface properties. These properties include surface microstructure, surface wettability, surface charge, surface area, chemical composition, temperature and, etc.
1.1.1 Surface wettability
Wettability is one of basic properties of a solid surface playing important role in many biological, chemical, and physical processes in agriculture, food, and pharmaceutical industries and also in daily life (Huhtamäki et al, 2018; Rossi et al., 2018).
Food surface wettability, the phenomenon of wetting or non-wetting of a solid material by a liquid, can be quantified with contact angle measurement (Karbowiak et al., 2006). A good wettability is that strong affinity appears between liquid and solid and tends to adhere to each other (Michalski et al., 1997).
(1) Surface tension
Surface tension (γ) is free energy of the surface at any gas/liquid interface defined as force per unit length or energy per unit area. In thermodynamics, the term energy per unit area is called surface free energy for solid and liquid surfaces (Jouyban and Fathi-Azarbayjani, 2012). The surface tension of liquid can be directly measured, but for the solid surface, surface free energy can be measured indirectly using contact angles. (Gao et al., 2018; van Oss et al., 1986 and 1988; Zisman, 1964)
(2) Contact angle (contact angle, θ)
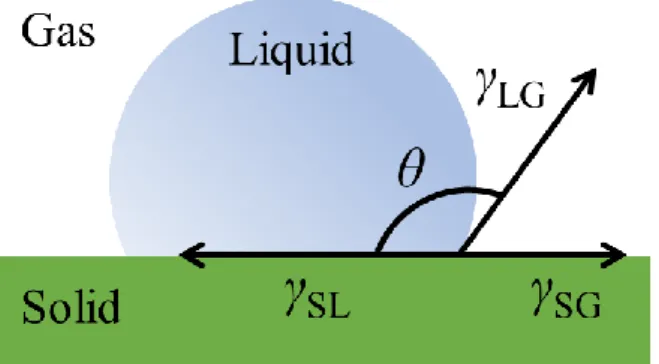
Contact angle of a liquid drop represents the surface tension measured at the liquid/gas/solid surface three-phase boundary, which is at equilibrium when the droplet is sitting (static) on a solid surface (Nairn et al., 2011). Fig.1.1.
The Young’s equation explains the relationship between solid surface tensions 𝛾SG (N/m), liquid surface tension 𝛾LG (N/m) and the interfacial tension between solid and liquid 𝛾SL (N/m) with liquid contact angle 𝜃. (Eq.
1)
𝛾SG= 𝛾SL+ 𝛾LG𝑐𝑜𝑠 𝜃 (1) The measured contact angle value is between 0° to 180°. Contact angle 0°
means complete spreading on solid done by a deposited liquid and 180° is no
wetting (Karbowiak et al., 2006). Normally contact angle between 0-90° is considered as good wetting and bigger than 90° indicates un-favorable wetting (Yuan and Lee, 2013)
Water contact angle measurement is the most widely used method to quantify the wettability of a solid surface evaluating the contact angle under 65° as hydrophilic and over 65° as hydrophobic surface (Vogler 1998). When a liquid droplet is deposited on a solid food surface, there are 2 further situations are expected. One is that the solid surface is well wetted by the liquid showing the low contact angle. And the other is that not wetted showing high contact angle.
(Fig. 1.2.)
Fig. 1.1. Contact angle (θ) between liquid droplet and solid surface
* This figure was published “Current research status and analysis methods on the effects of food surface properties on particulate matter adsorption (2021)”
in Food Science and Industry (Lim et al., 2021).
Fig. 1.2. Contact angle (𝜽) of a droplet on a solid surface (Lim et al., 2021)
* This figure was published “Current research status and analysis methods on the effects of food surface properties on particulate matter adsorption (2021)”
in Food Science and Industry (Lim et al., 2021).
1.1.1.2. Main technologies for surface tension measurement
To measure the surface tension, contact angle measurements can be performed using various methods including Wilhelmy plate method, capillary rise method, goniometer and sessile drop methods as described in Fig. 1.3.
(Dingle and Harris, 2005; Jouyban and Fathi-Azarbayjani, 2012).
(1) Wilhelmy plate method
Metal plate is attached vertically to the balance via thin metal wire and can be used to measure equilibrium interfacial tension at an air-liquid or liquid- liquid interface. Plate is immersed into and pulled out of the test liquid. During the experiment, the force are recorded and two contact angles (advancing and receding contact angle) with surface tension is calculated. The static surface tension (γ, N/m) can be calculated using the Wilhelmy equation (Eq. 1) (Michalski et al., 1997)
𝛾 = 𝐹
𝑙 𝑐𝑜𝑠 𝜃 (2)
where 𝐹 is the wetting force difference between immersion and withdrawl (N/m), 𝑙 is the wetted perimeter of the plate, and 𝜃 is the contact angle (advancing or receding).
(2) du Noüy ring method
Du Noüy ring method is used traditionally in static surface or interfacial tension measurement. Similar to the Wilhelmy plate method in using the
balance. A ring is required to be wetted by dipping in the liquid then being pulled to measure the force exerted on the ring (Fig. 1.3.). Maximum pulling force on a ring by the surface is measured and it is possible to measure the interfacial tension at bot liquid-air and liquid-liquid interface based on the (eq.
2) (Bodour and Miller-Maier, 1998) 𝛾 = 𝐹
𝑝 𝑐𝑜𝑠 𝜃𝑓 (3)
where 𝑝 is the three-phase contact line perimeter, and 𝑓 is the correction factor. The 𝜃 is the contact angle and F is the acting force on the thre-phase contact line (Tyowua et al., 2018).
(3) Maximum bubble pressure
This is one of dynamic surface tension measurement methods involving flow of a gas bubble blown at a constant rate through a capillary in a liquid. The dynamic surface tension can be calculated by Young-Laplace equation (Eq. 4)
𝛾 =∆𝑃max𝑅
2 (4)
where ∆𝑃max is the maximum pressure diffefrence, and R is the capillary radius. A single interfacial tension value is coming from each bubble (Garret and Ward, 1989).
(4) Drop volume (weight) method
Among other surface tension measurement, drop shape techniques are considered as reliable and easy method (Jouyban and Fathi-Azarbayjani, 2012).
Weighing the mass of the liquid drop or volume which falls off from capillary tip with known diameter. As falling off drop weight is related to the interfacial tension, the known gravitational force is use for calculation.
𝑊 = 𝑉∆𝜌𝑔 = 2𝜋𝑟𝑓 (5)
where ∆𝜌 is the density difference between heavy and light phase, g is the gravitational constant, r is capillary radius tip and f is empirical drop correction factor (Jouyban and Fathi-Azarbayjani, 2012).
(5) Pendant drop method
Whilhelmy plate technique requires zero contact angle when liquid contacts the plate therefore the potein solutions and high viscous solutions are difficult to use. For viscous solutions, static methods (sessil drop, spinning drop and pendant drop method) are generally used (Arashiro and Demarquette, 1999).
Pendant drop can produce accurate static and dynamic interfacial tensions and contact angle measurement for viscous solutions. The equation used to pendant drop method is Bashforth and Adams which is based on Laplace’s equation.
(Eq. 6)
𝛾 =∆𝜌𝑔𝐷𝐻 𝑒2 (6)
where g is gravitational constant, ∆𝜌 is the density difference, D is the equatiorial diameter of drop at the apex and H is the shape factor.
(6) Sessile drop method
Analysis of profile of the drop deposited on a solid surface. When the contact angle is small, it is difficult to observe the contact angle. Using sessile drop technique, contact angle between solid, liquid and gas phases is determined. By solving Young’s equation (Eq. 1), properties of solid surface can be characterized (Dingle and Harris, 2005).
(7) Spinning drop method
This method is a profile analysis of less dense phase liquid drop rotating in a heavy phase contained in a tube. The tube with longtitudinal axis case the lower density fluid to centrifuge to center and form an elongated drop. Interfacial tension can be calcualated from Vonnegut’s Equation (Eq. 7)
𝛾 =1
4𝑟3∆𝜌𝜔2 (7)
where r is the radius of cylindrical drop, ∆𝜌 is the density difference between the drop and fluid and 𝜔 is the rotational velocity. This technique is adequate for measuring very low interfacial tension (Jouyban and Fathi- Azarbayjani, 2012).
(8) Capillary rise method
Applied widely in pharmacy being considered as a standard method for surface tension and wettability of a liquid determination. This method is based on measuring the penetration time needed for a liquid to reach a certain height.
According to the rising speed, the contact angle can be calculated (Ramírez- Flores et al., 2010; Xue et al., 2006). Capillary penetration of liquid using the pressure difference across the invading liquid meniscus is considered to calculate the surface tension described by Washburn equation (Eq. 8).
ℎ2=𝑡𝑅𝛾LGcos 𝜃
2𝜂 (8)
where h is the moved distance by liquid, t is time for solvent to rise, R is the pore radius, 𝛾LG is the surface tension of liquid, 𝜃 is the contact angle and 𝜂 is the viscosity of liquid (Karbowiak et al., 2006).
Fig. 1.3. Schematics of surface tension measurement methods (Jouyban and Fathi-Azarbayjani, 2012; Lim et al., 2021; Tyowua et al., 2018)
1.1.2. Surface microstructure
Food microstructure is defined as the spatial arrangement of its structural components and their interactions, also have significant impact on the physical, sensory, and textural properties (Rosell et al., 2018).
1.1.2.1. Definition
Many food materials are semi-solids with fragile microstructure (Chen, 2007). Food microstructure can be defined as the spatial arrangement of the cell and the intercellular space in food material (Aguilera, 2005). Food composition and organization have a great impact on stability, structure, and nutritional value of food product. As structural changes during food processing can degrade food quality, a major concern is to preserve the original microstructure of the food materials (Rosell et al., 2018). Microstructure properties such as grooveness, pores are the features found on the food surface including morpholometrical variables in plant surface, epidermal cells, epicuticular wax crystals and thickness and trichomes (Castanheiro et al., 2021; Gorb and Gorb, 2008; Nairn et al., 2011). These features characterize the surface texture repetitive or random deviation from the nominal surface that forms the three dimensional topography of the surface. Surface texture includes (1) roughness (nano- and microroughness), (2) waviness (macroroughness), (3) lay, and (4) flaws (Bushan, 2001). Their has been many studies on the effect of plant leaf surface or food contact surface microstructures on foreign matter adsorption such as microbial adhesion, particulate matter and uneven surfaces, crevices, or pores may hide the microorganisms (Chen et al., 2017; De-la-Pinta et al., 2019;
Wang et al., 2009). In study of the settlement of M. galloprovincialis, surface texture was the key factor having more effect than wettability in settlements.
Settlement rate and attachment strength was high at 400 μm grooves which was bigger than the larvae.
1.1.2.2. Main technologies for microstructure measurements
Chen (2007) classified surface characters which affect to the surface texture perception as glossiness, roughness/smoothness, moistness, freshness, grittiness, coarseness, stickiness, lubricity, flakiness, fibrousness, juiciness.
And among these mentioned characters, only a few of surface-related characters (roughness, glossiness, grittiness, moistness) can be quantified by physical techniques (Chen, 2007). Surface roughness can be defined as a collective measure of the magnitude and density of surface asperities (Chen, 2007). Topographical features are most influential and most widely used parameters in surface characterization studies (Chen, 2007). Surface microstructure measurement techniques can be categorized into contact-based and non-contact-based instruments. (Table. 1.1.)
Scardino et al. (2006) studied diatom attachment on microtextured surface and they reported that the number of the attachment points on a surface is related. Surface can be visualized with feature shapes such as peaks and valleys on the horizontal plane. Two dimensions by a cross-sectional line profile and three dimensions by the surface topography are available.
Table. 1.1. Main technologies for surface microstructure measurements (Chen, 2007; Rosell and Garzon et al., 2018; Verboven et al., 2018)
Types Methods
Surface
contacting Surface profile
tracking Contact
profilometry Stylus profiler
Atomic force microscopy (AFM)
Non surface- contacting
Two-dimensional (2D) imaging techniques
Optical
microscopy Bright filed microscopy Dark filed microscopy Phase contrast microscopy Fluorescence microscopy Surface Glistening Points (SGP) method
Electron
microscopy Scanning electron microscopy (SEM)
Environmental SEM (ESEM) Cryo-SEM
Three-
dimensional (3D) imaging
techniques
Confocal laser scanning microscopy (CLSM) Optical coherence tomography (OCT) Whiter light scanning interferometry (WLSI)
2. Foreign matters
In this sturdy, any substances that are capable of being adhered onto the food surface will be defined as a foreign matter.
2.1. Types of foreign matters
On the surface of food, many foreign matters can be attached and found such as chemical materials and miroorganisms. Considering the circular food system, foods go through production, processing, retail and consumer stages to be finally consumed (Thakali and MacRae, 2021). In each stage, some substances (foreign matters) can be attached to the food surface either intentionally or non- intentionally. Intentionally used materials are irrigation water, pesticides, fertilizers at production stage, detergents, coating solution and diatomaceous earth particles at processing stage, and sauces, cooking oils, detergent at consumer stage. However, if the food is exposed to external environment, non- intentional attachment of rain drop, insects, pollen and contaminants such as contaminated soil, heavy metals, particulate matters, foodborne pathogens can happen during all stages (Thakali and MacRae, 2021).
2.2. Particulate matters 2.2.1. Definition
The particulate matter (PM) is a term referring to mixed substances of solid and liquid. The composition, size and emission source vary between locations and time. The size of particulate matter is ranging from 0.01 to 100 μm
aerodynamic diameter (AQEG, 2005), and generally classified as coarse particle for diameter from 2.5 to 10 μm, fine particle from 0.1 to 2.5 μm and ultrafine particle smaller than 0.1 μm in diameter (Beckett et al., 1998;
Oberdörster and Utell, 2002).
In Korea, air quality issue including particulate matter is defined and managed via Clean air conservation act of 2020 and the Special act on the reduction and management of fine dust of 2020. According to these acts, particulate matter is notated with the term “fine dust” which is defined as inhalable dust among the particulates floating in the air or falling down in the air. The dust with a diameter under 10 μm is defined as PM10 and the dust with a diameter under 2.5 μm is PM2.5. In addition, Nitrogen oxides, sulphur oxides, volatile organic compounds and other substances prescribed by Ordinance of the Ministry of Environment are defined as substances which can be converted into Particulate matter in the air (Clean air conservation act, 2020; Special act on the reduction and management of fine dust, 2020).
2.2.2. Characteristics and emission source
Particulate matters (PM) can be emitted from both natural and anthropogenic sources. PM originated from nature include dust, soil, sea salt, forest fire or volcanic ash, pollens, some microorganism, and the oxidation of biogenic reactive gases. PM originated from anthropogenic source are fossil fuel combusition, industrial activities, cigarette smoking, home cooking and etc.
(Anderson et al., 2012; Hu et al, 2015; Joo and Ji, 2020; Kelly and Fussell, 2012) PM in urban areas, vehicles and fossil fuel power plants are main source of emission (Kelly and Fussell, 2012).
Particulate matters are also classified by its creation stages, primary
particulate matters (PPM), and secondary particulate matters (SPM). PPM are emitted directly from the emission source such as vehicle combustion, industrial process, soil dusts and marine aerosol. When PPM is generated from the source, atmospheric pollutants, gaseous precursors, such as sulfur dioxide, nitrogen oxides, ammonia, and volatile organic compounds are generated together with PPM. SPM is a result coming from chemical reaction of PM producible substances emitted from direct source and then neutralized by atmospheric ammonia derived from agricultural sources in the atmosphere (Kelly and Fussell, 2012; Kim et al., 2015).
Particulate matter composition differs depending on the collect location, emission source and season, also it has different pattern in a day (Ham et al., 2016; Hu et al., 2015; Lee et al.,2015). Also, it is affected by meteorological condition and particulate matter generated in a region can move to another region (Hu et al., 2015).
2.2.3. Impact on human health
In 2013, International Agency for Research on Cancer (IARC), the specialized cancer agency of the World Health Organization, classified the particulate matter as carcinogenic to humans (Group 1) (IARC, 2013). The Ministry of Environment of the Republic of Korea retains the national air quality standard for Particulate matter concentration to protect public health based on the Enforcement decree of the framework act on environmental policy.
The standards limits the annual average of PM10 to 50 μg/m3 and PM2.5 to 15 μg/m3 and the 24-hour average of PM10 to 100 μg/m3 and PM2.5 to 35 μg/m3.
Wide range of diseases can be occurred due to particulate matter exposure.
It is well known that PM penetrate into the human body through respiratory
tract and the particles having less than 10 μm in diameter can have impact on human health. PM10 are usually trapped in the upper airways, while PM2.5 can penetrate deeper to the alveolar portions of the lung (Table. 1.2.). The smaller a particle is, the deeper penetration to the lung (Kim et al., 2015). PM related health problem is increasing hospital admissions, emergency room visits, respiratory symptoms and cardiovascular diseases, decreased lung function, and premature mortality (Guaita et al., 2011; Halonen et al., 2009; Perez et al., 2012; Samoli et al., 2008). Oxidative stress is suspected as one of the major mechanisms of these genotoxic effects (Kim et al., 2015). There are studies that exposure to PM is related with low birth weight in infants, pre-term deliveries, and possibly fetal and infant deaths (Son et al., 2012; Woodruff et al., 2006).
Exposure to PM produces a uniform degree of mortality in exposed populations, in spite of its diverse sources (Veronesi et al, 2002).
Table. 1.2. Potential deposition locations of particulate matters according to the size in respiratory system (Kim et al., 2015)
Respiratory system PM size (μm)
Nasal passages 7 – 11
Pharynx 4.7 – 7
Trachea 3.3 – 4.7
Primary bronchi 3.3 – 4.7
Bronchi branches 1.1 – 2.1
Bronchioli 0.65 – 1.1
Alveoli 0.43 – 0.65
2.3. Edible coating 2.3.1. Definition
Edible coating is thin material based on biopolymers forming a layer on the food product surface to protect the fresh products from the mechanical, physical, chemical and microbiological damage during storage and distribution process.
There are edible film which has similar use of purpose and material (Falguera et al., 2011; Sobral et al., 2008), but the main difference between the edible film and coating is separability. Film is a separable material from the food but coating is applied directly on the food surface by dipping, spraying, or brushing or replacing natural protective waxy coatings (González-Aguilar et al., 2008).
2.3.2. Applications
Fresh foods such as fruits, vegetables, meats and seafoods are perishable after harvested, butchered or caught. Therefore, postharvest technology are required to reduce quality loss during storage and retail process. As mentioned in advance, edible coating is a thin material attached to the surface forming a barrier and functioning as a physical protectant. Commonly used food packaging material is chemical synthesized therefore non-degradable characteristics causes enviromnetal issues. As a alternative material edible coating is getting attention and studied.
Edible coating can be used widely in food industry for preventing or reduction of moisture transfer, gas exchange, antimicrobial infection of fresh foods such as fruits and vegetables to improve or maintain the physico-
chemical, chemical and sensory quality and shelf life (Martín et al., 2019; Riva et al., 2020). Common materials used in edible coatings are polysaccharide, protein, lipid, or multicomponent mixtures.
The envelope types (packaging, wrapping or coating) are important for conservation, distribution and marketing of food products. Their functions are to protect the product from mechanical, physical, chemical damage and microbiological activities. These characteristics are influenced by parameters such as the kind of material implemented as structural matrix (composition, molecular weight distribution), the conditions under which films are preformed (type of solvent, pH, components concentration and temperature) and the type and concentration of additives (plasticizers, cross-linking agents, antimicrobials, antioxidants or emulsifiers) (Guilbert et al., 1996; Rojas-Grau et al., 2009).
2.3.3. Materials for edible coating
There are many materials that can be used for edible coating. Major materials for producing an edible coating are polysaccharides, proteins, and lipids with other agents for fresh produces such as fruit, vegetables and marine products.
Expecting effects of edible coating are water loss reduction, internal CO2 reduction, less color change, acidity maintenance, shelf life increase, quality loss prevention, less ethylene production, chlrorophil loss delay, after-ripening delay, weight loss reduction and firmness (Dhall, 2013).
(1) Polysaccharides
Abundant and various natural source, excellent gas barrier property can be formed. Cellulose, starch, gums and chitosan are commonly used and their linear structure is able to make the film tough, flexible, transparent and resistant
to fats and oils (Dhall, 2013).
Cellulose derivatives such as carboxymethyl cellulose (CMC), methyl cellulose (MC), hydroxypropyl methyl cellulose (HPMC), and hydroxypropyl cellulose (HPC) have ability to generate good film with characteristics of odorless and tasteless, flexible, resistant to oil and fats, water solubility, permeability of transmitting moisture and oxygen. Higher molecular weight can form better mechanical properties, but these materials are expensive to be used industry (Dhall, 2013).
Starch is the storage polysaccharide of plants and it is renewable and suitable raw material for industrial uses. It is well known that the most starches are composed of two types of glucose polymers which are amylase and amylopectin (Rodríguez et al., 2006). Having characteristics of inexpensiveness, renewability and good mechanical properties allows the starch based film to replace the plastic polymer. High amylose starch based film can form a good barrier to oxygen but amylopectin is not a good choice as it generates weaker tensile strength and elongation. Starch requires plasticizer to form a film such as glycerol, polyether and urea that are able to limit microbial growth by decreasing water activity.
(2) Chitin and Chitosan
Chitin is the second abundant biopolymer from nature, found in exoskeleton of crustaceans, fungal cell walls. Chitosan is a derivatives of chitin and is structurally similar to cellulose. Chitosan coating can delay ripening and decreasing transpiration rates of fruit and vegetables by forming semipermeable, clear tough, flexible and good oxygen barriers (Dhall, 2013).
2.3.4. Chitosan edible coating
Chitosan is a material of polysaccharide derived from partially deacetylated derivative of chitin. Its chemical structure is a linear unbranched polymer of β- (1-4)-linked d-glucosamine and N-acetyl-d-glucosamine (Malerba et al., 2018).
Chitin is the second most abundant polysaccharide source in nature after cellulose (Shahidi et al., 1999), being found in several organisms such as fungi, algae, marine invertebrate and arthropods (Kurita, 2006). Although the chitin is available from various sources, the main source of chitosan is marine crustacean’s shell waste of crab, shrimp, lobster, etc.
Chitosan is widely used in food, agriculture, fishery, and pharmaceutical industries, having numerous advantages in safety, cost, and biodegradability.
Its low toxicity, high lethal dose of 1.6g/kg of body weight in rats, is well known characteristic and enabled chitosan to be accepted as a dietary supplement and a food additive in many countries (Casariego et al., 2008).
In agriculture, chitosan is effective in plant productivity, protection against the pathogens and extending shelf life of fruit and vegetables (Casariego et al., 2008). The mechanism of antifungal and antibacterial properties of chitosan comes from its cationic characteristic interacting with bacterial cell wall, cell membrane and cytoplasm through electrostatic interactions (Duan et al., 2019).
Chitosan has been applied as biomaterials due to its biocompatible and non- toxic characteristics after the biodegradation. Moon and Lim (2020) reported the possibilities of chitin and chitosan as dental products such as toothpastes and mouthwashes to prevent dental caries based on their antibacterial properties.
When chitosan is used as edible coating material for fruits and vegetables, it can form semi-permeable coating for perishable products (Shahidi et al., 1999) and carry food ingredients such as antimicrobials, texture enhancers and
nutraceuticals to obtain better quality and functionality (Duan et al., 2019).
3. Adhesion of foreign matters to food surfaces
Adhesion can be defined as molecular interactions at the interface between different materials (Marshall, 2010). Food surface as an adherend and the foreign matter as an adhesive make the interface. Adhesion in food industry, mechanical interlocking and wettability are mainly used (Michalski, 1997).
On the food surfaces, whether it is intended or not, many foreign matters can be attached such as particulate matter, chemical products (pesticides, fungicide, detergent, coating solution, etc.) and microorganisms and the retention or detachment of foreign matter may have a broad range of affects to related activities including processing, storage and consumption.
During cultivation plants surface can be contaminated by particulate matter adhesion, then enter to gastrointestinal system in human body. Some studies were conducted to investigate the particulate matter adhesion on some fruits and leafy vegetables (Jia et al., 2018; Noh et al., 2019; Przybysz et al., 2020;
Rai, 2016)
Plant cultivation requires the use of agrochemical aiming at crop yield increase and protection from pests. To obtain the efficacy in application, adjustment of formula has to be considered depending on the wettability of targeted plant, because the adherence, rebound and retention of sprayed droplet is affected by the leaf surface wettability (Gao et al., 2020; Nairn et al., 2011;
Puente and Baur., 2011; Wu et al., 2020)
3.1. Thermodynamic influence
Adhesion is attributable to electrodynamic intermolecular forces existing at
the interfaces (liquid-liquid, liquid-solid and solid-solid) and the interfacial attraction between the adhesive and adherend can be expressed in terms of reversible work of adhesion which is equivalent to material surface tension.
Zisman introduced the concept of critical surface tension of solid surface (Gindl et al., 2001) and there are concepts based on surface free energy components, Owen, Wendt, Rabel, and Kaelble method describes that the surface energy is sum of polar and dispersive component (Gao et al., 2018) and van Oss et al.
(1988) used Lifshitz-van der Waals, Lewis acid and Lewis base components in adhesion process.
4. Research significance
Food surface is the most outer part of a food where many interactions occurs and its properties such as wettability and the roughness play an important role on the interactions of food surface and foreign matters.
Whether it is intended or not, many foreign matters can be attached on the food surfaces such as particulate matter, chemical products (pesticides, fungicide, detergent, coating solution, etc.) and microorganisms and the retention or detachment of foreign matter may have a broad range of affects to related activities including processing, storage, and consumption.
A research showed that the roughness parameters of tiles for agri-food buildings and cleanability of wheat flour residue are not related directly but have linear combination with the selected roughness parameters (Rz, Rt and Mr2), so the residues size is necessary to be considered.
Residue removal on the surface is related to physico-chemical properties (Barreca et al., 2017).
Researches on particulate matter impacts on human health are mostly focused on cardiovascular and respiratory systems, and there are a few studies on the particulate matter impact on gastrointestinal tract. To the best of our knowledge, no studies are done to figure out what effects can have food surface properties on the particulate matter.
Though there are some reported evidences suggesting that particulate matter can be entered to the gastrointestinal tract by intaking contaminated food, and those PM can have adverse effects such as altering gut microbiota and immune function and development of gastrointestinal inflammatory diseases (Salim et al., 2014), study on the potential interaction particulate matters with food surface are still in its early stage.
Chitosan is one of edible coating material, an example of intended application of foreign matters, as a protective package material for fresh food having multiple advantages such as nontoxic, biocompatible, biodegradable and fungicidal properties and ability to elicit plant defense responses (Ali et al.
2011 and 2012; Lin and Zhao 2007; Maqbool et al. 2010).
The significance of the work presented could lead to identifying the food surface properties and how these properties are related to the foreign matter adhesion. Understanding the effects of food surface properties could provide better guidelines to ensure food safety related to contamination of particulate matter, a potential risk to human health, and efficient use of resources to prevent any waste or product loss.
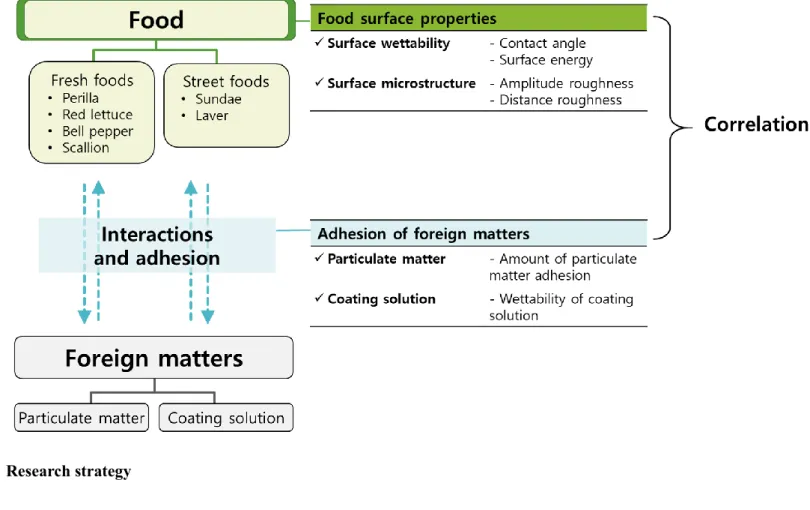
Fig. 1.3. Research strategy
5. Overall objectives
The study aimed to investigate the surface properties of six populmar food products, including perilla, scallion, bell pepper, red lettuce, sundae and laver and examine the effects of the surface properties on the adhesion of foreign matters, including PM and chitosan solutions.
In the first part in Chapter 2, food surfaces properties were characterized by analyzing their surface free energy (SFE) and roughness. For SFE, OWRK (Owens, Wendt, Rabel, and Kaelble) and Zisman methods were used by measuring static contact angles of six liquids (water, diiodomethane, 2- propanol, ethylene glycol, formamide and glycerol) on the food surfaces. For the surface roughness, profile and areal roughness parameters were measured using confocal laser scanning microscopy (CLSM).
In the second part in Chapter 3, the effects of the surface properties of the foods on the adhesion of PM and chitosan solution were analyzed. The chitosan solution was selected as an edible coating model. The adhesion of PM and chitosan solution to the food surfaces were determined by the amount of adsorbed PM on the food surface and the wettability of coating solution, respectively, followed by statistical analysis to correlate the adhesion and the food surface properties. The Fig. 1.3. shows the research strategy.
Chapter 2
Determination of food surface properties 1. Introduction
Food surface is the outmost layer of food exposed to atmosphere and plays an important role when interact with foreign matters such as rain drops, microbial contaminants, chemical contaminants, air pollutants and etc (Ashokkumar et al., 2012; Fernandes et al., 2014; Gao et al., 2020; Noh et al., 2019; Przybysz et al., 2020). And the adhesion of these foreign matters are affected by various food surface properties and no matter what it was intended or not, these foreign matters can adhere to the food surfaces and may have affects to related activities including processing, storage, and consumption (Duan et al., 2019; Jia et al., 2018; Nairn et al., 2011; Noh et al., 2019;
Przybysz et al., 2020; Puente and Baur, 2011; Rai, 2016). Food surface wettability and microstructure can be the main factors to affect the adhesion phenomena (Huhtamäki et al, 2018; Plumier et al., 2019; Wang et al., 2009).
A good wettability is that strong affinity appears between liquid and solid and tends to adhere to each other (Michalski et al., 1997). There has been many studies on the effect of plant leaf surface or food contact surface microstructures on foreign matter adsorption such as microbial adhesion, particulate matter and uneven surfaces, crevices, or pores may hide the microorganisms (Chen et al., 2017; De-la-Pinta et al., 2019; Wang et al., 2009).
It is necessary to understand the food surface properties, to ensure the food safety related to contamination or an efficient use of resources.
In this chapter, it was aimed to investigate the surface wettability and microstructure of six popular food products (perilla, scallion, bell pepper, red
lettuce, sundae and laver) by analyzing their surface free energy (SFE) and roughness.
2. Materials and methods 2.1 Materials
2.1.1 Fresh produce
Four fresh produce items, perilla (Perilla frutescens Britton), Scallion (Allium fistulosum L.), red lettuce (Lactuca sativa L.), bell pepper (Capsicum annum L.), are obtained from local stores. Fresh produces are stored in refrigerator (4°C) until the experiment. Before experiments, they were rinsed with running tap water then distilled water to remove soil. Measurements were done for the clean surfaces without any visible damage. Remaining water on the surface are removed by using kimwipes gently tapping the surface not to be damaged (Fogg, 1947).
2.1.2 Processed foods
Two processed foods, sundae (traditional Korean blood sausage) is purchased from Jinsung Food (Eumseong, Korea), dried laver (Porphyra sp.) from Sung Gyung Food Co., Ltd. (Daejeon, Korea) is purchased from local store and gimbap was purchased from local restaurants. Sundae is a ready-to- eat food and generally prepared by steaming porcine intestines stuffed with varius ingredients including minced pork, starch noodles, pork blood, and vegetables (Kim et al., 2021). Bulk packaged sundae was cut and divided into vinyl bags (18×28 cm) and vacuum sealed to be stored in refrigerator until the experiment. Before the experiment, sundae was cooked by boiling in
vacuum sealed bags for at least 15 min then bags were opened and cooled with single-use plastic bag (high density polyethylene bag) covered for at least 1 h in contact angle measurement room. The measurements were done for the outer part of casing which is porcine small intestines. Gimbap is a popular food in korea, usually contains cooked white rice and other ingredients and rolled up with dried laver sheets and it is seasoned (brushed) with sesame oils (Kim et al., 2015; Mouritsen et al., 2018). Dried laver was stored in room temperature with silica gel and gimbap was used on the same day of purchase.
2.1.3 Liquids for wettability measurement
Six liquids with known surface tension components (polar and dispersive components) are used for contact angle measurement and the surface energy of solid calculation: deionized water, diiodomethane (99%, Alfa Aesar, Ward Hill, MA, USA), ethylene glycol (99.5% Junsei Chemical Co., Ltd, Tokyo, Japan), formamide (99%, Daejung chemicals & metals Co., Ltd, Siheung, Korea), glycerol (99.5%, FUJIFILM Wako Pure Chemical Corporation, Osaka, Japan) and 2-propanol (99.9%, FUJIFILM Wako Pure Chemical Corporation, Osaka, Japan). Their surface tension information (Correia et al., 1997; Janczuk and Białlopiotrowicz, 1989; Janczuk et al., 1993) and the volume quantity used for the contact angle measurements using a microliter pipette are described in Table 2.1.
Table. 2.1. Surface tension parameters (mN/m) of six liquids used for experiments (Correia et al., 1997; Janczuk and Białlopiotrowicz, 1989;
Janczuk et al., 1993) Surface
tension 𝜸𝒍 (mN/m)
Dispersive component 𝜸𝒍𝒅 (mN/m)
Polar component 𝜸𝒍𝒑 (mN/m)
Volume for 6 mg
(μl)
Water (W) 72.8 21.8 51.0 6.00
2-propanol (2P) 23.0 19.5 3.5 7.64
Diiodomethane
(DM) 50.8 50.42 0.38 1.80
Ethylene glycol
(EG) 48.2 31.52 16.68 5.38
Formamide (F) 57.3 28 29.3 5.29
Glycerol (G) 63.3 33.6 29.7 4.76
2.2 Contact angle measurement
Static contact angle measurement was performed according to Mostafavi (2019), Gao et al. (2018) and Zhao & Jiang (2018) with some modifications.
Contact angle data was obtained by contact angle goniometer (Phoenix- MT(M), Surface Electro Optics, Suwon, Korea), and captured image was analyzed by software (Surfaceware, Surface Electro Optics, Suwon, Korea).
Static contact angle (𝜃) of the manually deposited droplet on the food surface using a microliter pipette, 6 mg of liquid drops (5 to 45 droplets) were deposited on the different food surfaces. Measurements were performed at 20°C and relative humidity 40% in a temperature- and humidity-controlled room. To control the room temperature and humidity condition, room ventilation system, humidifier (DP 9000 UH, Zhongshan Xinhao Electric Co.
Ltd, Guangdong, China), and dehumidifier (DNDE100-13021, Winix, Siheung, Korea) were set and refrigerating bath (RW-2025G, Jeio Tech Co., Ltd, Daejeon, Korea) for temperature control was connected to sample stage of the goniometer. A time series of image for droplet deposition was captured during 30 seconds at 1 image per sec. Reported contact angles (𝜃) are the average of the values obtained for the droplets which were placed on different positions on the food surfaces. The 𝜃 of any droplet not showing circular shape distorted by hairs or venation were discarded when analysis. Samples were cut into strip shape (about 2.5 × 0.5 cm) using blade and fixed with double sided adhesive tape on a glass slide. Droplet was deposited on the flat surface avoiding the venation or trichomes of leaves. The 𝜃 was obtained from the first image after the deposition, and equilibrium state of a droplet. In case of the 𝜃 value keeps changing or spreading on the surface, last captured image was used to calculate the 𝜃.
2.3 Calculation of surface free energy of solid 2.3.1 Zisman method
Zisman method allows to calculate the critical surface tension (𝛾c ) of a liquid that form a perfect wetting, 0° of 𝜃 on the food surface (Mostafavi, 2019). This γc is explained as surface free energy of solid surface, but this method is applicable for low energy systems having lower than 100 mN/m surface free energy (Zisman, 1964). The 𝛾c of a solid surface can be calculated with at least 2 liquids with known surface tension. The cosine of the measured contact angle from different liquid droplets are plotted against the liquid surface tension (𝛾LG) and the 𝛾c is estimated by extrapolation to cos 𝜃 = 1 (𝜃 = 0°). This method can only be applied to solid surface with
dispersive component (Owen, 1969).
2.3.2 OWRK method
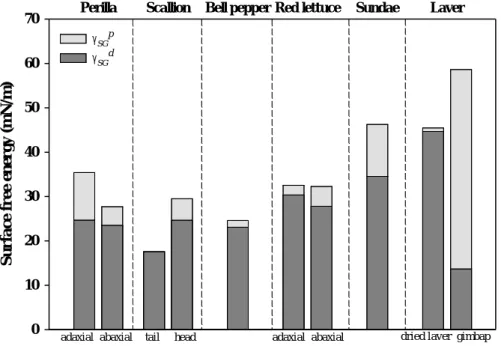
The Owens-Wendt-Rabel-Kaelble (OWRK) method assumes that the surface free energy of solid (𝛾SG ) is composed of two components, polar component (𝛾SG𝑝 ) and dispersive component (𝛾SG𝑑 ). At least 2 liquids with known values of polar and dispersive components are used to calculation. In this experiment, six liquids are selected as Table. 2.1. and data from five liquids are recorded to solve Eq. (1)
(1+cos 𝜃)𝛾LG 2√𝛾LG𝑑
= √𝛾SG𝑝 ∙ √𝛾LG
𝑝
𝛾LG𝑑 + √𝛾SG𝑑 (1)
where 𝛾𝐿𝐺 is surface tension of liquid, 𝛾𝐿𝐺𝑑 is dispersive component of
liquid surface tension, 𝛾LG𝑝 is polar component of liquid surface tension, 𝛾SG𝑑 is dispersive component of solid surface free energy and 𝛾SG𝑝 = polar component of solid surface free energy.
2.4 Roughness
Surface roughness was evaluated by using confocal laser scanning microscopy (LEXT OLS3100, Olympus Corporation, Tokyo, Japan) at magnification 10X. Samples were cut into strip shape using blade and fixed with double sided adhesive tape on a glass slide. Obtained image (1280 x 960 μm) was analyzed with the software LEXT (Olympus Corporation, Tokyo, Japan) and at least 3 images are taken for the roughness measurement. 7 roughness parameters were selected for amplitude and distance information.
Amplitude parameters are divided in profile and areal parameters which are known as two-dimensional and three-dimensional roughness respectively, height of arithmetical mean height (Ra and Sa), root mean square height (Rq and Sq), maximum height (Rz and Sz). Distance parameter is mean width of profile elements (RSm) composed of peak and valley. The equations of these 7 parameters are described in the Table. 2.2. To analyze the profile parameters (Ra, Rq, Rz and RSm), 3 vertical lines and 3 horizontal lines are selected from each image, and to analyze the areal parameters (Sa, Sq and Sz), 5 squared areas (200 x 200 μm) were selected.
Table. 2.2. Profile and areal roughness parameters evaluated.
Evaluation
target parameter equation Reference
Profile length Ra arithmetical mean deviation of the profile
𝑅𝑎 = 1
𝑙∫ |𝑍(𝑥)|𝑑𝑥
𝑙 0
KS B ISO4287 (2019)
ISO 4287:1997 Rq Root mean square deviation of the assessed
profile 𝑅𝑞 = √1
𝑙∫ 𝑍2(𝑥)𝑑𝑥
𝑙
0
Rz Maximum heigh of profile 𝑅𝑧 = 𝑅𝑝 + 𝑅𝑣
RSm Mean width of the profile elements
𝑅𝑆𝑚 = 1 𝑚∑ 𝑋𝑠𝑖
𝑚
Area Sa Arithmetical mean height of scale limited 𝑖=1
surface 𝑆𝑎 =1
𝐴∬|𝑍(𝑥, 𝑦)|𝑑𝑥𝑑𝑦
𝐴
KS B ISO25178-2 (2017)
Sq Root mean square height of scale-limited surface
𝑆𝑞 = √1
𝐴∬ 𝑍2(𝑥, 𝑦)𝑑𝑥𝑑𝑦
𝐴
Sz Maximum height of scale-limited surface 𝑆𝑧 = 𝑆𝑝 + 𝑆𝑣
2.5 Statistical analysis
Measured data were analyzed using SPSS 26.0 (IBM, Chicago, IL, USA).
Mean differences were compared using ANOVA (one-way analysis of variance) and multiple comparison was conducted using Scheffe’s test. P <
0.05 was considered as statistically significant. To analyze the roughness parameters, the variables were compared using nonparametric Kruskal-Wallis one-way analysis of variance with stepwise step-down post hoc test as the data didn’t meet the ANOVA assumption of normality.
3. Results and discussions 3.1 Contact angle
Contact angle of 6 test liquids are measured as shown in Table. 2.3. It turned out that 2-propanol was not an appropriate liquid for measuring contact angle on the food surface because it spread after the deposition therefore contact angle detection was not possible. Similar result was found in the contact angle measurement on the broccoli leaf surface (Rich and Boaz, 2018). Among the tested samples scallion was the least wettable surface for all test liquids showing highest contact angles. Gimbap has only a few data compared to other samples because it was difficult to measure the contact angles as the surface was wet by moisture from the inner ingredients and sesame oils on the surface. Fresh materials tend to have higher contact angle than the processed food except dried laver. Dried laver showed higher contact angle than other two processed food. It may be due to the sundae and gimbap are the cooked surfaces containing high moisture contents from the inner ingredients.
Diiodomethane and formamide showed low contact angle on the food surface
Table. 2.3. Contact angle (CA) at equilibrium and time for equilibrium (EQT) from the deposition
PR = perilla; SC = Scallion; BP = bell pepper; RL=red lettuce; SD = sundae; LV = laver; ad = adaxial; ab = abaxial; DL = dried laver; GB = gimbap N/A = not applicable
Number of droplets deposited on the surface is 45 except ethylene glycol (44) and Glycerol (44) on adaxial side of perilla, ethylene glycol (30) and formamide (30) on abaxial side of red lettuce, ethylene glycol (41) and formamide (40) on sundae, water (29), diiodomethane (32), ethylene glycol (31) and formamide (26) on dried laver and water (5), diiodomethane (1), ethylene glycol (5) and glycerol (3) on gimbap.
water diiodomethane ethylene glycol formamide glycerol 2-propanol
CA EQT (s) CA EQT (s) CA EQT (s) CA EQT (s) CA EQT (s) CA EQT (s)
PR ad 114.90 ± 7.38 2.89 ± 1.32 75.45 ± 7.02 1.84 ± 0.77 92.33 ± 8.62 7.29 ± 5.70 103.83 ± 11.23 4.29 ± 5.24 110.21 ± 9.93 6.84 ± 6.30 N/A ab 81.13 ± 9.42 7.09 ± 5.36 54.17 ± 4.45 2.20 ± 1.18 60.96 ± 5.21 9.89 ± 5.26 69.45 ± 5.05 12.84 ± 10.81 84.09 ± 4.68 14.44 ± 7.43 N/A SC tail 70.64 ± 12.32 8.51 ± 5.92 51.86 ± 7.48 2.67 ± 1.69 58.25 ± 9.60 13.86 ± 4.68 44.98 ± 19.13 11.38 ± 7.71 70.14 ± 12.26 17.34 ± 8.65 N/A head 84.01 ± 10.72 6.22 ± 4.93 55.49 ± 4.76 2.22 ± 1.33 66.24 ± 12.70 5.96 ± 4.42 67.00 ± 7.01 5.44 ± 5.68 90.33 ± 8.75 9.24 ± 6.76 N/A BP 95.62 ± 4.24 6.00 ± 3.55 62.88 ± 4.23 2.33 ± 1.41 73.26 ± 5.40 8.24 ± 5.57 81.31 ± 4.98 6.87 ± 6.04 90.57 ± 4.20 8.91 ± 4.76 N/A RL ad 91.04 ± 7.97 5.93 ± 5.12 53.01 ± 6.40 4.33 ± 5.31 64.1 ± 8.07 9.76 ± 5.38 66.98 ± 11.32 16.00 ± 9.03 74.32 ± 7.20 14.89 ± 7.70 N/A ab 84.29 ± 9.48 7.22 ± 4.29 54.61 ± 6.35 2.91 ± 2.46 63.02 ± 8.21 9.87 ± 4.85 59.86 ± 10.49 12.73 ± 7.07 73.32 ± 9.75 16.47 ± 8.35 N/A SD 59.86 ± 18.39 18.89 ± 8.68 30.76 ± 7.97 9.02 ± 4.44 38.87 ± 8.09 27.20 ± 4.04 44.74 ± 7.61 25.70 ± 6.02 47.90 ± 7.50 25.60 ± 4.88 N/A LV DL 94.62 ± 11.42 4.14 ± 3.98 41.01 ± 4.11 1.78 ± 0.94 40.33 ± 3.54 5.52 ± 2.61 49.14 ± 6.45 4.73 ± 4.12 - - N/A GB 29.48 ± 5.82 28.80 ± 0.45 17.95 9.00 28.27 ± 2.62 22.80 ± 3.56 - - 49.21 ± 10.40 20.67 ± 3.51 N/A
3.2 Wettability
3.2.1 Zisman method
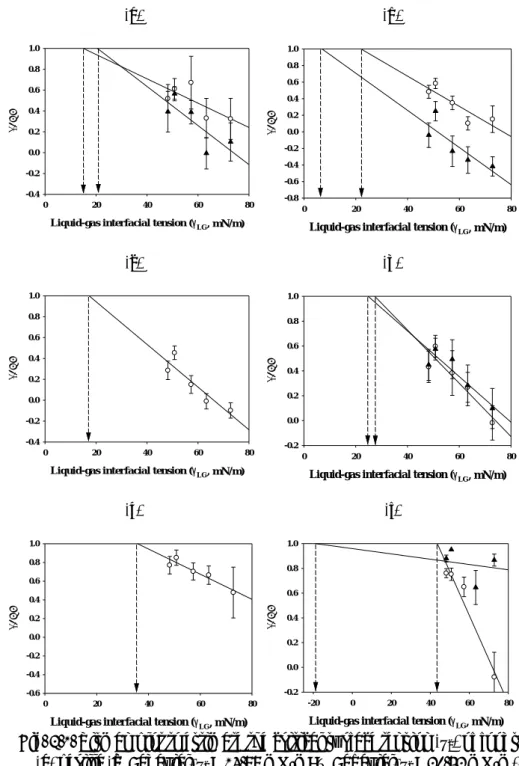
Zisman method was used to estimate the critical surface tension (γc) of six foods surfaces. In the Fig. 2.1., cosine values of contact angles of test liquids are plotted as function of the surface tension of liquid used. The extrapolation to the cosθ = 1 from measured values are expressed in the graph. When cosθ
= 1, the surface tension of the liquid that can wet completely the surface is shown. laver had the highest critical surface tension (γc = 43.63 mN/m) among the tested foods, followed by sundae (γc = 35.81 mN/m) and the scallion had the lowest critical surface tension (γc = 6.93 mN/m), indicating that scallion is a surface difficult to be wet and laver and sundae are easy to be wet. Gimbap showed negative value (γc = -19.02 mN/m) this is because Zisman method counts only dispersive component of the solid surface and the polar components are not considered on the solid-liquid interface interaction, therefore, the calculated critical surface tension need to be interpreted carefully because the food surfaces including the plant surfaces have the polar component of surface energy.
Fig. 2.1. Zisman plot to estimate the critical surface tension (γc) of foods.
(a) perilla (○: adaxial, γc = 14.99 mN/m; ▲: abaxial, γc = 20.52 mN/m), (b) scallion (○: tail, γc = 6.93 mN/m; ▲: head, γc = 21.98 mN/m), (c) bell pepper (γc = 17.25 mN/m), (d) red lettuce (○: adaxial, γc = 27.37 mN/m; ▲: abaxial, γc = 24.80 mN/m), (e) sundae (γc = 35.81 mN/m), (f) laver (○: dried laver, γ = 43.63 mN/m, ▲: gimbap, γ = -19.02 mN/m)