저작자표시-비영리-변경금지 2.0 대한민국 이용자는 아래의 조건을 따르는 경우에 한하여 자유롭게
l 이 저작물을 복제, 배포, 전송, 전시, 공연 및 방송할 수 있습니다. 다음과 같은 조건을 따라야 합니다:
l 귀하는, 이 저작물의 재이용이나 배포의 경우, 이 저작물에 적용된 이용허락조건 을 명확하게 나타내어야 합니다.
l 저작권자로부터 별도의 허가를 받으면 이러한 조건들은 적용되지 않습니다.
저작권법에 따른 이용자의 권리는 위의 내용에 의하여 영향을 받지 않습니다. 이것은 이용허락규약(Legal Code)을 이해하기 쉽게 요약한 것입니다.
Disclaimer
저작자표시. 귀하는 원저작자를 표시하여야 합니다.
비영리. 귀하는 이 저작물을 영리 목적으로 이용할 수 없습니다.
변경금지. 귀하는 이 저작물을 개작, 변형 또는 가공할 수 없습니다.
M.S. DISSERTATION
Development of Korean Design Spectrum Based on the Domestic
and Overseas Intra-plate Earthquake Records
by Taemin Heo
February 2018
Department of Civil and Environmental Engineering
College of Engineering
Abstract
Development of Korean Design Spectrum Based on the Domestic
and Overseas Intra-plate Earthquake Records
Taemin Heo Department of Civil and Environmental Engineering College of Engineering Seoul National University
In this study, the standard design spectrum for Korea, which is known to belong to an intra-plate region, is developed from the ground motion records of the earthquakes occurred in domestic and overseas intra-plate regions. The horizontal spectrum is defined as GMRotI50. From the statistical analysis of the GMRotI50 and the vertical response spectra, a mean plus one standard deviation spectrum in lognormal distribution is obtained. Regression analysis
The developed design spectrum is valid for the estimation both spectral acceleration and displacement. The ratio of vertical to horizontal response spectrum for each record is calculated. Statistical analysis of the ratios rendered the vertical to horizontal ratio ( ⁄ ratio). Subsequently the ratio between the peak vertical ground acceleration to the horizontal one is obtained.
On September 12, 2016, Gyeongju earthquake and November 15, 2017, Pohang earthquake occurred. Its local magnitude was announced to be 5.8 and 5.4, respectively. Ground motion data recorded at KMA, EMC, KERC stations was obtained from the database of them. Applying the same procedure, horizontal and vertical response spectra, and ⁄ ratio were calculated.
These results were compared with the standard design spectra, which were newly developed in this study. The response spectra of Gyeongju and Pohang earthquakes were found to be almost identical with the newly proposed design spectra. Even the ⁄ ratios showed proper agreement.
These results confirmed that the method adopted when developing the standard design spectra were valid and the developed design spectra were reliable.
Keywords: Standard design spectrum, Intra-plate earthquake,
motion, Gyeongju earthquake, Pohang earthquake Student Number: 2016-21279
Taemin Heo
Contents
1. Introduction ...14
2. List of the Earthquake Records...18
2.1. Domestic and Overseas Intra-plate Records... 18
2.2. Gyeongju Earthquake Records ... 26
2.3. Pohang Earthquake Records... 30
3. Analysis Methods and Procedures...33
3.1. GMRotI50... 33
3.2. V/H Ratio ... 37
3.3. Statistical Analysis Methods... 38
4. Analysis Results ...44
4.1. Horizontal Standard Design Spectrum... 44
4.2. Vertical Standard Design Spectrum ... 49
4.3. V/H Ratio ... 55
5. Discussion...58
5.1. Comparison with Overseas Seismic Design Code... 58
5.1.1. Horizontal Standard Design Spectrum...58
5.2. Comparison with Current Korean Seismic Design Code... 64
5.2.1. Horizontal Standard Design Spectrum...64
5.2.2. Vertical Standard Design Spectrum ...66
5.2.3. Long-period Transition Period ...68
5.3. Comparison with Recent Korean Earthquakes ... 70
5.3.1. Horizontal Standard Design Spectrum...70
5.3.2. Vertical Standard Design Spectrum ...72
5.4. Comparison with Horizontal and Vertical Spectrum ... 74
6. Conclusion ...79
7. References ...81
List of Tables
Table 2.1 List of domestic earthquake records ... 19
Table 2.2 List of overseas intra-plate earthquake records ... 21
Table 2.3 List of Gyeongju earthquake records (KMA)... 27
Table 2.4 List of Gyeongju earthquake records (EMC, KERC) ... 28
Table 2.5 List of Pohang earthquake records (KMA) ... 31
Table 5.1 Comparison of amplification factors ... 59
Table 5.2 Comparison of parameters of newly developed horizontal design spectrum with those of design spectra for various overseas intra- plate region... 60
Table 5.3 Comparison of the ℎ ratios ... 62
Table 5.4 Comparison of parameters of newly developed vertical design spectrum with those of design spectra for various overseas intra- plate region... 63
Table 5.5 Comparison of parameters of newly developed horizontal design
spectrum with those of the design spectra for 1997 design code 65
spectrum with those of the design spectra for 1997 design code 67
Table 5.7 Amplification factors and transition periods of Gyeongju and
Pohang horizontal spectrum with the newly developed
horizontal design spectra and one for 1997 design code... 71
Table 5.8 Amplification factors and transition periods of Gyeongju and
Pohang vertical spectrum with the newly developed vertical
design spectra and one for 1997 design code ... 73
Table 5.9 Comparison of amplification factor and other parameters ... 75
List of Figure
Figure 2.1 Distribution of domestic earthquake records: Frequency histogram
w.r.t. magnitude... 20
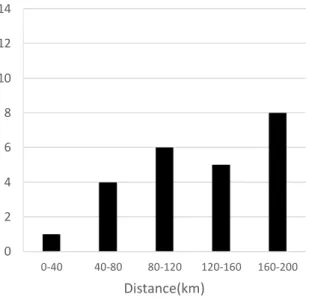
Figure 2.2 Distribution of domestic earthquake records: Frequency histogram
w.r.t. epicenter distance ... 20
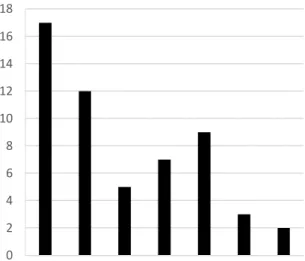
Figure 2.3 Distribution of overseas intra-plate earthquake records: Frequency
histogram w.r.t. magnitude ... 22
Figure 2.4 Distribution of overseas intra-plate earthquake records: Frequency
histogram w.r.t. epicenter distance... 22
Figure 2.5 Regional distribution of overseas intra-plate earthquake records . 24
Figure 2.6 Distribution of domestic and overseas intra-plate earthquake
records: Frequency histogram w.r.t. magnitude... 25
Figure 2.7 Distribution of domestic and overseas intra-plate earthquake
records: Frequency histogram w.r.t. epicenter distance ... 25
Figure 2.8 Distribution of Gyeongju earthquake records w.r.t. epicenter
distance ... 29
distance ... 32
Figure 3.1 Horizontal spectral acceleration plane trace for Nahanni earthquake station 3 record at the period of 1.3s ... 34
Figure 3.2 Comparison for spectrums emphasizing at the period of 1.3s ... 34
Figure 3.3 Rotation angles of GMRotD50 ... 35
Figure 3.4 Rotation angles of GMRotI50... 35
Figure 3.5 The shape of a typical acceleration design spectrum ... 39
Figure 3.6 The shape of a typical displacement design spectrum... 42
Figure 4.1 GMRotI50 spectra: (a) spectra for 55 records ... 45
Figure 4.2 GMRotI50 spectra: (b) mean and mean+1.0σspectra... 45
Figure 4.3 GMRotI50 cross validation results: (a) mean spectrum ... 46
Figure 4.4 GMRotI50 cross validation results: (b) mean+1.0σspectrum .... 46
Figure 4.5 GMRotI50 displacement design spectra and their parameters: (a) mean spectrum... 47
Figure 4.6 GMRotI50 displacement design spectra and their parameters: (b) mean+1.0σspectrum... 47
mean spectrum... 48
Figure 4.8 GMRotI50 acceleration design spectra and their parameters: (b) mean+1.0σspectrum... 48
Figure 4.9 Vertical spectra: (a) spectra for 49 records ... 50
Figure 4.10 Vertical spectra: (b) mean and mean+1.0σspectra ... 50
Figure 4.11 Vertical cross validation results: (a) mean spectrum ... 51
Figure 4.12 Vertical cross validation results: (b) mean+1.0σspectrum ... 51
Figure 4.13 Vertical displacement design spectra and their parameters: (a) mean spectrum... 52
Figure 4.14 Vertical displacement design spectra and their parameters: (b) mean+1.0σspectrum... 52
Figure 4.15 Vertical acceleration design spectra and their parameters: (a) mean spectrum... 53
Figure 4.16 Vertical acceleration design spectra and their parameters: (b) mean+1.0σspectrum... 53
Figure 4.17 ratios of earthquake records both domestic and overseas.... 57
Figure 5.1 Comparison of newly developed horizontal design spectrum with
the design spectra for various overseas intra-plate regions ... 60
Figure 5.2 Comparison of newly developed vertical design spectrum with the
design spectra for various overseas intra-plate regions... 63
Figure 5.3 Comparison of newly developed horizontal design spectrum with
the design spectra for 1997 design code... 65
Figure 5.4 Comparison of newly developed vertical design spectrum with the
design spectra for 1997 design code ... 67
Figure 5.5 Comparison of Gyeongju and Pohang horizontal spectrum with
the newly developed horizontal design spectra and one for 1997
design code... 71
Figure 5.6 Comparison of Gyeongju and Pohang vertical spectrum with the
newly developed vertical design spectra and one for 1997 design
code... 73
Figure 5.7 Comparison between horizontal and vertical design spectra ... 75
Figure 5.8 Comparison of vertical spectrum with horizontal one: Overseas
Figure 5.9 Comparison of vertical spectrum with horizontal one: Domestic
earthquakes... 76
Figure 5.10 Comparison of vertical spectrum with horizontal one for
overseas earthquakes of magnitude less than 6. ... 78
1. Introduction
Response spectrum is the most widely used forms of seismic design load representation. The seismic design code presents the shape of the response spectrum and we called that as a design spectrum. Since the response spectrum varies in shape according to the damping ratio of the SDOF system, the shape of the response spectrum of 5% damping is defined as the standard shape, which is called the standard design spectrum. The design spectrum of the SDOF system with different damping ratios is obtained by multiplying the damping correction factors by the standard design spectrum.
Korea has used the spectrum of horizontal ground motions presented in the Seismic Design Code Research (Ⅱ) report published in 1997 as a design spectrum [1]. If vertical ground motion is to be considered, the horizontal design spectrum should be reduced to 2/3 times and used as a vertical design spectrum [1].
The ground motion at a certain observation point has a horizontal direction component and a vertical direction component. Therefore, in principle, the design spectrum by these two directional components should be considered in seismic design. In the seismic design code of Korea, it is assumed that the spectrum shape of the vertical ground motion is the same as the horizontal spectrum and only the vertical ground acceleration is different.
only the ground acceleration difference but also the spectral shape difference.
The USNRC suggests vertical ground motions to be taken into account in the seismic design of nuclear facilities and a separate vertical design spectrum is proposed [2]. In Eurocode [3] and recently in NEHRP [4], the vertical design spectrum is also presented separately. In view of this global trend, Korea needs to define the vertical design spectrum separately.
In addition, the design spectrum presented in the Seismic Design Code Research (Ⅱ) report is based on the UBC97 proposed shape [1]. In other words, current Korean seismic design spectrum did not reflected the seismic response characteristics of Korea. Moreover, it also did not reflected the long- period transition period added in several recent overseas seismic design.
Therefore, we need to calculate the standard design spectrum in the horizontal direction to reflect the long-period transition period from the actual earthquake records in Korea.
Using earthquake records in Korea to obtain the Korean seismic design load is ideal. However, in Korea, large earthquakes did not occur frequently and earthquake observation time was not long since the modern earthquake observation network is applied. The project of the seismograph network expansion by the Korea Meteorological Administration (KMA) has recently increased the number of earthquake records, but the number of strong ground
of the largest earthquake expected in Korea to be 6.8. Seismic hazard and risk analysis and design spectral derivation in strong ground motion countries are generally based on earthquake records of magnitude 5.0 or greater. In other words, the lower limit of the magnitude of the earthquake to be considered is 5.0 [5]. The reason for this is that the earthquake of magnitude less than 5.0 does not cause significant structural damage [6]. However, when the lower limit of the magnitude is set at 5.0, the number of earthquakes that can be used to obtain the design spectrum is extremely small in Korea. There is a possibility of minor damage caused by an earthquake of magnitude less than 5.0. According to the USGS data, earthquake damage caused by earthquakes under 4.5 is rare. So, in this study, the lower limit of the magnitude was determined to be 4.5. Therefore, in order to obtain the design spectrum of Korea, it is necessary to collect the earthquake records that occurred in Korea with the magnitude of 4.5 to 7.0.
The largest earthquake recorded in Korea by 2014, when this study began, was the Uljin earthquake (2004) of magnitude 5.2. If the only earthquake records in Korea are used, data on earthquakes ranging in magnitude from 5.2 to 7.0 will be missing. Given that earthquakes within this range mainly cause severe damage, it was necessary to use other alternatives to obtain the necessary data. Therefore, in this study, I collected the strong ground motion records of the overseas intra-plate region, where is expected to
spectrum.
To sum up, in this paper, earthquake records of the domestic and overseas intra-plate are collected to improve the drawbacks of the current seismic design code in Korea. The response spectra of the collected seismic records are calculated, and then the distribution of the spectral values is analyzed statistically for each period and the design spectrum according to the reliability level is calculated. The displacement design spectrum was also obtained with the acceleration design spectrum. The results are compared with the Korea and overseas standard design spectrum and compared with the response spectrum of the recent Gyeongju and Pohang earthquake. Chapter 2 introduces the earthquake list used in the study. Chapter 3 describes the analysis methods and procedures, and Chapter 4 summarizes the analysis results. In Chapter 5, the developed standard design spectrum is compared with the Korea and overseas standard design spectrum and recent earthquake response spectrum. Lastly, Chapter 6 contains the conclusions.
2. List of the Earthquake Records
2.1. Domestic and Overseas Intra-plate Records
In the horizontal direction analysis, 55 seismic records from 18 earthquakes observed at 200km or less in epicenter distance were used.
Among them, the domestic earthquake records are 24 records from five earthquakes and the overseas earthquake records are 31 records from 13 earthquakes. Among the records of the overseas earthquake, this study failed to collect vertical records of the six seismic records of PBF of Borah Peak ID- 01, Borah Peak ID-02, Site 2 of Nahanni Canada, GSH of Roermond Netherlands and Bam Iran. Therefore, 49 seismic records were used for vertical analysis.
Table 2.1 shows the records of domestic earthquakes. The histogram of the magnitude and epicenter distance of these earthquake records are shown in Fig. 2.1 and Fig. 2.2, respectively.
Table 2.2 shows the records of overseas earthquakes. Six records that did not have vertical records were shaded. The histogram of the magnitude and epicenter distance of these earthquake records are shown in Fig. 2.3 and Fig.
2.4, respectively.
Table 2.1 List of domestic earthquake records
Name YEAR M/D HR/MN Mw EpiD
(km)
Station name Hong island
Earthquake 2003 0322 2038 4.9 85.44 HUK
164.15 MOP
Offshore Uljin
Earthquake 2004 0529 1914 5.2
199.20 BUS 199.10 CHJ 164.44 DAG 168.22 DGY
Odaesan
Earthquake 2007 0120 2056 4.8
7.52 DGY
144.77 BON 152.31 CEA
69.37 CHC
105.43 CHJ 104.51 CWO 112.72 ICN 162.69 MUS 180.14 PHA 149.48 SEO
68.39 SKC
149.31 SWO
70.07 TBA
56.75 WJU
Offshore Sinan
Earthquake 2013 0420 2321 4.9 187.02 GBI
Seogyeongnyeolbi
island Earthquake 2014 0401 0448 5.1
101.48 GBI 147.00 DEI 116.29 BAR
Figure 2.1 Distribution of domestic earthquake records: Frequency histogram w.r.t. magnitude
Figure 2.2 Distribution of domestic earthquake records: Frequency histogram w.r.t. epicenter distance
0 2 4 6 8 10 12 14 16 18
4.5-5.0 5.0-5.5 5.5-6.0 6.0-6.5 6.5-7.0 7.0-7.5 7.5-8.0
Mw
0 2 4 6 8 10 12 14
0-40 40-80 80-120 120-160 160-200
Distance(km)
Table 2.2 List of overseas intra-plate earthquake records
Location Name YEAR M/D HR/MN Mw EpiD (km)
Station name
America
Borah Peak,
ID-01 1983 1028 1406 6.88
108.10 ANL-768
94.34 PBF
86.15 TRA-642 Borah Peak,
ID-02 1983 1029 2329 5.1 23.20 CEM
50.43 HAU
Nahanni,
Canada 1985 1223 6.76
6.80 Site 1 6.52 Site 2 22.36 Site 3
Saguenay,
Canada 1988 5.9
154.92 Quebec 37.77 Chicoutimi- 62.31 St-Andre- 93.99 Les Denali,
Alaska 2002 1103 7.9 67.70 Carlo (temp)
61.85 R109 (temp)
Mineral, 2011 0823 5.8 53.80 CVVA
Europe Roermond,
Netherlands 1992 0413 0120 5.3
57.67 GSH
82.71 OLF
103.49 WBS
Iran
Gazli, 1976 0517 6.8 12.82 Karakyr
Tabas, Iran 1978 0916 7.35 20.63 Dayhook
55.24 Tabas
Manjil, Iran 1990 0620 7.37 40.43 Abbar
Bam, Iran 2003 6.5 1.00 BAM
Zarand, Iran 2005 0222 0225 6.4
19.66 Chatrood 95.85 Bardsir 94.24 Sirch 53.28 Deh-Loulou 23.62 Qadrooni 22.98 Shirinrood 61.38 Davaran
India Koynanagar, 1967 6.5 10.80 KNI
Figure 2.3 Distribution of overseas intra-plate earthquake records:
Frequency histogram w.r.t. magnitude
Figure 2.4 Distribution of overseas intra-plate earthquake records:
Frequency histogram w.r.t. epicenter distance
0 2 4 6 8 10 12 14 16 18
4.5-5.0 5.0-5.5 5.5-6.0 6.0-6.5 6.5-7.0 7.0-7.5 7.5-8.0
Mw
0 2 4 6 8 10 12 14
0-40 40-80 80-120 120-160 160-200
Distance(km)
The regional distribution of overseas earthquake records is shown in Fig.
2.5. Most of the earthquakes occurred in North America, Europe, Iran and India. It can also be seen that this list does not yet cover the entire intra-plate region of the world.
The distribution of the combined records of domestic and overseas earthquakes is shown in Fig. 2.6 and Fig. 2.7.
Although there are a relatively large number of records close to the magnitude of 5.0, there are a large number of earthquake records larger than 6.0 in magnitude, thus balancing the overall dataset. The distribution is relatively uniform depending on the epicenter distance.
Figure 2.5 Regional distribution of overseas intra-plate earthquake records
Figure 2.6 Distribution of domestic and overseas intra-plate earthquake records: Frequency histogram w.r.t. magnitude
Figure 2.7 Distribution of domestic and overseas intra-plate earthquake
0 2 4 6 8 10 12 14 16 18
4.5-5.0 5.0-5.5 5.5-6.0 6.0-6.5 6.5-7.0 7.0-7.5 7.5-8.0
Mw
0 2 4 6 8 10 12 14 16
0-40 40-80 80-120 120-160 160-200
Distance(km)
2.2. Gyeongju Earthquake Records
This study collected rock site acceleration data of Gyeongju earthquake ( = 5.8) recorded by National Earthquake Comprehensive Information System (NECIS) observation network [7], Earthquake Monitoring Center (EMC) monitoring network [8], Korea Earthquake Research Center (KERC) network [9]. Table 2.3 and Table 2.4 summarize the station name and epicenter distance. The distribution of epicenter distance is shown in Fig. 2.8 as a histogram.
Table 2.3 List of Gyeongju earthquake records (KMA)
Name Date Magnitude EpiD(km) Station
name Note
Gyeongju Earthquake
20160912
20:32 5.8
75.8 ADO2
KMA (Sampling
Rate:
100Hz)
162.0 BAU
152.8 BON
57.4 BUS2
165.0 CHJ2
121.1 CPR2
121.1 CPR
26.5 DAG2
194.8 EMSB
95.1 EURB
163.6 GWYB
133.6 HAMB
165.1 IMWB
172.3 JEO2
116.1 KCH2
116.1 KCH
86.3 MAS2
86.3 MAS
142.2 MGY
166.7 NAWB
141.6 OKCB
50.9 PHA2
193.0 SCH
153.2 TBA
122.7 TOY
106.7 ULJ2
8.8 USN2
8.8 USN
171.3 YOW2
Table 2.4 List of Gyeongju earthquake records (EMC, KERC)
Name Date Magnitude EpiD(km) Station
name Note
Gyeongju Earthquake
20160912
20:32 5.8
48.893 KRN EMC
(Sampling Rate:
100Hz)
147.823 UCN
25.6882 WSN
29.9284 BBK
KERC (Sampling
Rate:
100Hz)
71.0427 CHS
22.0384 DKJ
54.6365 GKP1
119.805 GSU
19.113 HDB
190.014 HKU
153.094 JRB
179.154 JSB
116.519 KJM
115.317 KMC
43.4125 MAK
131.444 MGB
5.62287 MKL
178.414 TJN
33.9857 YSB
Figure 2.8 Distribution of Gyeongju earthquake records w.r.t. epicenter distance
2.3. Pohang Earthquake Records
This study collected rock site acceleration data of Pohang earthquake ( = 5.4) recorded by National Earthquake Comprehensive Information System (NECIS) observation network [7]. Table 2.5 summarize the station name and epicenter distance. The distribution of epicenter distance is shown in Fig. 2.9 as a histogram.
Table 2.5 List of Pohang earthquake records (KMA)
Name Date Magnitude EpiD(km) Station
name Note
Pohang Earthquake
20171115
14:29 5.4
49.2 ADO2
KMA (Sampling
Rate:
100Hz)
195.7 BAU
148.0 BON
189.8 BURB
99.6 BUS2
149.6 CHJ2
125.2 CPR2
57.2 DAG2
185.2 DGY2
182.1 EMSB
131.4 EURB
200.0 GWYB
160.7 HAMB
124.5 IMWB
187.2 JEO2
141.7 KCH2
127.5 MAS2
130.8 MGY2
193.7 NAWB
142.8 OKCB
170.5 OKEB
8.2 PHA2
117.4 TBA2
164.8 TOY2
64.9 ULJ2
51.2 USN2
184.4 WJU2
143.0 YOW2
Figure 2.9 Distribution of Pohang earthquake records w.r.t. epicenter distance
3. Analysis Methods and Procedures
3.1. GMRotI50
Horizontal ground motion at one observation point varies with azimuth angle. Therefore, horizontal ground motion at a single point of observation cannot be defined uniquely. However, the representative ground motion can be defined and it should be done for the actual design.
In this study, the horizontal representative direction was defined to GMRotI50. Let , are two orthogonal horizontal axis, axial spectral acceleration for a period of is ( ), axial acceleration for a period of is ( ). Then, the geometric mean spectrum ( ) is defined as equation (1)
( ) = ( ) ( ) (1)
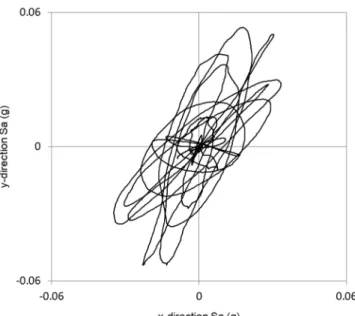
Fig. 3.1 is a plane trace of the spectral acceleration of the two-degree-of- freedom system for a period of 1.3 seconds of horizontal two-direction ground motion acceleration time histories measured at station 3 of the Canadian Nahanni earthquake, one of the earthquakes measured in the intra-plate.
Figure 3.1 Horizontal spectral acceleration plane trace for Nahanni earthquake station 3 record at the period of 1.3s
Figure 3.2 Comparison for spectrums emphasizing at the period of 1.3s
Figure 3.3
Rotation angles of GMRotD50
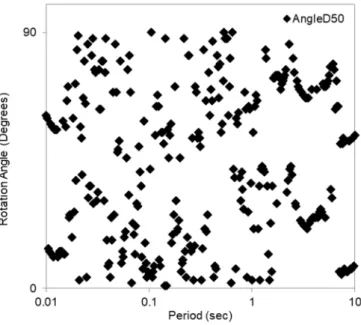
Figure 3.4
Rotation angles of GMRotI50
( ) is changed by rotating the ( , ) coordinate system and is distributed in rotated azimuth angle. The value corresponding to 50%ile of this distribution is taken as GMRotD50. When GMRotD50 is adopted, as Fig.
3.3, the azimuth angle θ at which the geometric mean spectrum is calculated varies according to the period . In order to be physically plausible, it is necessary to select a representative azimuth angle. Therefore, the representative azimuth is selected as the rotated azimuth angle of which geometric mean spectrum has minimum residual with the GMRotD50 according to the period. The selected representative azimuth is shown in Fig.
3.4, and the geometric mean spectrum in that coordination is defined as GMRotI50. The spectrum adopted in this study is GMRotI50 [10]–[12]. Fig.
3.2 compares ( ), ( ), GMRotD50, GMRotI50 of the seismic records shown in Fig. 3.1
3.2. V/H Ratio
The ground motion at a certain observation point has a horizontal direction component and a vertical direction component. To calculate the
⁄ ratio, a horizontal spectrum and a vertical spectrum are needed in the period . The ⁄ ratio is obtained when the vertical spectrum is calculated and then divided by the value of the horizontal spectrum. That is, a curve of one ⁄ ratio is obtained from the record at one observation point. The same calculation is carried out for all earthquake records. As a result, 49 curves are calculated. If we average these 49 curves for each period, we can get an average ⁄ ratio curve. The ⁄ ratio varies depending on the period.
The intensity of the design earthquake is defined as the peak horizontal ground acceleration. Therefore, in order to define the vertical seismic load, the ratio of the peak vertical ground acceleration to the peak horizontal ground acceleration must be given. In this study, the ratio was defined as the ratio of the spectrum, ⁄ ratio, at the period = 0.01 seconds.
3.3. Statistical Analysis Methods
If we obtained the GMRotI50 and vertical spectra of all records according to the procedure described in Section 3.1, we obtained a series of spectral curves. The individual spectral curves have a jagged shape with respect to the period, and in a certain period a series of spectral values has a certain probability distribution. This spectrum value is known to have a lognormal distribution [13]. The properties of the lognormal distribution can be described by the mean and the standard deviation σ. At the desired reliability, the spectrum can be defined as form of the mean + σ. means a multiple of the standard deviation σ and its value can be determined according to the target reliability. For each period, mean + σ spectrum is obtained by connecting the values corresponding to mean + σ. If = 0, the mean spectrum with an exceeding probability of 50% is obtained, and if
= 1, a mean + 1.0σ spectrum with an exceeding probability of about 16%
is obtained. If the value of is determined according to the desired reliability level, the corresponding spectral curve can be obtained. This curve is smoother than the spectrum of individual seismic records, but regression analysis is required for processing into the design spectrum. The acceleration design spectrum adopted in design codes around the world is generally the form of a piecewise continuous function as shown in Fig. 3.5.
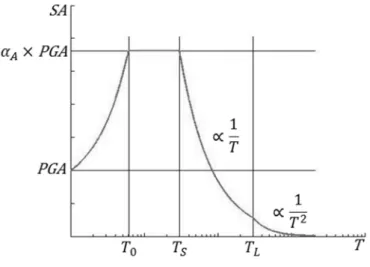
Figure 3.5 The shape of a typical acceleration design spectrum
The design spectrum of Fig. 3.5 is divided into four sections. Each section is divided by a transition periods of , , . The origin indicates
= 0.01 seconds. In this period, the acceleration spectrum is equal to Peak Ground Acceleration (PGA). However, in some earthquake records, the period , where the acceleration spectrum is equal to PGA, may be longer than 0.01 seconds. is the period where the acceleration spectrum begins to be flat, is the transition period of the acceleration-sensitive and velocity-sensitive sections, and is the transition period of the velocity-sensitive and displacement-sensitive sections. In order to determine the shape of the design spectrum, the function form of the curve must be predetermined in each section. The design spectral curve increases linearly in the section from the origin to , it is a constant in the section from to , a curve that decreases in proportion to the 1⁄ in the velocity-sensitive section from to , it is known to have a curved shape decreasing in proportion to 1⁄
in the displacement-sensitive section at and above . Finally, it is necessary to know the amplification factor , the ratio of the PGA to the spectral acceleration in the section where the acceleration design spectrum is flat.
The amplification factor and the transition periods , , can be obtained by regression analysis on the mean + σ acceleration spectrum curve obtained from the statistical analysis. However, the value of the acceleration spectrum becomes small in the long-period domain. Therefore, there is a possibility that is not correctly identified. In the displacement spectrum, however, the change of the curve in the long-period can be more clearly seen. The relationship between the displacement spectrum SD and the acceleration spectrum SA is as follows.
SD( ) = ( )= SA( ) (2)
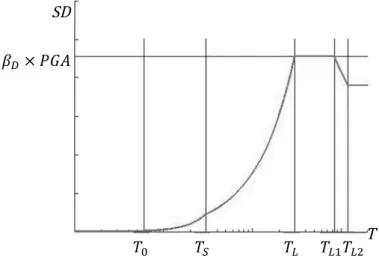
According to this equation (2), SD is linearly increased in proportion to the period in the velocity-sensitive section and constant in the displacement-sensitive section. The typical shape of the displacement spectrum is illustrated in Fig. 3.6. The displacement spectrum tends to converge to a constant value when is kept longer, while maintaining a constant value in the section of ≥ . Let us call these two transition periods , . If the displacement design spectrum is to be presented separately, then the transition periods , also need to be identified.
displacement spectrum.
Figure 3.6 The shape of a typical displacement design spectrum SD
T ×
In this study, , , are identified in the displacement spectrum and the amplification factor and the transition periods , are identified from the acceleration spectrum under the condition that is fixed.
In the regression analysis, the parameters of the objective function were obtained by using the method of minimizing the square root mean square error.
Let a value at ≤ ≤ where the value becomes maximum in the displacement spectrum is × . can be identified in the regression analysis likewise and the displacement design spectrum can be obtained together.
4. Analysis Results
4.1. Horizontal Standard Design Spectrum
GMRotI50 spectra of 55 earthquake records at domestic and overseas intra-plate are shown in Fig. 4.1. The mean, mean + 1.0σ spectra are also shown in the figure. Fig. 4.2 shows these two spectra separately.
The adequacy of the dataset was tested before regression analysis. It is confirmed by Cross Validation method whether a Type 3 error occurs. In 55 earthquake records, 55 samples composed of 54 records except one record were created. The mean, mean + 1.0σ spectra was obtained from each of the 55 samples and the variability was examined. The results are shown in Fig.
4.3 and Fig. 4.4, respectively. It can be seen that the variation from sample to sample is very small. As a result, it has been confirmed that the dataset composed of 55 earthquake records is appropriate.
A regression analysis was performed on the spectra for the two reliability levels to obtain the design spectrum. As described in Section 3.3, , , are identified in the displacement spectrum and the results are shown in Fig. 4.5 and Fig 4.6. = 1.2s, = 0.0095s in the mean spectrum and
= 3s, = 0.046s in the mean + 1.0σ spectrum. was fixed as SA( ) = (4 ⁄ ) ( ) = (4 ⁄ ) × , and regression analysis was performed in the acceleration spectrum. The resulting design spectrum, transition periods, and amplification factor are shown in Fig. 4.7 and Fig. 4.8
Figure 4.1 GMRotI50 spectra: (a) spectra for 55 records
Figure 4.2 GMRotI50 spectra: (b) mean and mean+1.0σ spectra
Figure 4.3 GMRotI50 cross validation results: (a) mean spectrum
Figure 4.4 GMRotI50 cross validation results: (b) mean+1.0σ spectrum
Figure 4.5 GMRotI50 displacement design spectra and their parameters:
(a) mean spectrum
Figure 4.6 GMRotI50 displacement design spectra and their parameters:
(b) mean+1.0σ spectrum
Figure 4.7 GMRotI50 acceleration design spectra and their parameters:
(a) mean spectrum
Figure 4.8 GMRotI50 acceleration design spectra and their parameters:
(b) mean+1.0σ spectrum
4.2. Vertical Standard Design Spectrum
Vertical spectra of 49 earthquake records at domestic and overseas intra-plate are shown in Fig. 4.9. The mean, mean + 1.0σ spectra are also shown in the figure. Fig. 4.10 shows these two spectra separately.
The adequacy of the dataset was also tested before regression analysis. It is confirmed by Cross Validation method whether a Type 3 error occurs. In 49 earthquake records, 49 samples composed of 48 records except one record were created. The mean, mean + 1.0σ was obtained from each of the 49 samples and the variability was examined. The results are shown in Fig. 4.11 and Fig. 4.12, respectively. It can be seen that the variation from sample to sample is very small. As a result, it has been confirmed that the dataset composed of 49 earthquake records is appropriate.
A regression analysis was performed on the spectra for the two reliability levels to obtain the design spectrum. As described in Section 3.3, , , are identified in the displacement spectrum and the results are shown in Fig. 4.13 and Fig. 4.14.
= 1.4s, = 0.0095s in the mean spectrum and = 3s,
= 0.056s in the mean + 1.0σ spectrum. was fixed as SA( ) = (4 ⁄ ) ( ) = (4 ⁄ ) × , and regression analysis was performed in the acceleration spectrum. The resulting design spectrum, transition periods, and amplification factor are shown in Fig. 4.15 and Fig.
Figure 4.9 Vertical spectra: (a) spectra for 49 records
Figure 4.10 Vertical spectra: (b) mean and mean+1.0σ spectra
Figure 4.11 Vertical cross validation results: (a) mean spectrum
Figure 4.12 Vertical cross validation results: (b) mean+1.0σ spectrum
Figure 4.13 Vertical displacement design spectra and their parameters: (a) mean spectrum
Figure 4.14 Vertical displacement design spectra and their parameters: (b) mean+1.0σ spectrum
Figure 4.15 Vertical acceleration design spectra and their parameters: (a) mean spectrum
Figure 4.16 Vertical acceleration design spectra and their parameters: (b) mean+1.0σ spectrum
4.3. V/H Ratio
The value of the vertical spectrum of each seismic record was divided by the GMRotI50 spectrum, and the ratio was calculated for each period. At this time, the damping ratio ξ = 5%.
⁄ ( ) = ( )( ) (3)
Where ( ) is the vertical spectrum in period and ( ) is the horizontal spectrum in the same period. Thus, one curve is obtained for each seismic record, and all 49 curves are obtained. These curves are shown in Fig.
4.17. Fig. 4.18 shows a curve connecting the median values for each period.
The reason for taking the median without taking the mean in the Fig.
4.18 is that ( ) and ( ) follow a lognormal distribution and therefore ⁄ ( ) also follows the lognormal distribution. In the Fig. 4.18, we can see that the median value curve has a very small and almost constant variation over the period . This phenomenon suggests that the shape of the vertical spectrum and the horizontal spectrum will be similar.
In general, the vertical component seismic load is defined by the spectrum normalized at = 1.0g and the ratio ⁄ . This ratio and ⁄ ratio are given by the following equation (4).
= ⁄ (0.01) = ( . )( . ) (4)
Where = 0.01 seconds is assumed. In the Fig. 4.18, the ⁄ ratio at
= 0.01 seconds is ⁄ = 0.77 and the average value until
= 0.3 seconds, which is mainly interested in the design spectrum, is 0.77 too. Therefore, it can be seen that this is a reasonable value over a wide range of periods.
Figure 4.17 ⁄ ratios of earthquake records both domestic and overseas
Figure 4.18 The median value curve of ⁄ ratios
5. Discussion
5.1. Comparison with Overseas Seismic Design Code
5.1.1. Horizontal Standard Design SpectrumTable 5.1 compares the amplification factor with the Newmark and Hall spectrum [14] in the acceleration-sensitive section. As mentioned in Section 3.3, the design standard conservatively adopts the mean + 1.0σ spectrum.
The design spectra obtained in this study were compared with the design spectrum of overseas belonging to the intra-plate region. Fig. 5.1 compares the design spectrum and Table 5.2 compares the amplification factors and transition periods.
In Eurocode 8, two type of the design spectra are presented, depending on the magnitude of the design earthquake. Type 1 design spectra are used for earthquakes with a design earthquake magnitude of 5.5 or greater and Type 2 design spectra are applied when the magnitude is below 5.5 [3].
The mean + 1.0σ spectrum presented in this study is similar to the shape of the Eurocode 8 Type 2 design spectrum in the short-period domain and Eurocode 8 Type 1 design in the long-period domain. Compared with Australian and NEHRP design spectrum, it extends to the short-period domain and shows a similar tendency in the long-period domain. The amplification factor is larger than the value of Eurocode 8 and NEHRP, and is smaller than the Australian code.
Table 5.1
Comparison of amplification factors
Figure 5.1 Comparison of newly developed horizontal design spectrum with the design spectra for various overseas intra-plate regions
Table 5.2 Comparison of parameters of newly developed horizontal design spectrum with those of design spectra for various overseas intra-plate region
5.1.2. Vertical Standard Design Spectrum
The ⁄ ratio values are compared with the values in domestic and overseas design codes in Table 5.3. It is bigger than 2/3 used in Korea until now, but it is smaller than 0.9 in Eurocode 8.
The vertical design spectrum obtained from this study was compared with the USNRC, NEHRP and Eurocode 8 design spectrum belonging to the intra-plate region. The spectra compared in Fig. 5.2 are normalized to the peak horizontal ground acceleration = 1.0g. Table 5.4 compares the amplification factors and the transition periods.
Fig. 5.2 and Table 5.4 show that the Eurocode 8 and NEHRP spectra are amplified in the short-period and the USNRC spectrum is relatively amplified in the long-period. The spectrum presented in this study is developed over a wide range of short-period and long-period. It can be considered conservative in some ways. It can also be seen that the maximum value of the acceleration spectrum is smaller than Eurocode 8 and the USNRC spectrum and larger than the NEHRP spectrum.
Table 5.3 Comparison of the ⁄ ratios
Figure 5.2 Comparison of newly developed vertical design spectrum with the design spectra for various overseas intra-plate regions
Table 5.4 Comparison of parameters of newly developed vertical design spectrum with those of design spectra for various overseas intra-plate region
5.2. Comparison with Current Korean Seismic Design Code
5.2.1. Horizontal Standard Design Spectrum
The horizontal design spectrum presented in this study and the shape of the design spectrum of the Seismic Design Code Research (Ⅱ) are shown in Fig. 5.3, and the amplification factors and the transition periods are compared in Table 5.5.
The spectrum presented in this study shifted to the short-period domain and the amplification ratio increased compared with the spectrum of the Seismic Design Code Research (Ⅱ). That is, the design seismic load of a short-period structure with a period less than 0.34 seconds increased.
However, in the case of a long-period structure in which the period is longer than 0.34 seconds the design seismic load decreased.
In the new spectrum, the long-period transition period , which is the boundary between the velocity and displacement-sensitive sections, is presented. In seismic design of long-period structure, displacement spectrum becomes important design variable. Unless a long-period transition period is specified, an unreasonable result is obtained in which the value of the design displacement is calculated to be unrealistically large. This problem can be solved by adopting the design spectrum newly developed in this study.
Figure 5.3 Comparison of newly developed horizontal design spectrum with the design spectra for 1997 design code
Table 5.5 Comparison of parameters of newly developed horizontal design spectrum with those of the design spectra for 1997 design code
5.2.2. Vertical Standard Design Spectrum
The vertical design spectra presented in this study and the shape of the design spectrum of the Seismic Design Code Research (Ⅱ) are shown in Fig.
5.4, and the amplification factors and the transition periods are compared in Table 5.6.
In the Seismic Design Code Research (Ⅱ), the peak vertical ground acceleration is specified to be 2/3 of the peak horizontal ground acceleration.
The two design spectra were normalized to the peak horizontal ground acceleration = 1.0g.
Fig. 5.4 and Table 5.6 show that the value of the new spectrum is significantly increased in the acceleration-sensitive section compared to the existing spectrum. However, in the velocity-sensitive section, the value is almost the same, and in the displacement-sensitive section, the new spectrum becomes smaller. The vertical component of the support load can be important in long-period structures such as cable-stayed bridges and suspension bridges rather than short-period structures. From this point of view, it can be said that the vertical design spectrum presented in this study is quite reasonable.
Figure 5.4 Comparison of newly developed vertical design spectrum with the design spectra for 1997 design code
Table 5.6 Comparison of parameters of newly developed vertical design spectrum with those of the design spectra for 1997 design code
5.2.3. Long-period Transition Period
The long-period transition period is approximately equal to the corner period identified in the source spectrum. There are several formulas for the relationship between corner period and earthquake magnitude . The corner period obtained from the following equation (5) is known to be in good agreement with the transition period [15].
log ≅ log = −1.25 + 0.3 (5)
If the magnitude of the design earthquake is known, then this formula can be used to approximate . The estimated from the regression analysis of the displacement spectrum is 3 seconds and is calculated from the equation (5), which corresponds to a magnitude of 5.8. However, since obtained from this study is obtained by statistical processing of earthquakes magnitude ranging from 4.5 to 7.9, it is not meaningful to specify the design magnitude.
Table 5.2 compared the transition period given in overseas codes.
= 3 seconds is longer than Europe and Australia. However, in the northeastern United States, which is known to have similar seismic characteristics to Korea, is given in FEMA P-750 [4] for 6 seconds.
Considering these various considerations, it can be assumed that the transition
5.3. Comparison with Recent Korean Earthquakes
5.3.1. Horizontal Standard Design SpectrumThe horizontal spectrum of the Gyeongju earthquake and the Pohang earthquake were compared with the horizontal standard design spectrum newly developed in this study and existing one at the Fig. 5.5 and Table 5.7.
Fig. 5.5 and Table 5.7 show that the response spectrum calculated from the Gyeongju and Pohang earthquake records is shifted to the short-period domain than the standard design spectrum developed in this study and existing one. In addition, the acceleration-sensitive section appears to be more amplified than the newly developed standard design spectrum and existing one. This is because the earthquakes with a magnitude of 5.4 and 5.8 has more short-period component than the mean + 1σ design earthquake of the domestic and overseas intra-plate earthquakes with a magnitude of 4.5 to 7.9, and the long-period component is not sufficiently developed. From this point of view, it can be seen that the newly developed standard design spectrum predict the seismic response characteristics of those two earthquakes better than existing one.
Consequently, the Korean standard design spectrum newly developed in this study well remedied the disadvantage of being too conservative in the long-period domain and non-conservative in the short-period domain of the design spectrum of Korean Seismic Design Code Research (II).
Figure 5.5 Comparison of Gyeongju and Pohang horizontal spectrum with the newly developed horizontal design spectra and one for 1997 design code
Table 5.7 Amplification factors and transition periods of Gyeongju and Pohang horizontal spectrum with the newly developed horizontal design spectra and one for 1997 design code
5.3.2. Vertical Standard Design Spectrum
The vertical spectrum of the Gyeongju earthquake and the Pohang earthquake were compared with the vertical standard design spectrum newly developed in this study and existing one considering ⁄ ratio at the Fig.
5.6 and Table 5.8.
The current Korean standard vertical design spectrum presented in the Seismic Design Code Research (II) is based on the experience rule that applies the same ⁄ (T) = 2/3 in all periodic domain. Thus, the current standard vertical design spectrum is significantly non-conservative in the short-period domain and too conservative in the long-period domain compared to the vertical spectrum of the Gyeongju and Pohang earthquake, in addition to the difference of shape of the horizontal design spectrum. On the other hand, Fig. 5.6 shows that the proposed standard vertical design spectrum supplemented the errors of existing design spectrum.
The standard vertical design spectrum as well as the standard horizontal design spectrum is confirmed from the spectra of the Gyeongju and Pohang earthquakes to show that the design spectrum has been appropriately improved to cover the actual seismic hazard.
Figure 5.6 Comparison of Gyeongju and Pohang vertical spectrum with the newly developed vertical design spectra and one for 1997 design code
Table 5.8 Amplification factors and transition periods of Gyeongju and Pohang vertical spectrum with the newly developed vertical design spectra and one for 1997 design code
5.4. Comparison with Horizontal and Vertical Spectrum
The vertical design spectrum shown in Fig. 4.16 is compared with the shape and major parameters of the horizontal design spectrum shown in Fig.
4.8 in Fig. 5.7 and Table 5.9.
The value of the amplification factor of the vertical spectrum in the acceleration-sensitive section is slightly larger than the amplification factor of the horizontal spectrum. However, the difference is less than 1%. It can be seen that the transition periods has substantially the same value. This suggests that the shape of the horizontal design spectrum can be used as the shape of the vertical design spectrum.
The vertical design spectra of several overseas design code differ from their corresponding horizontal design spectra. However, another conclusion was drawn in this study. In order to investigate the causes, horizontal and vertical spectra obtained by using only domestic earthquake records and using only overseas earthquake records were calculated and compared. Fig. 5.8 shows the spectrum of the overseas earthquakes, and Fig. 5.9 shows the spectrum of the domestic earthquakes.
Figure 5.7 Comparison between horizontal and vertical design spectra Table 5.9 Comparison of amplification factor and other parameters
Figure 5.8 Comparison of vertical spectrum with horizontal one:
Overseas earthquakes
Figure 5.9 Comparison of vertical spectrum with horizontal one:
Domestic earthquakes
Fig. 5.8 clearly shows that the vertical spectrum shifts in a short-period compared to the horizontal spectrum in the case of the overseas earthquakes.
However, Fig. 5.9 shows that in the case of domestic earthquakes, the transition periods of the vertical spectrum is almost the same as the transition periods of the horizontal spectrum and there is no significant difference in the amplification factor. Fig. 5.9 also suggests that the characteristics of domestic earthquakes are different from those of overseas earthquakes.
The other possibility is that the magnitude of the domestic earthquake is about 5.0, while the overseas earthquakes also include the strong ground motions. Fig. 5.10 compares the vertical and horizontal mean + 1.0σ spectra recorded by three overseas earthquakes with a magnitude of less than 6.0.
From Fig. 5.10, we can see that, even in the case of the overseas earthquakes, if the magnitude is small, the transition periods of the vertical spectrum is similar to the transition periods of the horizontal spectrum.
Therefore, it can be understood that the shape of the vertical spectrum is almost equal to the shape of the horizontal spectrum, which is a result largely reflecting the effects of domestic earthquakes and small magnitude overseas earthquakes. These facts show that the shape of the vertical spectrum obtained in this study is reasonable.
Figure 5.10 Comparison of vertical spectrum with horizontal one for overseas earthquakes of magnitude less than 6.
6. Conclusion
The horizontal, vertical standard design spectrum and ⁄ ratio for Korea is developed from the ground motion records of the earthquakes occurred in domestic and overseas intra-plate region. The horizontal spectrum is defined as geometric mean spectrum, GMRotI50. The records of 55 (49 for vertical) domestic and overseas intra-plate earthquakes with a magnitude of 4.5 or greater were analyzed statistically. The number of records was not large, but statistically significant results were obtained.
The developed standard design spectrum is valid for the estimation both spectral acceleration and displacement. Regression analysis is performed on horizontal and vertical mean plus one standard deviation spectrum to determine the transition periods of spectrum. The calculated parameters are same in both horizontal and vertical standard design spectrum as = 2.8,
= 0.06 seconds, = 0.3 seconds, = 3 seconds. The result proposes a long-period transition period to provide a basis for the design load and design displacement to be reasonably determined in the long-period domain.
For the ⁄ ratio, ⁄ = 0.77 was obtained. From these results, horizontal and vertical design spectrum normalized by horizontal peak ground acceleration = 1.0g is presented.
Compared with the overseas standard design spectrum, the newly proposed standard design spectrum is well developed over short-period to
Compared with the design spectra presented in the Seismic Design Code Research ( ), the design spectrum presented in this study increases the Ⅱ design load for short-period structures with shorter period than 0.34 seconds (0.39 seconds for vertical), and for long-period structures with longer period than 0.34 seconds (0.39 seconds for vertical) is reduced. In particular, since the transition period is clearly presented as 3 seconds, the design displacement is expected to decrease significantly in the displacement- sensitive section.
As mentioned in the introduction, the spectrum of the Gyeongju and Pohang earthquakes was compared with the standard design spectrum newly proposed in this study to confirm validity of the result. As a result, the shape of the standard design spectrum well covered the spectrum of Gyeongju and Pohang earthquakes. The standard design spectra were found to be in good agreement with the spectra obtained from the records of Gyeongju and Pohang earthquakes. A comparison of only two earthquakes has not suggested completely the reasonableness of the standard design spectrum. At least, however, it can be argued that the method used to derive the standard design spectrum was reasonable. However, the reliability of the design spectrum needs to be continuously improved. For this purpose, it is necessary to collect records of intra-plate earthquakes, to develop analytical methods, to study deeply the effects of geology and seismic characteristics, and to update the design spectrum continuously.
7. References
[1] EESK KICT, The Seismic Design Code Research ( )Ⅱ. Ministry of Construction and Transportation, 1997.
[2] US Nuclear Regulatory Commission (NRC), Design response spectra for seismic design of nuclear power plants, Regulatory Guide 1.60.
Washington, DC, USA, 2014.
[3] Comité Européen de Normalisation, Eurocode 8: Design of Structures for Earthquake Resistance, Part 1: General Rules. Seismic Actions and Rules for Buildings. Comité Européen de Normalisation, 2004.
[4] BSSC, NEHRP Recommended Seismic Provisions for New Buildings and Other Structures (FEMA P-750). Washington, DC, USA: Federal Emergency Management Agency, 2009.
[5] R. Mcguire, Seismic Hazard and Risk Analysis. Oakland, California, USA: Earthquake Engineering Research Institute, 2004.
[6] Y. Nakamura, “Real-Time Information Systems for Hazard Mitigation,”
in 11th World Conference on Earthquake Engineering, 1996, p. 2134.
[7] KMA, “National Earthquake Comprehensive Information System.”
[Online]. Available: http://necis.kma.go.kr/.
[8] EMC, “Earthquake Monitoring Center.” [Online]. Available:
http://emc.kins.re.kr/.
[9] KERC, “Korea Earthquake Research Center.” [Online]. Available:
http://quake.kigam.re.kr/.
the geometric mean horizontal component of PGA, PGV, PGD and 5%
damped linear elastic response spectra for periods ranging from 0.01 to 10 s,” Earthq. Spectra, vol. 24, no. 1, pp. 139–171, 2008.
[11] D. Boore, J. Watson-Lamprey, and N. Abrahamson, “Orientation- independent measures of ground motion,” Bull. Seismol. Soc. Am., vol.
96, no. 4A, pp. 1502–1511, 2006.
[12] American Society of Civil Engineers, “Minimum Design Loads for Buildings and Other Structures,” in ASCE/SEI 7-10, ASCE, 2010, pp.
207–209.
[13] W. B. Davenport, Probability and Random Processes: An Introduction for Applied Scientists and Engineers. New York: McGraw-Hill, 1970.
[14] N. Newmark and W. Hall, Earthquake Spectra and Design. Oakland, California, USA: Earthquake Engineering Research Institute, 1982.
[15] BSSC, NEHRP Recommended Provisions for Seismic Regulations for New Buildings and Other Structures (FEMA 450) Part 1: Provisions, Part 2: Commentary. Washington, DC, USA: Federal Emergency Management Agency, 2003.
초 록
국내외 판내부 지진기록에 근거하여 우리나라의 표준설계스펙 트럼을 구하였다. 수평스펙트럼은 기하평균스펙트럼(GMRotI50)으로 정의되었다. GMRotI50 스펙트럼과 수직 스펙트럼을 통계 분석하여 대수정규분포에서 Mean plus one standard deviation 스펙트럼을 구하였 다. 이 곡선에 회귀분석을 실시하여 설계스펙트럼의 형상을 결정하 였다. 새롭게 구해진 표준설계스펙트럼은 가속도스펙트럼뿐 만 아니 라 변위스펙트럼에서도 유의하다. 각 기록에서 수직스펙트럼과 수평 스펙트럼의 비도 계산했다. 통계분석을 통해서 ⁄ ratio를 구하였 고 결과적으로 수직방향 최대지반가속도와 수평방향 최대지반가속 도를 얻을 수 있었다.
2016년 9월 12일 경주지진, 2017년 11월 15일 포항지진이 발생
했다. 각각의 지진은 규모 5.8과 5.4를 기록했다. 각 지진의 지반가 속도 기록을 기상청 국가지진종합정보시스템, 한국원자력안전기술원 원전부지 지진감시센터, 한국지질자원연구원 지진연구센터에서 수집 했다. 표준설계스펙트럼을 개발한 방법을 똑같이 적용하여 각 지진 의 수평, 수직 응답스펙트럼과 ⁄ ratio를 계산했다.
이 두 지진의 계산결과를 이 연구에서 새롭게 개발한 표준설계 스펙트럼과 비교하였다. 표준설계스펙트럼은 경주 지진과 포항 지진
인하였다. ⁄ ratio도 유사한 결과를 보였다. 이를 통해서 이 연구 에서 표준설계스펙트럼을 개발하기 위해 사용한 방법의 적합성을 검증했고 표준설계스펙트럼의 신뢰성을 확인했다.
주요어: 표준설계스펙트럼, 판내부 지진, GMRotI50, 수평지반운동, ⁄ ratio, 수직지반운동, 경주 지진, 포항 지진