저작자표시-비영리-변경금지 2.0 대한민국 이용자는 아래의 조건을 따르는 경우에 한하여 자유롭게
l 이 저작물을 복제, 배포, 전송, 전시, 공연 및 방송할 수 있습니다. 다음과 같은 조건을 따라야 합니다:
l 귀하는, 이 저작물의 재이용이나 배포의 경우, 이 저작물에 적용된 이용허락조건 을 명확하게 나타내어야 합니다.
l 저작권자로부터 별도의 허가를 받으면 이러한 조건들은 적용되지 않습니다.
저작권법에 따른 이용자의 권리는 위의 내용에 의하여 영향을 받지 않습니다. 이것은 이용허락규약(Legal Code)을 이해하기 쉽게 요약한 것입니다.
Disclaimer
저작자표시. 귀하는 원저작자를 표시하여야 합니다.
비영리. 귀하는 이 저작물을 영리 목적으로 이용할 수 없습니다.
변경금지. 귀하는 이 저작물을 개작, 변형 또는 가공할 수 없습니다.
Degree of Master of International Studies (International Area Studies)
COMPARATIVE ANALYSIS OF EXPORT PROMOTION OF RWANDA AND
SOUTH KOREA
August, 2019
Graduate School of International Studies Seoul National University
Consolee URUJENI
COMPARATIVE ANALYSIS OF EXPORT PROMOTION OF RWANDA AND
SOUTH KOREA
A thesis presented by
Consolee URUJENI
A dissertation submitted in partial fulfilment of the requirements for the degree of Master of International Studies
Graduate School of International Studies Seoul National University
Seoul, Korea
August, 2019
Thesis advisor: Prof. Kim, Chong- Sup
iii
Abstract
Rwanda is striving to promote export expansion, this thesis show why Korea was chosen, similarities of the two countries, analyses Korea’s situation before and all the process to export expansion strategies adopted and implemented, measures used, also shows Rwanda’s initial start to export, what Rwanda is doing to promote export, what lesson to draw from Korea’s experience of success in export expansion and then recommends. The study reveals that, the key strategy to the Korea’s success in export promotion was the state’s intervention in policy formulating, resource allocation, incentives and subsidy’s allocation, human resource and education, market diversification, firms allocated in exporting and importing sectors with their different incentives at the start of the year and celebrate at the end of the year for achieving the set targets and giving rewards to the best performers.
Key words: Export promotion, Developmental state, Import Substitution, Export Substitution
iv
জԹ
فɁȪՎߌ८ɓΆٷऺǵ̈́ऱÝڦɁ"їǷϬڊɓळЌćêفɁڗՎߌی̭ڋ ҍā ѬԆ ऱÝ ळćڋ ԉࡩळ ڜٿ ćڗ ٿӡۏ Վߌ ८ɓ ی̭ڋ ڜूऱİ ی ळćڗ ӭॲڋ ѬԆळɁ" ˫ळ فɁ Վߌی̭ڋ £չळ չۏ فɁ Վߌڋ
ܦऱİ ٷऺ ϩ؍ڋ ऱÝ ڦȪܤ Վߌ ८ɓ Öॊڜ ळćڗ Öॊؓԅ ƤLj Վ ڦȪܤΆ є؛܆ ی̭ڗ £ԉڋ ٷळ ۔לӡहڋ ۔ӡळɁ" ؞Ć Ñêؓ ˁω ळćڗՎߌܦԒèی̭ڊےѪڗےޏՎΓ ڪ٪ЦѬ ڞԖࣀ҆ЕєۤīЦѬ ڞۋڪ٪ॄӭڋٷळāڀ չڵɁ७ʴڜڦɁ"Ɂ΅ڞԖࣀ҆͐ȪےѪՎߌ Е Վڤ ѪϬؓ ۋषळ İ؋ڋ ЦےऱÝ ΥǬ ϑइΆ ۔չऱئÝ ߀Ýڗ սۋڋ DžϑइΆɆԒळİ؋ʯؓÄєӭڋ۔èऱئɁ""
սΖΎ.Վߌܦ £Нɻӭć Վڤɓަ Վߌɓަ
v
Abbreviations
GDP =Gross Domestic Product
EDPRS II= Economic Development Poverty Reduction Strategy II H.E = His Excellency
ELI =Export Led Industrialization ISI =Import Substitution Industrialization
UNCTAD =United Nations Conference on Trade and Development GATT = General Agreement on Tariffs and Trade
SITC84 = Exports of articles of apparel and clothing accessories KOTRA =Korea Trade Promotion Corporation
KTA =Korea Trade Association
MINICOM = Ministry of Trade and Industry
MINICOFIN=Ministry of Finance and Economic Planning RDB =Rwanda Development Board
SEZs =Special Economic Zones
DMRS = Domestic Market Recapturing Strategy EGF =Export Growth Facility
SME =Small Medium Enterprise
PSDS =Private Sector Development Strategy SNV =Netherlands Development Organization
UNIDO =United Nations Industrial Development Organization USAID =United Nations Agency for International Development EAC =East African Community
vi DRC =Democratic Republic of Congo
US =United States
WTO =World Trade Organization MOU = Memorandum of Understanding KSEZs= Kigali Special Economic Zones SEZ = Special Economic Zone
SOES = State Owned Enterprises
AGOA = African Growth and Opportunity Act GATT = General Agreement on Tariffs and Trade WDA = Work Force Development Authority
vii
Table of contents
Abstract ... ... iii
জԹ ... ... iv
Abbreviations ... ... v
Table of contents ... ... vii
Table of figures ... ... x
List of tables... ... xi
Chapter 1: INTRODUCTION ... 1
1. Introduction ... ... 1
1.1 Research objectives ... 2
1.2 research questions ... 3
1.3 Significance of the study ... 4
1.4 Thesis structure ... 4
1.5 Similarities of two countries ... ... 5
1.6 Rwanda’s economic development ... 8
1.7 Rwanda’s industrial sector ... 9
1.8 Statement of the problem ... 12
1.9 Research methodology ... 13
1.10 Scope and limitations of the study ... 13
CHAPTER 2: LITERATURE REVIEW ... 15
2. Introduction ... ... 15
2.1 Definition of key terms ... 15
2.2 Empirical evidence ... 16
2.3 Import Substitution Strategy ... 18
2.4 Foundational and historical perspectives of export strategy ... 20
2.5 Advantages of export strategy ... 21
2.6 Analytical concept of developmental state ... 22
2.7 Developmental state in east Asia (four Asia tigers) ... 23
2.8 South Korea’s success in export strategy and the role of developmental state ... 23
2.9 Developmental state in Latin America ... 24
2.10 Developmental state in Africa... 25
viii
CHAPTER 3: KOREA IMPORT SUBSTITUTION POLICY ... 27
3. Introduction ... ... 27
3.1 Kickoff of export promotion strategy ... 28
3.2 Expansion and effects of export strategy ... 28
3.3 Export incentives in 1950s-1960s ... 31
3.4 Government support to SMES ... 37
3.5 Korea’s import policy ... 37
3.6 3.6. KOTRA and other institutions ... 39
3.7 Musan special economic zones ... 40
3.7.1 Introduction ... 40
3.7.2 Musan objectives... 40
3.7.3 Link of SEZs performance with domestic economy ... 42
3.7.4 Contributions of SEZs ... 42
3.7.5 Korea’s successful export promotion ... 43
CHAPTER 4: RWANDA EXPORTS ... 46
4. Introduction to Rwanda exports ... 46
4.1 Export composition ... ... 47
4.2 Rationale of Rwanda to promote exports... 48
4.3 Industrial sector ... 49
4.4 Establishment of Rwanda Development Board (RDB) ... 50
4.5 Establishment of Kigali Special Economic Zones (KSEZs) ... 50
4.6 Inception of domestic market recapturing strategy ... 55
4.7 Made in Rwanda campaign ... 56
4.8 Establishment of export growth fund ... 56
4.9 EGF objectives ... 57
4.10 EGF targeted sectors ... 57
CHAPTER 5: COMPARATIVE ANALYSIS OF SOUTH KOREA AND RWANDA IMPORT- EXPORT EXPANSION STRATEGY ... 59
5. Comparison of Korea and Rwanda ... 59
CHAPTER 6: PROPOSED SOLUTION BASED ON KOREAN EXPERIENCE ... 65
6. Introduction ... ... 65
6.1 State intervention ... 65
6.2 Import and export transition ... 67
ix
6.3 Export incentives ... 68
6.4 Human resource and education ... 69
6.5 Selective products ... 69
6.6 Market diversification ... 70
6.7 Agency responsible for export ... 71
CHAPTER 7: CONCLUSION AND RECOMMENDATIONS ... 73
7. Summary ... ... 73
7.1 Conclusion ... 73
7.2 Recommendations ... 74
Bibliography ... ... 77
x
Table of figures
Figure 1.1 Share of economic sectors in the gross domestic product (GDP) from 2007 to 2017 ... 8
Figure 1.2 Industrial components totals to 14.4% from 1999-2014... 10
Figure 1.3 Exports share of GDP from 2003-2014 ... 11
Figure 1.4 Recent trends for trade case in Rwanda ... 12
Figure 4.1 Rwanda exporting commodities in 2010 ... 47
Figure 4.2 New firms in manufacturing with new exports ... 48
Figure 4.3 Composition of industrial sector in Rwanda 1999-2015 ... 49
Figure 4.4 Showing KSEZ firm categories from 2013-2016 ... 51
Figure 4.5 Impacts of Kigali Special Economic Zone on exporting and importing ... 52
Figure 4.6 Firms in KSEZ that exports and imports (Annex A. 4) ... 53
Figure 4.7 KSEZ firms exports and imports ... 54
Figure 4.8 Types of KSEZ commodities exported... 55
xi
List of tables
Table 2.1 Countries implemented two strategies and results ... 19
Table 3.1 Korea’s export expansion from 1957-1970 ... 29
Table 3.2 Export of new items, 1960 to 1970 (Thousand Current Dollars) ... 30
Table 3.3 Government subsidized finance loan schemes for exports in 1967-1970 ... 33
Table 3.4 Growth and changes in industrial structure 1953~1977 ... 35
Table 3.5 Korean Exports by Major Sectors from 1953-1975 ... 36
Table 3.6 Major four digits commodities exported ... 36
Table 3.7 Comparison of bank interest rates in export vs commercial loans ... 38
Table 3.8 Musan size and firm’s composition activities ... 41
Table 3.9 Showing Masan SEZs in Korea. ... 41
Table 5.1 A comparative analysis of import- export strategy of Korea and Rwanda ... 59
1
Chapter 1: INTRODUCTION
1. INTRODUCTION
In the past two decades, Rwanda’s economy has been the quickest flourishing economy in the Sub Saharan Africa at GDP growth of 8% (World Bank 2015 a). Later, the economic growth declined due to poor performance in Agriculture (Smith 2012). Regardless of the former country’s economic growth, however, development in export promotion particularly in manufacturing sector and in general industrial sector have remained weak. Generally, one crucial indicator of country’s economic development is its stand in industrialization (UK essays trusted by students since 2003). Also (Rodriguez Mwalenga, Sept, 2012) Industrialization is important pillar of economy’s development, particularly in developing countries, it speeds-up economic growth, decreases dependence in foreign aid, creates employment opportunities, generates consumer goods to other sectors in need of them, adds up value to primary goods to mention a few (Brisbane, 1980). The above author continues to discuss how in the year 1945 after second world war up to 1970s, countries that adopted Import Substitution Strategy to produce consumer goods for luxuries and domestic market with high tariffs. However, some countries transitioned to export-oriented strategy and succeeded as will be elaborated in the details while others which didn’t change to Export-oriented failed. Thus Export Substitution Strategy proved to be important pillar of economy’s development (https://www.investopedia.com).
It is from this outlook; this thesis aims to examine which strategies can Rwanda learn from Korea’s experience of 1960s to 1970s to promote export promotion in manufacturing industry.
Then one can ask, why South Korea?
2
South Korea is one of the four Asian Tigers that is recognized of being the fast- growing economies in the second half of the 20th century. The four Asian Tigers are Hong Kong, Taiwan, South Korea and Singapore. Among the four countries, the author chose south Korea as comparative case of Rwanda in this thesis due to some similarities two countries share. South Korea is a country that has flourishingly changed into absolute industrialized economy but when historically, it was like other developing countries among which Rwanda is included hence this thesis.
More to this, in his remarks of 12th National leadership retreat in 2015, H.E the president of Republic of Rwanda Paul Kagame addressing to the leaders said “compare yourself with the best, not the worst. If you want to compare, compare with those who have achieved what we are struggling to achieve”.
It is in regard to the above remarks this research will compare South Korea’s export promotion process and that of Rwanda so as to obtain some appropriate lessons from South Korea’s experience. In this introductory chapter one, the following parts will come as follows; Research questions, research objectives, significance of the study and thesis structure.
1.1 RESEARCH OBJECTIVES
In light of these research questions, this research’s goal is to achieve the following objectives.
First and foremost, this research attempts to examine the strategies formulated by Rwanda government to promote export expansion and develop industrial sector to increase domestic production and export promotion in relation to those implemented by South Korea as a
3
comparative case study. In specific, it seeks to examine strategies formulated to promote export promotion and industrial sector to increase domestic production and to promote exports.
The second objective of this thesis is to examine the roles of government in formulating and implementing strategies in the case of South Korea as a comparative case study of this thesis.
The third objective and the last one of this thesis will attempt to draw appropriate strategy lessons to promote exports and industrial sectoral development through construction of Special Economic Zones (SEZs) to increase domestic production and promote exports in Rwanda and to provide potential policy recommendations in future.
1.2 RESEARCH QUESTIONS
Rwanda is striving to promote export expansion through developing industrial sector to increase domestic consumption and promote export promotion to foster future growth of Rwanda economy. In line with this strategic move, this thesis attempts to answer the questions as follows;
a. What are the rationale of Rwanda to develop strategies to promote export promotion and increase domestic production?
b. What lesson can Rwanda learn from South Korea’s successful strategies to develop industrial sector to increase domestic production and promote export?
c. According to Korean experience, how can Rwandan policy for export and import be improved?
4 1.3 SIGNIFICANCE OF THE STUDY
This study will play a part to the innovation of export promotion policies and strategies to increase domestic production and export promotion.
Second, the comparative analysis of Korea’s successful experiences provides a new insight on policy and strategy formulation for developing countries that have a target of becoming middle- income countries among them is Rwanda.
Third, this thesis will help policy makers to adopt effective policies and strategies formulation to promote not only export promotion expansion, but other sectors of development of the country.
The outcomes of this study will provide useful contribution in the formulation of other development plans and policies.
1.4 THESIS STRUCTURE
This Research is composed of seven chapters.
The first chapter comprises of Introduction, Research questions, Research objectives, significance of the study, thesis structure, similarities of two countries, Rwanda’s economic development, Rwanda’s industrial sector, statement of the problem, Research methodology and lastly, the Scope and limitations of the study.
The second chapter is divided into ten parts, the first part deals with Literature Review, definition of key terms, empirical evidence, import substitution strategy, foundational and historical perspectives of export strategy, advantages of export strategy, Analytical concept of Developmental state in East Asia (Four Asia Tigers), the role of Developmental state, developmental state in Latin America and Developmental state in Africa. Chapter three is
5
composed of ten parts, the first part outlooks Korea’s import substitution policy, introduction, Kickoff export promotion strategy, export incentives in 1950s-1960s, Government support to SMEs, Korea’s import policy, KOTRA and other institutions, Musan special economic Zones, introduction, Musan objectives, Link of SEZs performance with domestic economy, contributions of SEZs and Korea’s success in export. Chapter four is divided into eleven parts, the first part discusses Rwanda’s export sector, introduction, export composition, Rationale to promote exports, industrial sector, establishment of Rwanda development board, establishment of Kigali special economic zones (SEZs), inception of domestic market recapturing strategy, made in Rwanda campaign, establishment of export growth fund, EGF objectives, EGF targeted sector. Chapter five, makes a comparative analysis of import-export strategy of two countries of Korea and Rwanda. Chapter six is divided into two eight parts, the first part makes introduction of the chapter, state intervention, import-export transition, export incentives, Human resource and education, selective products, market diversification and Agency responsible for export promotion. The seventh chapter which is the last of this thesis, is divided into three parts, the first one is the summary of the thesis, followed by conclusion and lastly, recommendations.
1.5 SIMILARITIES OF TWO COUNTRIES
To start with political factor, South Korea’s experience is potentially appropriate to a wide developing countries in general, but in particular to Rwanda due to some shared history termed as initial conditions. South Korea was historically colonized which is same to Rwanda, South Korea had just emerged from its civil wars with North Korea in which most of the population was killed and displaced. Similarly, to Rwanda’s case of 1994 genocide in which almost one million people lost lives, economy destroyed and political system. South Korea is recognized as
6
a country which spoke out against corruption during its time of development up to presently.
Likewise, to Rwanda’s case, the leadership of His excellency president Kagame is against corruption and other issues related to it, thus Rwanda comes on the fourth position in Sub Saharan Africa and 48 out of 180 countries and territories in the world (Corruption perceptions index 2017). Last on Leadership, South Korea’s president was popular to business people and all citizens, he invited business people to invest their money in projects that are beneficial to the state, he also valued the significance of five-year Economic Development Plan and initiation of Saemaul Undong (New village movement) whose objective was to overcome poverty and achieve better Korean communities (Saemaul Undong concept). Likewise, to Rwanda government do recognize that, to attain development, private sector has to play a role, as the reason Rwanda government has formulated private sector development strategy 2013-2018 (PSDS) whose objectives are to help Rwanda achieve growth, create jobs, exports and investment. The government has established a government program Vision 2020 as policy orientation whose major objective is to transform the country from Agricultural based to middle income country, free from poverty and people have health life, EDPRS 1 &II, as functional and policy orientation to vision 2020. (Vision 2020, EDPRS I & ii)
In economic factor, South Korea was aid dependence, infant mortality was high, life expectancy was 57 years and 60 percent of the population lived below poverty line, had trade deficit, geographically land was mountainous not easy for cropping, un employment, made land reform to ease industrialization, all this characterized Korean economy but in short time, Korea has transitioned from economic under development to developed nation thus this move given name of “The Korean miracle” (Irma Adelman Nov 16, 2007). Likewise, all the economic challenges mentioned above are the same like Rwanda, where life expectancy in Rwanda is on 62, under
7
poverty line on 30%, infant mortality 30, but still under implementation of different policies to reach a better standard, land was reformed in Rwanda (World Bank report 2015, World Bank country overview, land law No 08/2005 of 14/07/2005).
South Korea and Rwanda shares common geography and history, where the two countries are mountainous with little natural resources hence a need to adjust in innovation and technology. In both countries people have one mother language. However, the two countries do have some dissimilarities in size, population and geographical location. Firstly, comparing the size of two countries, South Korea is 99.720 square km, while Rwanda is 26.338 square km. In brief, South Korea is about four times bigger than Rwanda. (www.mylifeelsewhere.com/country-size- comparison/south-korea/rwanda).
Secondly, as far as population is concerned, in 1960s South Korea’s population was 25 million people (world population review.com/countries/south. Korea).
While the current population of Rwanda is 12.552.401 million people, that is, two times of South Korean population (https://tradingeconomics.com).
Last but not the least is geographical location of each country, South Korea is located in East Asia, surrounded by three seas, the yellow sea to the west, the East of China to the South and the North Korea to the North, as we can see it is within the sea. While Rwanda is a land locked country located in central Eastern Africa, bordered by the Democratic Republic of Congo to the west, Uganda in North, Tanzania to the East and Burundi to the south (https://enwikipedia.org/wiki/Rwanda).
8
After realizing the similarities between South Korea and Rwanda, the author found the two countries suitable to be compared in comparative analysis of this thesis.
1.6 Rwanda’s economic development
Rwanda is a small country in size and in population in Sub Saharan Africa, also its economic growth is comparably lower than its members in EAC. The country is rebuilding itself from tragedies that it faced in 1994 genocide. It also lacks access to ports which affects its international trade. Further to this, the country is under-endowed with little natural resources, it also lacks infrastructures like electricity and transportation which still affects its trade, which in turn are barriers to private sector to engage in business. Despite of all challenges above, the leadership shows strong commitment to pursue economic development.
Figure 1.1 Share of economic sectors in the gross domestic product (GDP) from 2007 to 2017 Source: The statistics portal (https://www.Statista.com)
9
According to the graph, the share of economic sectors in the gross domestic product (GDP) in Rwanda from 2007 to 2017, the share of Agriculture in Rwanda was 30.96%, industry had 15.77%
and service sector contributed 46.38%. The industrial sector comes behind other sectors of the economy. From the above graph, the observation shows that industry sector has a gap which need to be brimmed. Though, the percentage of industry is low, in the year 2001 to 2012, the real GDP growth has been increasing annually at around 8%, however, in the following years the growth rate decreased at 7% (World Bank 12 a). The government established development program strategy in 2000 which has six objective pillars, the key one is to transform the country from low income country to a middle income by 2020 (Government of Rwanda 2000). In order for the government to obtain its long-term development goals, it has elaborated a medium term strategy for five years called the Economic Development and Poverty Reduction Strategy (EDPRS I). Presently, the country is under implementation of EDPRS II which outlines strategies of 2013 to 2018. Among all the strategies that it consists the highest priority is to speed up the growth and poverty reduction in five dimensions which are; economic transformation, rural development, productivity and youth employment and lastly is governance and accountability. Specifically, the main goal of EDPRS is to make GDP grow so as to reach at 1000$, reduce poverty rate below 30% and to reduce extreme poverty rate under 9%
(Government of Rwanda 2013).
1.7 RWANDA’S INDUSTRIAL SECTOR
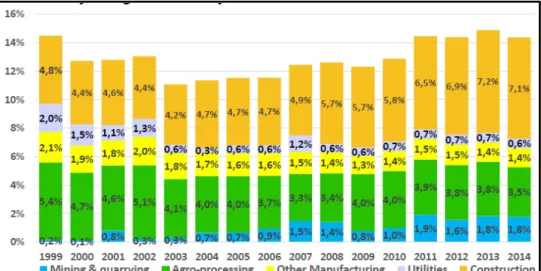
Rwanda industrial sector is composed of mining and quarrying, agro-processing, other manufacturing, utilities and construction. Among all, construction contributes 7.1%, agro- processing come as the second with 3.5%, followed by mining and quarrying with 1.8% second
10
to the last is other manufacturing with 1.4% and the last one is utilities with 0.6%. For more details, see the table below.
Figure 1.2 Industrial components totals to 14.4% from 1999-2014
From the graph, the components of Industrial sector are not strong enough to support the economy’s development as the table above shows.
11
Figure 1.3 Exports share of GDP from 2003-2014 Source: Ministry of Trade and industry, 2015
From the figure 1.3, exports share increased due to increase in minerals that exported, like in 2010, the exports were 5.2% and it improved in 2014, where exports increased to 9.2%. The improvement was due to the increase of minerals in the following years of 2013 and 2014.
Rwanda exports are extremely reliant on traditional basic products like coffee, tea, tantalum, tungsten, wolfram and pyrethrum. In the year 2013, minerals were the leading exports in Rwanda but it shortly fell when mineral prices were hit. In the year 2014 and 2015, export voucher from minerals lessened, the government become anxious about how to obtain exchange rate. As a response, the Rwanda government pledged to higher extra rate flexibility, decreasing imports and preventing fiscal policies (IMF 2016). Apart from the fall of mineral’s prices, the remaining products cannot sustain economy. industrial base is very small while technological capacity remains highly primitive to be competitive (Trading economics.com), National Bank of Rwanda).
12
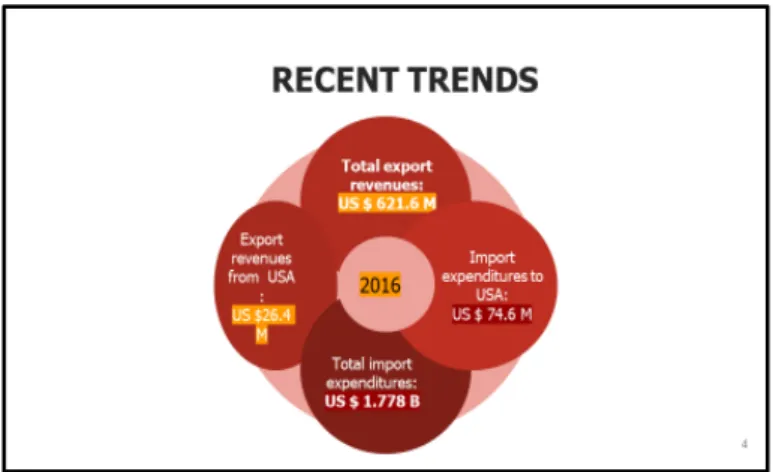
Figure 1.4 Recent trends for trade case in Rwanda Source: Author’s alteration
1.8 STATEMENT OF THE PROBLEM
The current problem related to export is that Rwanda exports relies on traditional commodities whose prices are not stable and spends more on imports of consumer goods and other products which are not produced locally. The remaining exports are weak to keep economy, thus a challenge on how to acquire foreign exchange and at the same time aid flow which would compensate decreased at 50% (IMF Staff report, July 2016). This results to be the main cause of inflation as all imports are paid in USD at high price (see 827.5 RWF on May 11, 2017) according to UN Comtrade Database,2017). As introduced form the introduction part, the reason for Rwanda to adopt export promotion is to speed-up economy (Rodriguez Mwalenga 2012) exports benefits a country’s economy in many ways; through exports country earns foreign exchange, goods are sold in return for foreign exchange, resources are greatly utilized, employments are created, primary products value added and so many, thus a country like Rwanda need to promote export to enjoy above benefits.
13
Furthermore, Rwanda as a country in East African countries and neighboring a big country need to export promotion so as to access regional markets like East African Community in which it belongs and the neighboring country of Democratic Republic of Congo(DRC) and
lastly, lack of employment opportunities as mentioned in the debut, export promotion creates employment. Thus the more expansion, the more employment is created
1.9 RESEARCH METHODOLOGY
To answer questions raised, this thesis will utilize comparative analysis on the existing studies related to the topic and seek to draw applicable recommendations for similar development in Rwanda. In essence, the academic reports, literatures and the government documents will be evaluated to examine which strategies are best to foster export promotion. Also strategy instruments and motivations which Korea used will be explored and contrasted to depict some practical implications for export promotion in Rwanda.
The case study of South Korea was selected based on its characteristics that are comparable to Rwanda. The analysis of export promotion strategy in each respective country examples will be based on the assemblage of illustrations considered in the existing literatures. The implications strategy proposals will be rooted/ based on the comparison between the established strategy frameworks, instruments introduced in the previous analysis.
1.10 SCOPE AND LIMITATIONS OF THE STUDY
This thesis is limited to accomplishment strategies that made South Korea to have speedy economic growth mainly in export sector, although Korea is infamous of her accurate achievement, but is not a matter of copy-and-paste but need to analyze Korea’s quick growth at
14
least in two causes. The first cause will base on Comparing Korea’s political and economic situations of the two countries, that is Korea and Rwanda where they have similarities.
Secondly, analyze some strategies which were productive in Korea’s economic development. In brief, this thesis will be much carefulness and prudence while looking which strategies Rwanda can embrace from Korean development strategies.
15
CHAPTER 2: LITERATURE REVIEW
2. INTRODUCTION
In this chapter, earlier studies and literatures are reexamined to set recent theoretical and empirical literature. This section is divided into four parts; the first part comprises the definitions of key terms. The second part discusses empirical literatures on export growth on economic development, the third part displays the model countries in implementing two strategies and their advantages to economic development of a country, and lastly analytical concept of developmental state in four Asian Countries, North America, South Korea, Africa and Conclusion.
2.1 DEFINITION OF KEY TERMS
Export Substitution Industrialization (ELI), Export-led, growth is a trade and economic policy aiming to speed up the industrialization process of a country by exporting goods for which the nation has a comparative advantage (https:www.definitions.net/definition/export).
Import Substitution Industrialization (ISI) is Development strategy focusing on promoting domestic production of previously imported goods to foster industrialization (https://www.britannica.com/topic/import).
Export promotion measures means incentive programs that attracts firms into exporting(https://www.britannica.com/topic/import)
Developmental state or hard state, is a term used by international political economy scholars to refer to the phenomenon of state-led macroeconomic planning (https://www.definitions.net/definition/development)
16 2.2 EMPIRICAL EVIDENCE
Notwithstanding that, its well-recognized that export growth is significant to the economic growth, there has been evidence based on it to see if really it is salient. Starting from half way 1980s Granger causality experiments was carried out to find out the relation between export growth and economic growth, the results manifested that, export led growth does not hold any effects until certain level of economic development, at the same time. This has resulted to the mixture of empirical works. Another scholar in the name of Hans Singer expressed the view that the positive effects of export oriented become not clear from the halfway 1970s even in the newly industrializing countries (Singer, Hans W., 1989). Awokuse displays that there is some practical proof that backs the export-led hypothesis (Awokuse, Titus Vol.40, No.2, 2008), other scholars Lyer, Rambadi and Tang (2009) apply a co-integrated vector autoregressive model counter parted by a Granger causality test and display that the exports as manifested to be not important in explaining economic growth. Hence, the empirical evidence appears to be mixed.
Amin Gutierrez de pineres and Avella-jorda (2007) use data for sixteen Latin American countries and come to the conclusion that the results for export-led growth hypothesis contrast with depending on the selection of data and test methodologies. Other group of works has tried out the hypothesis that changes the export product composition cause economic growth. The practical proof has shown back of the hypothesis in general. Ghatak.et.al. used co-integration and causality tests to examine the export led growth hypothesis for Malaysia and found that the economic growth of Malaysia was directed by manufacturing exports rather than exports of primary goods (Ghatak, S., Milner, c and Utkulu., Vol.29, No.2,1997). According to this author, the production of manufacturing like textiles has already started but requires the government of Rwanda to look for more investors partners in this sector as it has been proved to speed-up
17
economic growth. Koh and Mah use co-integration test and error correction models to Korea.
Their outcomes show that growth ratio of non-textiles, that is heavy and chemical industries, exports to textile exports has led to higher economic growth and vice versa. Trade liberalization is shown to have a positive effect on economic growth of Korea (Kon, sae Ran Jai S. mah, 2011).
Different from the works examining the relation between export growth and economic growth, some scholars have examined whether export promotion measures truly results to export expansion significantly Jung and Lee, (1986) explored the impacts of various types of export promotion policies on the amount of manufactured exports in Korea. They found an aggregate export supply function where relative prices, subsidy and capacity utilization ratio as the domestic demand pressure variables. Subsidies like preferential export finance, tariff reduction and exchange rate changes using data for the period 1964-1980, they display that I percent increase in subsidy would bring about 2 percent growth in export supply. Despite the fact that, it is the first empirical work on the effect of export promotion policy on export, the measure of export subsidy includes neither export insurance nor duty drawback scheme was effective in promoting export supply of Korea during 1975-2001. Also this strategy of providing incentives has proved to be contributing the promotion of exports though the percentage is not high, but a starting country in the field of export can provide regarding the selected sectors to promote like manufacturing since it has proved too. Lederman et al (2010) used data covering 103 developing and developed countries, their cross section analysis displays that export promotion agencies have statistically significant outcome on export expansion; For now, they do not consider export incentives such as export insurance and duty draw back (Jai S. Mah, October 2010). This analysis backs the provision of export promotion, though, there are others which are no longer in use, but support that if countries give export incentives, there will be increase in export and
18
economic growth as well. Rwanda has just started manufacturing which is at starting period, thus need to provide these export promotions so as to attract more investors to invest in Manufacturing sector to increase productivity and be more competitive in the region.
2.3 IMPORT SUBSTITUTION STRATEGY
The strategy of Import Substitution Industrialization (ISI) results into replacement of goods that were previously imported with domestic of international openness. The strategy was founded in most of Latin American countries as a response to the break of World War I and ii and the economic depression of 1930s (Ayob Kahsai Michael, 2003:22).
Later, in 1955, ISI was followed as an intentionally industrialization strategy. It was provoked mainly by the ideas of Singer and Prebisch in the 1950s. One of the challenges developing countries face, is to ameliorate their economic growth due to the lack of success to recognize ways to amalgamate their economies with the world economy (ibid). The puzzle is to choose among the two strategies among Import Substitution Strategy and Export Substitution Strategy.
Especially developing countries chose ISI, giving reason of having no ability to compete internationally and therefore choose ISI so as to make policies that protect their domestic market.
The advantage of ISI, is that it creates a fence of import from their countries so as to back their home market for improvement (Ayob Kahsai Michael, 2003:22).
19
Table 2.1 Countries implemented two strategies and results
COUNTRY PERIOD TRADE SRATEGY GROWTH RATE
Brazil 1955-0 Import Substitution 6.9
Brazil 1960-5 Import Substitution 4.2
Brazil 1965-0 Export Substitution 7.6
Brazil 1970-6 Export Substitution 10.6
Colombia 1955-0 Import Substitution 4.6
Colombia 1960-5 Import Substitution 1.9
Colombia 1970-6 Export Substitution 6.5
South Korea 1953-0 Import Substitution 5.2
South Korea 1960-5 Export Substitution 6.5
South Korea 1970-6 Export Substitution 10.3
Tunisia 1960-0 Import Substitution 4.6
Tunisia 1970-6 Export Substitution 9.4
Source: Ayob Kahsai Michael, 2003:22
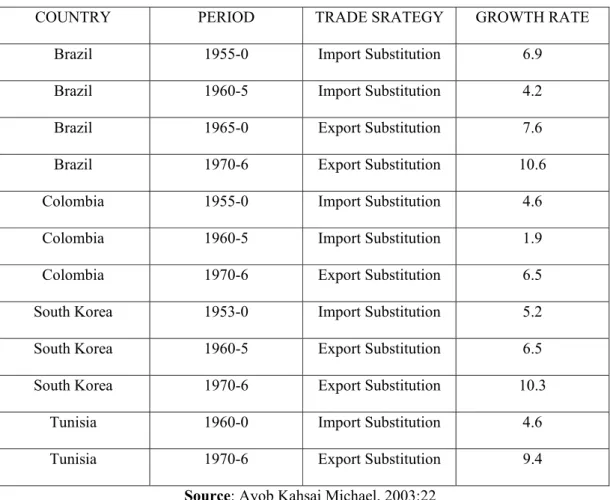
The Table 2.1 shows, the difference in economic growth in the countries that implemented two different strategies of industrialization. The table compares four countries for a period of 23 years, Brazil changed from Import Substitution to Export-led and gained an increase in economic growth, in 1970s, gained 10.6 compared to 4.2 of 1960s. Colombia in 1970s gained an increase in economic growth compared to the first period of Import Substitution, the most exciting change happened in South Korea from 1960s when it transitioned to Export-led strategy and in Tunisia in 1970s.
20
Having insights of different countries increase in their economic growth, after implementing two strategies, the experience shows the best strategy to apply as Export-led strategy than Import Substitution. But again, all countries transition to Export –oriented after having carried out Import substitution, it means that Import Substitution is a prerequisite for Export-oriented promotion. When countries transition to export-oriented, there are some improvements in industrialization, industrial labor development and modern infrastructures which all are necessary for export-oriented. Thus on Rwanda’s case to implement DMRS to reduce Rwanda’s trade deficit which is a big challenge to economy and increase local production for consumption need to carry out both strategies but to a big extent export-led.
2.4 FOUNDATIONAL AND HISTORICAL PERSPECTIVES OF EXPORT STRATEGY
Export strategy industrialization was formally component of the national economies ‘growth of some countries like Japan, Singapore, Taiwan and South Korea by the time of post-world war ii.
It moved to fame in latter 1970s when it succeeded the import substitution strategy which had influenced development policy intelligent in the Latin America region in 30 years later after world war ii. The main intention of this strategy is to increase trade instead of reducing trade (Thomas I. parry, July, 2011:3). Further, even though, some countries that adopted export strategy industrialization do charge high tariffs on certain goods especially agricultural products, their interventions are more outward than those of import substitution strategy (Ayob Kahsai Michael, 2003:22). Export strategy is the major task term to comfort national success as well as looking ways to alleviate poverty and bridge the gap that exists between developed and developing countries. Thus, necessary to expand general comprehension on latent explanation for reasons why developing countries including Rwanda should adopt Export Strategy
21
Industrialization. In regard to the above, ISI was perceived to have been neglected long ago, after it failed to deduct external reliance, in all times of importing raw materials. It should however, be noted that industries in developing countries had permitted technology from developed countries.
Government intervention most especially via state owned enterprise (SOES), proved to be a culvert for flow of resources.
2.5 ADVANTAGES OF EXPORT STRATEGY
The need to acquire international exchange is necessary as why there is coercion from international institutions, like World Bank and International Monetary Fund (IMF) which have approved export industrial policies since 1960s and the leading countries in the process were Taiwan, Singapore and South Korea which are the base of developing countries to start to adopt their policies to manufacture for the global market instead of their small domestic market (Choen Krainara, 2007:9). Greenaway and Nam (Kyklos,1988) and World Development Report, 1987 both suggest that the best performer among the two strategies is export-oriented industrialization which can lead to the successful growth of the country. Other scholars like, Arruria, Miguel and Seiji Naya displayed how the strategy is advantageous to economy’s development. The strategy consists better policies like motivations instead of controls, all the measures are applied Worldwide. Contrary to ISI policies which are bias to exports and generate market distortion. In export- oriented, it is easy to prove the effectiveness of export promotion strategy because its outcomes can be detected smoothly and their faults are rectified as soon as possible. Export- oriented provide firms the chance to expand their markets and gain greater scale of economies.
Export-oriented pushes firms to join contest in foreign market and obtain competences.
According to (Car Baugh, 2007) export-oriented strategy motivates and persuades firms in which
22
developing countries are probably to have a relative advantage like labor intensive fabricated goods. Further, Balassa, 1978 stresses that, as developing countries are rich in human resource endowment, export-oriented strategy devotes to create jobs. The strategy is significant to developing countries including Rwanda which if established and promoted can kill two birds with one stone, meaning the strategy can;
a. Promote foreign exchange
b. Satisfy home market and foreign market c. Job creation opportunities.
Lastly, Kissinger 1967, states that in export-oriented strategy, international rivalry compels domestic entrepreneurs to concentrate on possibilities and boost learning procedures.
2.6 ANALYTICAL CONCEPT OF DEVELOPMENTAL STATE
The Developmental state theory is when the government has taken a crucial part of exhilarating trust to different investors by assisting them via socializing in subsidies investment scheme. So as to understand the developmental state, Johnson (1999) defined by pinpointing its first prime concern as economic development, that the developmental situation of the state dominates Ha-Joon Chang defines Developmental state as a state which produce and control informally and antagonistically attached to economic and political connection that can back constant industrialization. Chang (1999) continue to explain institutional adoption as when the state contains to changing outside market situation to endure competitive and further investment in human resource and development. Crucial components of the developmental state include state financial control via credit-based financial incentive structures and industrial policy drafted by
23
self-governing meritocratic elite embedded in association of common business conversion. The state organizes and negotiates investment resolutions accompanied by a big economic association in a crucial sector. It is significant to record that devotion concerted objectives on the promise of private equity as well as encouragement of nationalist sentiment.
2.7 DEVELOPMENTAL STATE IN EAST ASIA (FOUR ASIA TIGERS)
In East Asia, particularly in South Korea, government supplied firm and foreseeable motivation schemes to industries that performed successful and could take these incentives away in case firms performance wasn’t sufficient. The selection criteria for targeted industries for assistance were in the domain of export performance and in the domestic competition. Though East Asia were good in formulating industrial policies. it should be admitted that, yet they had similarities and dissimilarities between the knowledge and actions of four Asian tigers. Like in South Korea and Taiwan, government interference was predominant and less insignificance in Singapore and Hong Kong. Besides, South Korea and Taiwan devoted to a great degree in development of domestic innovation abilities, contrary from Singapore and Hong Kong whose key technology strategy was to entice foreign investors (Lall 2000).
2.8 SOUTH KOREA’S SUCCESS IN EXPORT STRATEGY AND THE ROLE OF DEVELOPMENTAL STATE
According to Chibber 1999, Park declared that the exports was the main pedestal of the country’s economic planning. On top of that, industries would in the end be awarded if fulfilled well and disciplined if they did worse than agreed on or they fail to do as well as expected. Such degree of economic accomplishment which president Park devoted to industries was noticeable. This
24
working situation prepared Korea business owners to produce exports for global markets which Koreans had a bit of comprehension and readiness (Benjamin Pham: political Science 211).
Amsden (1989) use Johnson’s idea of the developmental state and use it to explain South Korea’s development background. The following are the most salient reasons for Korea’s success;
South Korea government’s goal was to have rapid industrialization. Second, the government generated solid political environment which was conducive to Korean businesses to be bravery.
Korea’s government interventions were intended to “get prices wrong” in order to persuade investment in another action plan which were salient firms (Benjamin Pham: political Science 211). Last but not the least, Firms which accomplished the given tasks were financed, and the conditions were created in exchange for these allowances. Industries that worked well were given bonus, while those that didn’t reach to required standards were not given support and would sometimes be punished or fail forever in some cases. Allowances given to industries in many times were in terms of finance which Korea government had absolute control.
2.9 DEVELOPMENTAL STATE IN LATIN AMERICA
In Latin America, developmental state was un productive compared to four Asian tigers. The reason was that, industrialization strategy and other industrial policy asserted were not like those in East Asia. The difference of the two regions is that, all firms in Latin America were given same motivations as supplied to firms in East Asia but those of Latin America were inept. For example, the way rules and rivalry policies changed the structure of domestic market. crucial features of a victorious developmental state. The policies were same in almost developing countries but their outcomes were still different in the two regions. For the side of four Asian
25
tigers, the policies brought conducive environment and used the advantage to exploit economies of scale and make firms to grow efficiently, while in Latin America, they only created a preserved home market for local firms but even un productive.
Also in Latin America, they espoused an anti-export strategy of import industrialization and lacked government capacity and investment in different sectors like in education, science and technology innovation was less qualified than in East Asia.
2.10 DEVELOPMENTAL STATE IN AFRICA
Making an effort for industrialization in Africa was in general inadequate. Even though, there are some successful countries like Mauritius, Botswana and Madagascar. But in general inward industrialization in Africa failed. According to UNCTAD (2007) the first reason for failure given is that developmental state wasn’t successful due to incapacity of the African states to formulate and implement an effectual industrial policy.
The second reason given, is incapacity of ISI to modify external conditions differently and the third reason which is the last is political dimension where Robinson (2009) explains that industrial policy succeeds when leaders with power really want industrialization to flourish. In relation to the Robinson’s idea, Rwanda since 2000 has established a government program development with six objectives, but among all the key is to transform a country from agricultural based to middle income country, from all above experiences, Rwanda has an advantage of knowing which strategy to apply, according to Winston Churchill “Those that fail to learn from history, are doomed to repeat it”. Thus the history of other countries should be insight for Rwanda to know which strategy to apply. In short, after insight of past and current experiences of some countries like Brazil, Colombia, East Asian countries, Latin America and
26
African countries, one can ask which strategy should Rwanda adopt? Having seen countries that succeeded and others that failed, this will provide Rwanda with awareness to decide how to go through so as to afford to design and execute its export promotion effectively.
Also Rwanda will acknowledge that for a country to formulate industrial policy, need to have dynamic nature of controlling excellent policy, where its content and objectives are extendedly assessed and upgraded taking into consideration the outcomes acquired, under the restrictions provided by the convenient wealth and capacities. Also according to recent literature Rwanda should know, that there is no single formula for effective export industrialization. Preferably, the prominent general agreement is that the successful export industrialization policy requires to be combination of many practices and country’s domestic exercises are all important characteristics.
Though economic literature of industrial policy is huge, something important has been learnt from its theory and empirics, for a country like Rwanda need to consider its political economy of industrial policy, the history of the country that need to formulate industrial policy, what characterizes the economics of the country and the last the political environment of the country, all components mentioned above determine what kind of industrial policy is practical and achievable to execute ( Michele Di maio, industrial policy, 2014).
27
CHAPTER 3: KOREA IMPORT SUBSTITUTION POLICY
3. INTRODUCTION
From 1950s, the Korean government policy was Import protectionist and export to certain extent so as to acquire some foreign exchange. Essentially, it was government’s development policy whose intention from the beginning was to enlarge industrial from import Substitution, the government espoused to it as an answer to the serious foreign exchange crisis by then. Import Substitution under protection was the stand and policy for industrialization recommended by the economics profession in the 1950s and 1960s, it was only after the East Asian experiences that benefits of open trade regime began to be recognized by the profession (Kruger (1997). The policy aim for industrial development through Import Substitution was obvious in the tariff increase of the tariff system that established in 1950, they arranged from zero to more than 100%
on goods like essential, food grain, raw materials and other non-competent goods. Luxury goods contained tariff cost of 100% or above. For a long time, tariff exemptions were established in 1952, capital goods imported and individual tariff rates were amended, but the whole structure tariff wasn’t changed up to 1970s. Import restriction has upsetting effect on export through another pathway like effect on foreign exchange rate. Import restriction decreases the import demands and consequently the demand for foreign exchanges, thereby decreasing the exchange rate, that is, the won-dollar rate in Korea is example (Jungho Yoo, 2017).
28 3.1 KICKOFF OF EXPORT PROMOTION STRATEGY
Korea government adopted export-oriented strategy which had favorable outcome contrasted to the earlier ISI procedures. It is said that US coercion to reduce aid was the salient factor that directed South Korea to adopt export strategy. In the beginning Korea depended on US foreign aid, the time reached when America gestured to Korea that it wasn’t reluctant to persist providing aid to South Korea, from this gesture South Korea found alternative source of to obtain foreign currency reserves was to adopt export strategy. Besides, US advisors had earlier along persuaded Korean leaders to enlarge its export size in part since America’s growing military confrontation in Vietnam in which Korea can export to (Siwook Lee, Spring 2003).
3.2 EXPANSION AND EFFECTS OF EXPORT STRATEGY
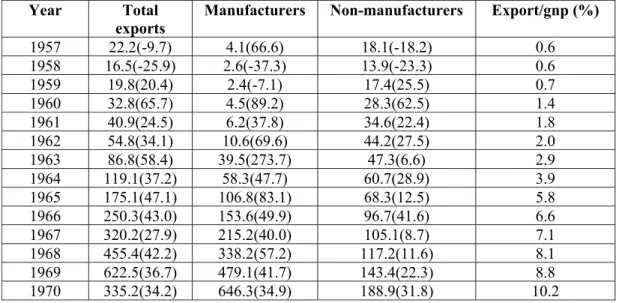
The annual growth grew to 35.3% on average, from 1963 to 1969 later in 1970, the growth decreased to 25.4%. Studies show that Korea’s economic growth started by the time of Import Substitution then to Export Substitution promotion in 1960s and the trade policy shifted in the direction of less interference and more relaxation method (Core & Lyman, 1971). Differently to other studies that followed in 1980s which support the government to have contributed a big role. According to Table 3.1, it comes into view as the year 1959, to be the commencement year of total export. In that year, the amount of export grew to double-digit rates which is the proof.
Although, during that time growth look to have happened by possibility totaling to 25.5% growth of non-manufactured exports, which didn’t continue to grow in the following years (Jungho Yoo, 2017:3).
29
Table 3.1 Korea’s export expansion from 1957-1970 (MILLION CURRENT DOLLARS)
Year Total exports
Manufacturers Non-manufacturers Export/gnp (%) 1957 22.2(-9.7) 4.1(66.6) 18.1(-18.2) 0.6
1958 16.5(-25.9) 2.6(-37.3) 13.9(-23.3) 0.6
1959 19.8(20.4) 2.4(-7.1) 17.4(25.5) 0.7
1960 32.8(65.7) 4.5(89.2) 28.3(62.5) 1.4
1961 40.9(24.5) 6.2(37.8) 34.6(22.4) 1.8
1962 54.8(34.1) 10.6(69.6) 44.2(27.5) 2.0
1963 86.8(58.4) 39.5(273.7) 47.3(6.6) 2.9
1964 119.1(37.2) 58.3(47.7) 60.7(28.9) 3.9
1965 175.1(47.1) 106.8(83.1) 68.3(12.5) 5.8
1966 250.3(43.0) 153.6(49.9) 96.7(41.6) 6.6
1967 320.2(27.9) 215.2(40.0) 105.1(8.7) 7.1
1968 455.4(42.2) 338.2(57.2) 117.2(11.6) 8.1
1969 622.5(36.7) 479.1(41.7) 143.4(22.3) 8.8
1970 335.2(34.2) 646.3(34.9) 188.9(31.8) 10.2
Note: The number in the brackets are annual growth rates in current dollars.
Source: KOSIS, On-line information service, National statistics office, the Korean government, Jungho Yoo, (2017)
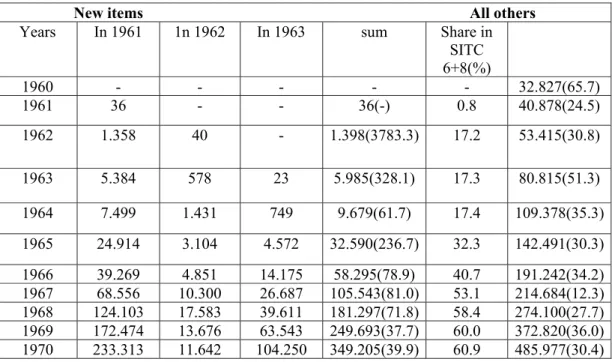
The Table 3.2 displays how the share of SITC6+8 in total exports increased expeditiously from 1962 growing from 10% to 70% until 1968. It is believed that, this rapidly increase in export was great role played by labor-intensive manufactures. Thus, the year 1962 is recognized of the year of rapid export expansion. Also another distinct feature that entitled to have played a great role in the export expansion is the new items that appeared in the same category of subgroup SITC6+8 which led to uncountable growth.
30
Table 3.2 Export of new items, 1960 to 1970 (Thousand Current Dollars) New items All others Years In 1961 1n 1962 In 1963 sum Share in
SITC 6+8(%)
1960 - - - - - 32.827(65.7)
1961 36 - - 36(-) 0.8 40.878(24.5)
1962 1.358 40 - 1.398(3783.3) 17.2 53.415(30.8)
1963 5.384 578 23 5.985(328.1) 17.3 80.815(51.3)
1964 7.499 1.431 749 9.679(61.7) 17.4 109.378(35.3)
1965 24.914 3.104 4.572 32.590(236.7) 32.3 142.491(30.3)
1966 39.269 4.851 14.175 58.295(78.9) 40.7 191.242(34.2)
1967 68.556 10.300 26.687 105.543(81.0) 53.1 214.684(12.3) 1968 124.103 17.583 39.611 181.297(71.8) 58.4 274.100(27.7) 1969 172.474 13.676 63.543 249.693(37.7) 60.0 372.820(36.0) 1970 233.313 11.642 104.250 349.205(39.9) 60.9 485.977(30.4) Note: 1. “New items” are footwear, travel goods, and clothing, which began to appear in 1961;
synthetic fabrics, umbrella, and artificial flowers in 1962; woolen fabrics and wigs in 1963. “All others” denote total export less export of new items.
2. The numbers in parentheses are percentage growth rates in current prices.
Source: Bank of Korea, Economics statistics yearbook, 1960,1964, 1966, Ministry of commerce, trade statistics yearbook, 1964
The table 3.2 shows that; the expansion of new items was blistering than the growth of the actual export items. Within five years of exports, when new items become visible in exports in the year 1961, they grew 1091 times current dollar terms, those of 1963 grew 1722 times. The plausible example is clothing(SITC84) item export which increased from 2 thousand dollars in 1961 to 213.6 million dollars in 1970. In comparison with the former items for exports, their
31
total export was less compared to new items. The growth rate of new items didn’t last for long, thus the growth decreased and became like the former items. Although, it is believed that new items led to the sudden and rapid export expansion (Jungho Yoo, 2017:5).
3.3 EXPORT INCENTIVES IN 1950S-1960S
The first system was trade credit system which was in place in 1950, in this system, exporters benefited the prime concern of being allocated in domestic credits. This policy approval persisted from 1960s to 1970s, the interest rates on loans to exporters were badly decreased from 1960s.
Another export means in the name of preferential export system or export-import link system was espoused in 1951, in which exporters of nonessential domestic goods benefited the appropriate way to use some parts of foreign exchange earnings for importing popular items which couldn’t have been imported. This system was stopped in 1953 by the time of devaluation.
Since 1952 to 1954 exporters benefited preferential access to foreign exchange loans in a scheme that was set for the government-held foreign exchanges (KFX) to domestic users. In 1955 direct subsidies were provided for exporters later on, the subsidies came to an end due to government failure to include them in government budgetwhich was established in 1959 on imports of raw materials and intermediate goods for exporting. Tariff exemption which later was changed to tariff rebate in 1974(Jungho Yoo, 2017). A subsidy in the name of Importer’s licenses were allowed only to the industries whose export execution fulfilled at least an approved model or standards. The lowest export required for a permit in 1964 was at $ 100.000, in 1969 it increased to $ 200.000 and in 1970, it reached to $ 300.000 (Jungho Yoo, 2017).
32 Table 3.3 Major export incentives
Description Dates Applicable
Tariff exemption on imports of raw materials and spare parts 1959-72 Domestic indirect and direct tax exemptions 1961-72
Accelerated depreciation 1966-72
Tariff and tax exemptions granted to domestic suppliers of exporting firms
1965-72
Wastage allowances subsidies 1965-72
Import entitlement linked to exports 1951-55, 1963-65 and 1966-71 Reduced rates on public utilities 1967-71
Registration as an importer conditional on export performance a
1957-72 Dollar-denominated deposits held in Bank of Korea by
private traders b
1950-61 Korean Trade promotion corporation 1964-72
Monopoly rights granted in new export markets c 1967-71
Direct Subsidies 1955-56 and 1961-64
Export targets by Industry 1961-64
Credit subsidies 1962-72
Export credits d 1950-72
Foreign exchange loans 1950-54 and 1971-72
Production loans 1959-72
Bank of Korea discount of export bills 1950-72
Import credits 1964-72
Capital loans by medium industry bank 1964-72
Offshore procurement loans 1964-72
Credits for overseas marketing activities 1965-72
Source: Charles Frank, Jr., Kwang Suk Kim and Larry E. West phal, 1975
In addition to this, in the year 1969, traders were classified in four categories and given names like blue, white, yellow and red-cards holder, which accounted for annual achievement jazzed-up, the best performance businesses were favored in different ways including exemption of collateral for regular and special tariffs, relaxation of tax surveillance and preferential treatment in foreign exchange allocations for overseas (Charles Frank, Jr., Kwang Suk Kim and Larry E. West phal, 1975:67). Individual exporters were likely given monopoly rights in new market export. This
33
type of subsidy started in 1962 but only was used to few goods till 1967. In 1972 was a reform of many export incentives which was lessened. The lessening was as follows; 50% reduction in tax of corporation and individual business income earned from export was terminated. Government declared a gradual adoption of a tariff rebate. Lastly, till 1973, imports of raw materials for exports were allowed tariff exemption, but when importer failed to rise the designed export
target and rules was fined.
In Table 3.4, it is shown that, from 1967 to 1970, export incentives persisted on going. Among all the subsidies, preferential loans were the powerful and salient engine for export promotion during the interest rate reform of 1965. The table displays the increase of diverse subsidized government finance loan schemes for exports in the year 1967 to 1970. Also in the year 1968 and 1969 export industry operating credit and export industry promotion were terminated.
Government replaced them with credits for domestic production of raw materials for export productions and processing.
Table 3.3 Government subsidized finance loan schemes for exports in 1967-1970 Outstanding credit million won as of Dec 31
1967 1868 1989 1970 Annual
interest rate Term 1. Export credit 6.618 8.072 11.866 19.129 6.0 90-135
days 2.
Loans for suppliers of US off-shore
procurement 3.399 3.567 5.291 4.510 6.0 90 days 3. Credit for imports of raw
materials for export 17.835 20.239 31.868 49.981 1.5 60 days 4. Payment guarantee (11.8350) (8.859) (14.201) (21.244)
5. (Domestic issuance
foreign exchange (62) (29) - - 6.0 90-135 days 6. (Import loans) (6.481) (11.351) (17.666) 28.737 6.0 90.135
days 7. Export issuance 652 550 1.986 4.463 6.0 90-120
days
34
8. Loans for export - - 35 154 6.0 90-120 days 9.
Foreign exchange loans for import of capital
goods for export industries
1.849 7.802 10.297 21.372 12 3-5 years 80% of import value through 68 &
90% in 69 10. Export industry
promotion loans 61 368 28 7 26.0 90 days Abolished 1969 11. Export industry
operating loans (count
part fund) 193 - - - 18.0 1 year Abolished
after 1968
12. Equipment loans for conversion into export
industry 1.531 2.237 2.536 2.826 12.0 5 years
A maximum of 10m won
to those industries specified by the ministry
of commerce and industry 13. Loans for export
specializing industries 292 563 742 807 12.0 90-120 days 5 years 14. Loans for production of raw materials - - 134 833 6.0 90-120
days
220 won per dollar in 1969-1970 15. Loans for preparing
agricultural and fishery
products for export - - 3.413 4.001 12.0 90-180 days
70% of required
funds
Total 32.430 43.398 68.196 180.083
Source: Bank of Korea: Medium industry Bank Raised to 90 percent per annum, June 1971
Another subsidy in the name of flexible wastage allowance increased in support another incentive for export in 1960s to support many industries (Charles Frank, Jr., Kwang Suk Kim and Larry E. West phal, 1975:63-65). However, Korea government have invested a lot of export measures to promote exports, the findings manifested that, these measures did not directly influence exporter’s earnings, and their effects that was observed on export was unintended [Hong (1979:49), Frank, Kim &West Phal (1975:38,60).
35
Table 3.4 Growth and changes in industrial structure 1953~1977
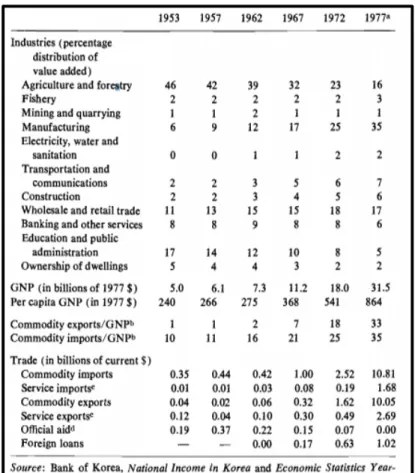
As the table 3.4 displays, the increase in growth rate was escorted by the quick change in manufacture make up. The example in agriculture, industry and fishery which composed of 42 % of GNP in 1957 amounted to 23% in the 1972, manufacturing which had 9% grew to 25% of GNP in 1972. Thus the growth was observed during export promotion.
36
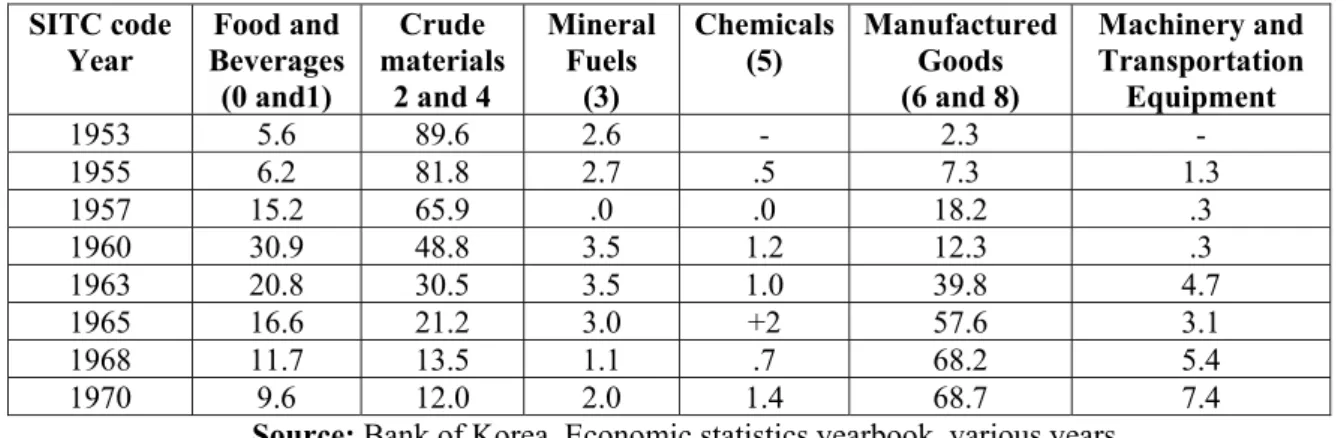
Table 3.5 Korean Exports by Major Sectors from 1953-1975 SITC code
Year
Food and Beverages
(0 and1)
Crude materials
2 and 4
Mineral Fuels
(3)
Chemicals (5)
Manufactured Goods (6 and 8)
Machinery and Transportation
Equipment
1953 5.6 89.6 2.6 - 2.3 -
1955 6.2 81.8 2.7 .5 7.3 1.3
1957 15.2 65.9 .0 .0 18.2 .3
1960 30.9 48.8 3.5 1.2 12.3 .3
1963 20.8 30.5 3.5 1.0 39.8 4.7
1965 16.6 21.2 3.0 +2 57.6 3.1
1968 11.7 13.5 1.1 .7 68.2 5.4
1970 9.6 12.0 2.0 1.4 68.7 7.4
Source: Bank of Korea, Economic statistics yearbook, various years
Note: Figures do not add to 100 owing both to rounding and to a small “unclassified” category in Korean imports
Table 3.6 Major four digits commodities exported
SITC Code Commodity Value (millions of U.S.
Dollars) 8414 Clothes and accessories, knitted or crocheted 132.9
8411 Clothing of textile fabrics 129.2
6312 Plywood 126.8
8999 Miscellaneous manufacturing neck. 70.6
7293 Valves and tubes 48.5
2613 Raw silk 39.3
8510 Footwear 37.4
8412 Clothing and accessories made of fabric 36.2
6521 Cotton fabrics 20.7
0311 Fish, fresh and chilled 20.0
6516 Yarn and thread of synthetic fibers 19.2
6743 Iron and steel plates and sheets 19.2
6556 Twine, cord, and rope 17.2
6535 Fabrics made of synthetic fibers 14.4
0313 Crustaceans and mollusks 14.1
Source: Bank of Korea, Economic Statistics Yearbook, various years.
37
Table 3.7 identifies 15 biggest four-digit export categories. Such products include textile, apparel items which was dominant but entails also iron sheet products, ply wood, footwear and fishery products and many others in table 3.7
3.4 GOVERNMENT SUPPORT TO SMES
Korea government initiated countless tangible incentives to encourage small entrepreneurs to become exporters. When the government targeted a certain product as far as the market oriented, it generated direct and indirect incentives whether in financing, taxation and managerial command to the producer who met the requirements. The incentives included reductions in corporate and private income taxes, tariff exemptions for tax rebates. Government provision of accelerated allowances to manufacturing industries enabled them more than 50% of revenue in foreign exchange and gained more 30% of ordinary depreciation which was authorized by the tax law. All incentives government provided, interest subsidies to exporters was the most significant.
3.5 KOREA’S IMPORT POLICY
Although Korea government was necessarily export oriented, it had not quit or introverted to the free trade. Likely, in 1967 in Korea, domestic industries were safeguarded by direct import controls. Imports were allowed on the starting point of those items that were included on the list of items allowed to be imported. The list included main items like essential raw materials, energy, capital and intermediate goods. After the government adopted consolidated exchange rate system in 1964, it continued to construct incentive formation that preferred utilization of imported capital and intermediate products to expand active export firms. The government proceeded with