저작자표시-비영리-변경금지 2.0 대한민국 이용자는 아래의 조건을 따르는 경우에 한하여 자유롭게
l 이 저작물을 복제, 배포, 전송, 전시, 공연 및 방송할 수 있습니다. 다음과 같은 조건을 따라야 합니다:
l 귀하는, 이 저작물의 재이용이나 배포의 경우, 이 저작물에 적용된 이용허락조건 을 명확하게 나타내어야 합니다.
l 저작권자로부터 별도의 허가를 받으면 이러한 조건들은 적용되지 않습니다.
저작권법에 따른 이용자의 권리는 위의 내용에 의하여 영향을 받지 않습니다. 이것은 이용허락규약(Legal Code)을 이해하기 쉽게 요약한 것입니다.
Disclaimer
저작자표시. 귀하는 원저작자를 표시하여야 합니다.
비영리. 귀하는 이 저작물을 영리 목적으로 이용할 수 없습니다.
변경금지. 귀하는 이 저작물을 개작, 변형 또는 가공할 수 없습니다.
Master of Science
A study on water dispersible graphitic carbon nitride photocatalyst for the removal of organic dyes
The Graduate School of the University of Ulsan Department of Chemical Engineering
Nguyen Thi Kim Anh
[UCI]I804:48009-200000364646 [UCI]I804:48009-200000364646
A study on water dispersible graphitic carbon nitride photocatalyst for the removal of organic dyes
Supervisor: Professor Eun Woo Shin
A Dissertation Submitted to
The Graduate School of the University of Ulsan In partial Fulfillment of the Requirements
for the Degree of Master of Science
by
Nguyen Thi Kim Anh
Department of Chemical Engineering Ulsan, South Korea
November 2020
ABSTRACT
In this study, water-dispersible graphitic carbon nitride (g-C3N4) was synthesized through chemical oxidation of bulk g-C3N4 produced from different starting nitrogen-rich organic precursors such as dicyandiamide, melamine, urea, thiourea by thermal treatment and different thermal polymerization atmosphere (air, carbon dioxide and nitrogen). The effects of g-C3N4precursors and thermal polymerization atmosphere on water-dispersible g-C3N4 photocatalysts were investigated using several characterization tools and photocatalytic degradation of methylene blue (MB). Exfoliation of bulk g-C3N4 by chemical oxidation gave rise to the characteristic properties of water-dispersible g-C3N4 such as a high surface area, thin-layered morphology, an increase in band gap, and significant reduction in the recombination rate of photogenerated electron-hole pairs, which improved the photocatalytic activity of water-dispersible g-C3N4 for MB photodegradation. The photocatalytic activities of water-dispersible g-C3N4 photocatalysts were also strongly influenced by N-rich g-C3N4 precursors and thermal polymerization atmosphere for bulk g-C3N4. The presence of foreign atoms (sulfur, S) in thiourea induced the formation of sulfur-containing nano porous water-dispersible g-C3N4. The highest MB adsorption ability and charge separation efficiency of the S- containing nano porous water-dispersible g-C3N4 prepare in N2 atmosphere photocatalyst exhibited a synergistic effect on MB photodegradation, resulting in the highest photocatalytic activity.
ACKNOWLEDGEMENT
Firstly, I would like to express my attitude to my supervisor, Professor. Shin Eun Woo for giving me a greatly support, advice and motivation.
I would like to thank all my committee members, Professor. Won Mook Choi and Professor. Jin Suk Chung for their advice and contributions to this work.
I am also thankful to the Department of Chemical Engineering, Ms. Lim Kyung Jo and all staffs for your support in administrative works and experiments.
Thanks to all my former and present lab-mates, Ms. Pham Thanh Truc, Mr. Nguyen Phu Huy, Ms. Do Thi Lien, Mr. Jung Haewon, Mr. Jang Kaiming, Ms. Yu Hongan, Miss. Wang Mingyan, Mr. Dao Duc Quang, Mr. Kim Sangyoon for your supports and friendships.
I would like to sincerely thank all my friends in department of Chemical Engineering and from other departments in UOU for your unconditional support.
Thank to everyone who cross my path and change my whole direction.
CONTENT
ABSTRACT... i
ACKNOWLEDGEMENT... ii
CONTENT... iii
LIST OF FIGURES... v
LIST OF TABLES... viii
NOMENCLATURES... ix
1. INTRODUCTION... 1
1.1. Dye and its photocatalysis treatment methods... 1
1.2. Carbon nitride... 3
1.3. Chemical oxidation method.... 4
1.4. Precursors... 4
1.5. Thermal polymerization atmosphere.... 5
1.6. Objective of this study... 6
2. MATERIALS AND METHODS... 6
2.1. Preparation of bulk and water-dispersible g-C3N4... 6
2.2. Characterization... 8
2.3. Photocatalytic activity measurement... 9
3. RESULTS AND DISCUSSION... 10
3.1. Precursor effect... 10
3.1.1. Structural and chemical properties of the g-C3N4 photocatalysts... 10
3.1.2. The optical properties of g-C3N4 photocatalysts... 23
3.1.3. Adsorption and photocatalytic degradation of MB... 29
3.2. Effect of calcination atmosphere.... 37
3.2.1. Morphology and structure properties... 37
3.2.2. The Electronic and optical properties of g-C3N4 photocatalysts45 3.2.3. Adsorption ability and photocatalytic degradation of MB.... 49 4. CONCLUSIONS... 53 REFERENCES... 55
LIST OF FIGURES
Figure 1:Treatment method for dye removal in wastewater [2]... 2
Figure 2: Methylene blue structure ... 2
Figure 3:The chemical structures of g-C3N4 precursors. ... 4
Figure 4: Illustration of photocatalyst synthesis process ... 89
Figure 5: (A) The FTIR spectra and (B) the XRD patterns of water-dispersible and bulk g-C3N4 photocatalysts. ... 11
Figure 6:BET N2 adsorption/desorption isotherms of bulk (A) and... 14
Figure 7:The FE-SEM images of (A) TCb and (B) fTCp... 15
Figure 8: TEM images of TCb (A, B) and ... 17
Figure 9: XPS data of C 1s, O 1s, N 1s, and S 2p for the bulk and water- dispersible g-C3N4 photocatalysts... 19
Figure 10: Atomic ratios of sulfur and oxygen to carbon of bulk and water- dispersible g-C3N4 photocatalysts with different precursors. The ratios were calculated based on the XPS data. ... 22
Figure 11: The UV-Vis absorption spectra of (A) bulk g-C3N4, (B) water- dispersible g-C3N4, and Tauc plots of E (eV) and (α.h.ν)2 for (C) bulk g-C3N4and (D) water-dispersible g-C3N4... 24
Figure 12: Band diagrams of the bulk and water-dispersible g-C3N4 photocatalysts... 25
Figure 13: Time-resolved fluorescence decay spectra in the ns time scale for bulk and water-dispersible g-C3N4with excitation 400 nm (Inset table: radiative fluorescence lifetimes and their relative percentages of photoexcited charge carriers in all the photocatalysts). ... 27
Figure 14: (A) PL emission spectra of bulk g-C3N4and corresponding water- dispersible g-C3N4 (inset) and (B) The EIS Nyquist plots of the bulk and water- dispersible g-C3N4 photocatalysts... 28
Figure 15: Zeta potential analysis of bulk and water-dispersible g-C3N4 photocatalysts... 30
Figure 16:(A) Kinetic data of MB adsorption in the dark for the bulk and water- dispersible g-C3N4 photocatalysts and (B) corresponding pseudo-second-order
kinetic plots... 33
Figure 17: The effect of different precursors of bulk and water-dispersible g-C3N4 on MB photodegradation under visible-light irradiation (A: C/C0vs. t and B: ln(C/C0) vs t)... 34
Figure 18: A schematic illustration of the preparation of TCb and TCp photocatalysts... 35
Figure 19: Contact angles of a droplet of water on bulk and water-dispersible g- C3N4photocatalysts... 36
Figure 20: The recycle ability of TCp in three successive experiments for the photocatalytic degradation of MB under visible light irradiation. ... 36
Figure 21: The FTIR spectra (A) and XRD patterns (B) of bulk and water- dispersible g-C3N4 photocatalysts... 40
Figure 22:FESEM images of as-prepared samples... 41
Figure 23:TEM images of as-prepared samples... 41
Figure 24 The XPS data of C1s, N1s, O1s and S1p in g-C3N4. ... 44
Figure 25: PL emission spectra of bulk g-C3N4and corresponding water- dispersible g-C3N4 (inset) (A) and EIS Nyquist plots bulk g-C3N4and corresponding water- dispersible g-C3N4 (B)... 46
Figure 26: Time-resolved fluorescence decay spectra in the ns time scale for bulk and water-dispersible g-C3N4with excitation 400 nm (Inset table: radiative fluorescence lifetimes and their relative percentages of photoexcited charge carriers in all the photocatalysts). ... 47
Figure 27: The UV-Vis absorption spectra of (A) bulk g-C3N4, (B) water- dispersible g-C3N4, and Tauc plots of E (eV) and (α.h.ν)2 for (C) bulk g-C3N4and (D) water-dispersible g-C3N4... 48
Figure 28: Contact angle of water droplet on the bulk and water dispersible graphitic carbon nitride (1 the water as solvent in water dispersible graphitic carbon nitride was instead by ethanol, and spray on the surface of quartz on hot plate)... 50
Figure 29:(A) Kinetic data of MB adsorption in the dark for the bulk and water- dispersible g-C3N4 photocatalysts and (B) corresponding pseudo-second-order kinetic plots... 51 Figure 30:The effect of different calcination atmosphere on bulk and water- dispersible g-C3N4 on MB photodegradation under visible-light irradiation (A:
C/C0vs. t and B: ln(C/C0) vs. t)... 52
LIST OF TABLES
Table 1: The physical and optical properties of the prepared photocatalysts... 12 Table 2: Kinetic data for MB adsorption and photocatalytic degradation of the prepared photocatalysts. ... 31 Table 3: The physical and optical properties of the prepared photocatalysts. .... 42 Table 4: Kinetic data for MB adsorption and photocatalytic degradation of the prepared photocatalysts. ... 53
NOMENCLATURES
EIS Electrochemical Impedance Spectroscopy SEM Scanning electron microscope
TEM Transmission electron microscopy FT-IR Fourier Transform Infrared spectra FWHM Full width at half maximum
MB Methylene Blue
XPS X-ray photoelectron spectroscopy
XRD X-ray Diffraction
PL Photoluminescence
UV-Vis Ultraviolet–visible spectroscopy
Roman and greek letters
dp Pore diameter (nm)
Eg Optical band gap energy (eV)
kads Pseudo-second order adsorption rate constant (g/mg.min) kapp Apparent first order degradation rate constant (min-1) d Average crystallite size (nm)
qe Equilibrium adsorption capacity (mg/g) SBET Specific surface area (m2/g)
λ Wavelength (nm)
1. INTRODUCTION
1.1. Dye and its photocatalysis treatment methods
Textile and clothing industry are one of the most global industries present globally which is an essential part of human life. Textile industry is determined to be US$1 trillion, contributes 7% to total exports in the world and provide approximately 35 million job positions [1]. This industrial field has been rapidly increased in almost developing and undeveloped countries due to its profuse income and employments.
Beside the important role employment generation, textile and clothing industry are recognized as one main reasons of water pollution. It consumes a large amount of water, energy, and chemicals. The level of pollution in wastewater from bleaching and dyeing industry in general depends greatly on the type, amount of chemicals used, the texture of manufactured products (bleaching, dyeing, printing), the proportion of synthetic fibers, type of production technology (intermittent, continuous, or semi-continuous), characteristics of the machines used.
One of the most common contaminants in wastewater from textile and clothing factories is dye. Just a very small amount (< 1ppm) in wastewater is easily recognized contaminant due to its highly visible. These compounds can cause the variety of physiological and biochemical disturbance. In addition to water pollution, the waste gas from the textile and dyeing industry is dispersed into the environment such as steam, cotton dust, Cl, SO2, CO, and CO2. NOx… seriously affects human health. Most dyes are toxic, and some are also carcinogenic. For example, chlorine gas released from the washing step stimulates the respiratory tract and eye mucosa.
In high concentrations, chlorine can cause sudden death due to respiratory arrest and syncope, pulmonary edema, and chemical burns...
There are several techniques was investigated for wastewater treatment. They are included chemical, physical, and biological methods (Figure 1).
Figure 1:Treatment method for dye removal in wastewater [2]
Methylene blue (Figure 2) is one of the most common cationic dyes among synthetic dyes have many toxics effect for human body. It cannot degrade by itself in ambient environment without any catalysis support and remain in wastewater for a long time. It is necessary to treat this kind of dye completely in wastewater before release directly to environment.
Figure 2:Methylene blue structure
Recently, photochemical reactions have received much interest due to its wide application in organic compounds synthesis. One of the advantages is the reactions occur in the excited state where the molecules having a large excess of energy, whereas the thermodynamically take place in the ground state.
1.2. Carbon nitride
Among potential 2D materials, carbon nitrite is emerging as an interesting family of semiconductors. They have received considerable attention in recent years because of their potential for photocatalytic and water separator applications. from carbon nitrides that are semiconductors with a gap between 1.7 and 2.7 eV. They are made up of carbon, nitrogen, and hydrogen. They can be synthesized from inexpensive and metal-free starting materials, which is expected for many applications. They are determined by a high nitrogen to carbon ratio (N to C ratio>
first). Several reports have studied the flaking of these materials, although they typically focus on amorphous carbon nitrite types, while the layered, crystalline versions are less noticeable. Further development of these materials requires more in-depth structural description regarding their properties to optimize them for different applications. This thesis will focus on the synthesis and development of bulk graphitic carbon nitride.
Recently, graphitic carbon nitride (g-C3N4) received significant attention as a visible-light-driven photocatalyst [3–6]. As this metal-free polymeric n-type semiconductor exhibits a band gap of ca. 2.7 eV, high chemical stability in an ambient environment, and excellent sunlight harvesting capability [7], g-C3N4 has been widely used for photochemical water splitting [8–10], organic contaminant purification [11–13], photocatalytic CO2 reduction [10,14,15], and selective organic oxidation [16–18]. However, the photocatalytic performance of bulk g- C3N4 is limited due to i) fast recombination of photogenerated charge carriers; ii) hydrophobicity of the g-C3N4surface; iii) low specific surface area [19]. The three- dimensional layered structure of bulk g-C3N4 formed by the stacking of g-C3N4
nanosheets leads to a low specific surface area, resulting in the low adsorption ability of organic pollutants in an aqueous solution [20]. Additionally, the surface hydrophobicity of bulk g-C3N4 not only causes weak interaction between C3N4
nanosheet interlayers but also limits the contact angle of water molecules on a bulk g-C3N4 surface. Finally, the layered structure and hydrophobicity of bulk g-C3N4
significantly restrict electron transportation in g-C3N4, resulting in the fast
recombination of photogenerated charge carriers [21]. In the past decade, significant efforts have been made to improve the photocatalytic activity of bulk g- C3N4 photocatalysts to overcome disadvantages. These approaches include coupling with other inorganic semiconductors, doping of various metallic ions or non-metal ions, and morphological modulation [5,6,19,22–25].
1.3. Chemical oxidation method.
Exfoliation of bulk g-C3N4 is an advantageous approach for obtaining new physicochemical properties to promote photocatalytic efficiency. The chemical oxidation process of bulk g-C3N4can deliver exfoliation of C3N4nanosheets to form thin-layered g-C3N4 [26]. In addition, oxygen (O)-containing functional groups such as hydroxyl and carboxyl groups are introduced into the g-C3N4 surface by chemical oxidation treatment. In this way, the hydrophobicity of g-C3N4 can be modified, and the interfacial interaction and adsorption ability of C3N4nanosheets can be enhanced [19,26,27]. The formation of O-containing functional groups and exfoliated g-C3N4by chemical oxidation has already been proven in existing studies [26,27]. Li et al. prepared a water-dispersible g-C3N4 material by chemical oxidation with K2Cr2O7/H2SO4to confirm the existence of O-containing functional groups and the exfoliation of C3N4 nanosheets [26]. Oh et al. also synthesized water-dispersible thin-layered C3N4 nanodots that were oxidized in the chemical oxidation process [27].
1.4. Precursors
Figure 3:The chemical structures of g-C3N4 precursors.
Water-dispersible g-C3N4 photocatalysts are prepared via chemical oxidation from bulk g-C3N4that can be thermally synthesized from cheap nitrogen- rich organic precursors such as dicyandiamide (DCDA), melamine, urea, and thiourea in air or an inert gas environment [17,28,29]. During the thermal polymerization of N-rich chemicals to bulk g-C3N4, reaction pathways to g-C3N4
depend on their chemical structures (see Scheme 1). Depending on the starting N- rich organic precursors, the structural and optical properties of the resultant bulk g- C3N4can be controlled [30]. Moreover, even in a g-C3N4composite with inorganic materials, N-rich chemicals are an important factor for g-C3N4 in terms of influencing their structural properties and photocatalytic activity [7,31]. In particular, when different g-C3N4 precursors include specific foreign chemical elements such as O and sulfur (S), foreign atoms with a different C/N ratio chemically bonded to the C3N4structure will exhibit a strong effect on the formation of chemical functional groups, surface morphology, and optical properties including band-gap [32]. However, despite many reports describing the effect of different g-C3N4precursors on photocatalytic performance and the properties of g- C3N4-based photocatalysts, to our knowledge, the effect of N-rich organic g-C3N4
precursors on water-dispersible g-C3N4 has not been reported. The difference in bulk g-C3N4 prepared from various g-C3N4 precursors can affect photocatalytic behavior and the properties of water-dispersible g-C3N4 photocatalysts. Therefore, understanding how the different g-C3N4 precursors used for preparing bulk g-C3N4
can influence the photocatalytic behavior of water-dispersible g-C3N4
photocatalysts is necessary.
1.5. Thermal polymerization atmosphere.
Recently, changing morphology of g-C3N4 without any additional template or combination with other metal or metal oxide was received many attentions as a means of metal-free and cost-effectively. It is well known that optical, electronic, photocatalyst properties, morphological and photocatalyst properties of graphitic carbon nitride can be deeply affected by the thermal polymerization atmosphere [33]. In this study, bulk graphitic carbon nitride was synthesized from thiourea in
different gas atmosphere such as air, nitrogen, carbon dioxide, then water dispersible graphitic carbon nitride was synthesized from these bulks. It is necessary to understand the dependence of photocatalytic properties of g-C3N4 on porosity, chemical structure, and optical morphologies.
1.6. Objective of this study
In this work, we investigated the influence of different N-rich g-C3N4
precursors, thermal polymerization atmosphere on the formation of water- dispersible g-C3N4 and their physicochemical properties. The photocatalytic behavior of water-dispersible g-C3N4 and bulk g-C3N4 photocatalysts were examined via methylene blue (MB) photodegradation under visible light irradiation.
Irrespective of N-rich g-C3N4 precursors, chemical oxidation improved photocatalytic activity because thin-layered water-dispersible g-C3N4
photocatalysts exhibited higher adsorption capacity and a lower recombination rate of photogenerated charge carriers compared with bulk g-C3N4 photocatalysts.
Thermal polymerization atmosphere directly impacts to optical properties of g- C3N4. Among the g-C3N4precursors in this work, thiourea in N2flow served as the best water-dispersible photocatalyst. The existence of S-atoms in the thin-layered water-dispersible g-C3N4 photocatalysts not only increased adsorption capacity for the highest specific surface area but also suppressed the recombination process of photogenerated electro-hole pairs with the lowest photoluminescence (PL) emission and EIS peak intensity.
2. MATERIALS AND METHODS
2.1. Preparation of bulk and water-dispersible g-C3N4
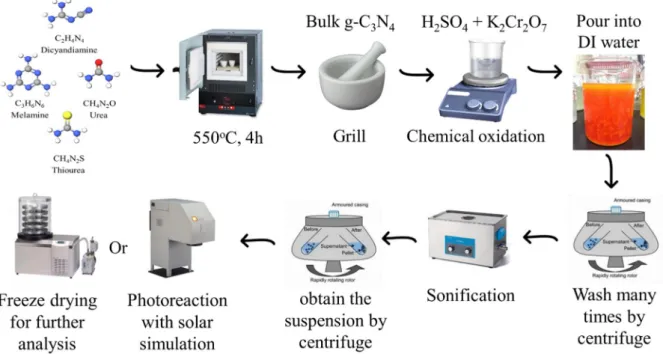
Analytical grade precursors were purchased from Sigma Aldrich Korea (Gyeonggi, South Korea) and used without additional purification. The bulk graphitic carbon nitride was synthesized by thermally polymerizing different precursors of DCDA, melamine, urea, and thiourea. Powder precursors were contained in a crucible covered with aluminum foil and then placed in a muffle furnace at 550°C for 4 h (ramping rate = 5°C/min). The obtained solid was removed at ambient temperature and then ground in a mortar for 15 min. The bulk g-C3N4
samples were denoted as DCb, MCb, UCb, and TCb, corresponding to the precursors DCDA, melamine, urea, and thiourea, respectively.
Following the above treatment, bulk g-C3N4 was used to synthesize water- dispersible g-C3N4 by the chemical oxidation method, the procedure for which is described elsewhere [29,30]. Typically, a mixture of 10 g of K2Cr2O7and 50 ml of H2SO4 (98%) is stirred in a 100 ml flask until the color of the solution turns brown.
For the current study, 0.5 g of bulk g-C3N4 was added to the above solution. After thorough stirring for 2 h at room temperature, the mixed solution was poured slowly into 400 ml deionized water and cooled to room temperature. After removing supernatant liquid by centrifugation at 8,000 rpm, the obtained solid was washed with water and again dispersed in deionized water with sonication for 2 h. Finally, the solution was centrifuged at 3,000 rpm to remove all undispersed g-C3N4. The four supernatant liquid samples of water-dispersible g-C3N4 with different precursors were checked regarding the ratio of solids per liquid and adjusted to the same concentration (5 mg mL−1). The freeze-drying method was applied to collect solid samples from supernatant liquids for further analysis. In this study, g-C3N4
photocatalysts were designated as DCp, MCp, TCp, and UCp. The freeze-dried samples were labeled fDCp, fMCp, fTCp, and fUCp, corresponding to the precursors DCDA, melamine, urea, and thiourea, respectively.
Bulk in different calcination atmosphere air, nitrogen, CO2and theirs water dispersible g-C3N4 was systhesis with the same procedure and designed as ATb, CTb, NTb for bulk form, ATw, CTw, NTw for water dispersible form, fATw, fCTw, fNTw from freeze drying form. The synthesis process is described in Figure 4.
Figure 4: Illustration of photocatalyst synthesis process
2.2. Characterization
Field-emission scanning electron microscopy (FE-SEM; JSM-600F JEOL, Tokyo, Japan) was employed to analyze the morphologies of photocatalysts. A N2
adsorption–desorption technique using a QUADRASORB™ SI Surface Area and Pore Size Analyzer (Quantachrome Instruments, Boynton Beach, FL, USA) was applied to measure the specific surface areas of the prepared materials using the Brunauer–Emmett–Teller (BET) equation. The crystalline structures of the obtained products were determined via X-ray diffraction (XRD) using a Rigaku D/MAZX 2500 V/PC high-power diffractometer (Rigaku Corp., Tokyo, Japan) and a Cu Kα X-ray source with a wavelength of λ = 1.5415 Å in the scanning range of 10–90° and a scan rate of 2° (2θ)/min. A Nicolet 380 Fourier transform infrared (FTIR) spectrometer (Thermo Scientific Nicolet iS5 with an iD1 transmission accessory, Waltham, MA, USA) was applied to verify functional groups. The X- ray photoelectron spectroscopy (XPS) measurement was tested on a Thermo Scientific K-Alpha system (Waltham, MA, USA) to measure the elemental composition, empirical formula, chemical state, and electronic state of elements.
Optical properties of the photocatalysts were observed via ultraviolet-visible (UV- Vis) diffuse reflectance (SPECORD 210 Plus spectroscope, Analytik Jena, Germany). Photoluminescence spectroscopy was conducted to test the recombination rate of charges using a Cary Eclipse fluorescence spectrophotometer (Agilent Technologies, Santa Clara, CA, USA) with a 473 nm diode laser at room temperature. Zeta potential measurements for photocatalysts were carried out using a zeta potential analyzer (Zetasizer Nano ZS, Malvern Panalytical, Malvern, United Kingdom). Five milligrams of photocatalyst powder were dispersed into 100 ml of an aqueous solution, and then the solution was sonicated for 30 min. The zeta potential of each sample suspension was measured three times at a specific pH value.
The isoelectric point (IEP) of each sample was obtained from the plot of zeta potential vs. pH. The pH of the sample suspension was adjusted from 2 to 9 by adding 0.5 M HCl or NaOH solution. The IEP value was measured as the pH value where a zeta potential of the sample was zero. Contact angles of a droplet of water on photocatalysts were measured by a contact angle meter (SmartDrop, FEMTOBIOMED Co., Seoungnam, South Korea) via the SmartDrop software.
Time-resolved fluorescence spectra were measured under 400-nm laser excitation by a FS5 spectrofluorometer (Edinburgh Instruments Ltd, Livingston, UK) for more confirmation of photogenerated charge separation efficiency. The emission decay profiles were fitted by tri-exponential functions.
2.3. Photocatalytic activity measurement
Photocatalytic activities were evaluated by the degradation of a MB aqueous solution (Riedel-de Haen, Germany; initial concentration = 10 ppm). Furthermore, 10 mg of as-prepared water-dispersible catalysts were immersed in a 50 ml MB solution that was continuously stirred by a magnetic bar in the dark for 30 min.
After achieving equilibrium adsorption, the solution was irradiated for 180 min using an Oriel's Sol1A™ Class ABB system with a 140 W xenon lamp and UV cut- off/correction filter. For each analysis, 1 ml of MB solution was collected by syringe from the beaker and filtered by a polytetrafluoroethylene membrane filter (Whatman GmbH, Dassel, Germany). The MB concentrations in the liquid samples
were analyzed by absorbance at λmax= 664 nm as a function of irradiated time (using a SPECORD 210 Plus spectroscope).
3. RESULTS AND DISCUSSION 3.1 Precursor effect
3.1.1 Structural and chemical properties of the g-C3N4photocatalysts The FTIR spectra for freeze-dried samples of water-dispersible and bulk g- C3N4 photocatalysts from different precursors are shown in Fig. 1A. All samples present similar FTIR band features, indicating successful evolution of the g-C3N4
structure. An intense band at 808 cm−1 represents the vibration of heptazine rings, which is a specific characteristic peak of g-C3N4[32]. Absorption bands in the range of 1200–1600 cm−1 are ascribed to the typical stretching vibration modes of the aromatic C-N [34]. Broad bands at 3000–3300 cm−1are the result of N-H vibration corresponding to the residual uncondensed amino components and O-H stretching vibration modes from adsorbed water molecules [35]. It is noted that bands’
intensity at 3000–3300 cm−1 for the water-dispersible g-C3N4 photocatalysts are significantly lower compared with bulk g-C3N4. This may have been caused by a reduction in the residual uncondensed amino components and adsorbed water molecules via a residual acid removal process. Additionally, these bands are slightly blue-shifted and broadened following chemical oxidation, implying that O- containing species additionally influences aromatic C-N stretching in the g-C3N4
structure, due to the addition of C-O and C = O functional groups. This is subsequently confirmed in XPS data.
Figure 5: (A) The FTIR spectra and (B) the XRD patterns of water-dispersible and bulk g-C3N4photocatalysts.
In XRD patterns (Figure 5), all samples exhibit two typical diffraction peaks, indicating the successful synthesis of g-C3N4 by thermal polymerization from four different precursors. A strong peak at approximately 27.7° of 2θ is assigned as the (002) plane of g-C3N4 (JCPDS 87-1526), which typically originates from the presence of interlayer stacking reflections as a graphitic structure [36,37]. A low angle reflection of (100) plane of g-C3N4 at 13° of 2θ stems from lattice planes parallel to the c-axis. In Figure 5, the freeze-dried samples of water-dispersible g- C3N4 and their bulk g-C3N4demonstrate XRD peaks at almost the same positions, suggesting that the freeze-dried samples exhibit the same crystal structure as bulk g-C3N4. However, the peaks at 27.7° of 2θ for the freeze-dried samples of water- dispersible g-C3N4 are weaker and broader compared with bulk g-C3N4. This indicates the thin-layered structure of the inter-planar stacking of g-C3N4. The chemical oxidation etching and sonication of bulk g-C3N4 concurrently decrease the multiple-layered structure of bulk g-C3N4, giving rise to the thin-layer structure of the freeze-dried samples of water-dispersible g-C3N4 [26]. The reduction in the interplanar structure of g-C3N4 can shorten the charge transport distance from the interlayers to the surface, which is beneficial for charge separation in the photocatalysts.
Table 1: The physical and optical properties of the prepared photocatalysts.
Sample name
SBET
(m2/g)a
V (cm3/g) a
L (nm) a
Band gap (eV) b
DCb 21.1 0.046 4.33 2.97
MCb 21.1 0.164 15.52 3.05
TCb 25.9 0.206 15.84 2.95
UCb 78.9 0.134 28.70 2.72
fDCp 35.3 0.317 17.94 3.43c
fMCp 32.9 0.247 15.48 3.43c
fTCp 71.1 0.489 13.76 3.56c
fUCp 55.2 0.453 16.44 3.58c
aSpecific surface area, pore volume, and average pore size were determined via N2
adsorption–desorption isotherm measurements.
bEstimated band gaps were obtained from UV-Vis spectra.
cThe band gaps were measured using water-dispersible g-C3N4samples.
The physical properties of the prepared photocatalysts are shown in Table 1. In this study, multiple-layered bulk g-C3N4 is delaminated into thin layers of water-dispersible g-C3N4 by chemical oxidation. In Table 1, the freeze-dried samples of water-dispersible g-C3N4 show higher specific surface areas (SBET) compared with the corresponding bulk g-C3N4. Among the precursors, the specific surface areas of the freeze-dried thiourea and urea samples (71.1 m2/g for fTCp and 55.2 m2/g for fUCp, respectively) are much higher than those gained from DCDA and melamine (35.3 m2/g for fDCp and 32.9 m2/g for fMCp). This can be explained by the formation of soft bubbles (H2S, CO2, CS2, and NH3gases) during the thermal condensation of thiourea and urea at high temperature over an extended period [32].
The soft bubbles burst and enlarge the surface areas of the bulk g-C3N4
photocatalysts (TCb and UCb) during thermal polymerization, which is consistent with previous observations [7,31]. The intercalation and exfoliation by hydrophilic functional groups in the chemical oxidation readily occur on the soft layers of enlarged TCb and UCb. However, the corresponding N2 adsorption/desorption isotherms of bulk and water-dispersible g-C3N4 are plotted in Figure 6. All the isotherms represent type III patterns.
Figure 6:BET N2adsorption/desorption isotherms of bulk (A) and water-dispersible (B) g-C3N4
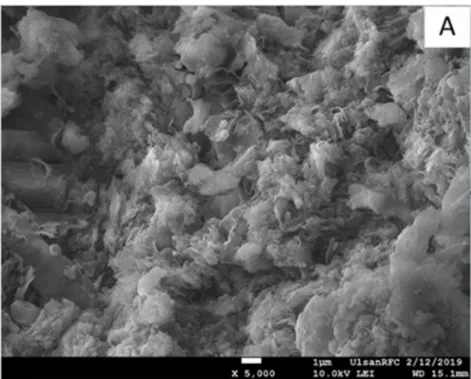
Figure 7:The FE-SEM images of (A) TCb and (B) fTCp.
The morphological change of g-C3N4 by chemical oxidation is limitedly observed in FE-SEM images. Figure 7 shows FE-SEM images of TCb and fTCp that represent bulk and freeze-dried g-C3N4 photocatalysts, respectively, since the morphology of the water-dispersible g-C3N4 photocatalysts cannot be measured directly. In Figure 7, TCb exhibit a two-dimensional lamellar structure with layers and pleats. Following chemical oxidation treatment and the subsequent freeze- drying process, the layers of the g-C3N4 structure are slightly decreased. This indicates good agreement with the XRD results of this study. Since the freeze- drying process can re-densify the layers of water-dispersible g-C3N4 via the Π-Π stacking effect and O-containing functional groups’ bonding interaction, actual layers of the water-dispersible g-C3N4 photocatalysts become thinner than those shown in the image.
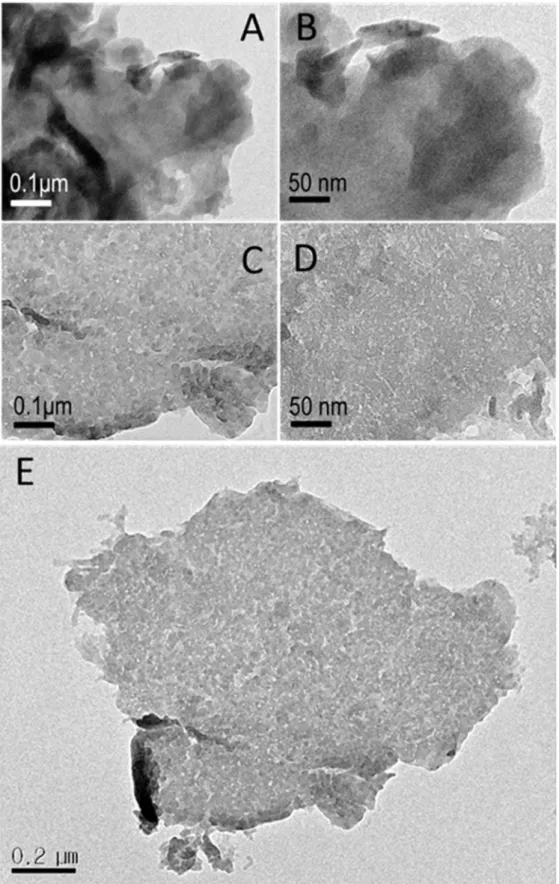
Figure 8: TEM images of TCb (A, B) and TCp (C, D, E) with different magnification.
Figure 9: XPS data of C 1s, O 1s, N 1s, and S 2p for the bulk and water- dispersible g-C N photocatalysts.
The morphologies of TCb and TCp were additionally investigated by a TEM measurement (Figure 8). While the bulk TCb photocatalyst shows a stacked and convoluted lamellar structure, the chemical oxidation treatment produces the thinner layers with many tiny nanoholes in the TCp photocatalyst owing to the oxidative etching. A schematic illustration of the chemical oxidation process from TCb to TCp is depicted in Figure 18. The exfoliation of the bulk TCb photocatalyst generates a thin layer structure of TCp. In addition, the chemical etching induces many tiny nanoholes and S-insertion into C3N4 structure of TCp, resulting in the highest specific surface area (SBETof TCp = 77.1 m2/g).
In Figure 9, XPS data of C 1s, N 1s, O 1s, and S 2p for the freeze-dried water- dispersible and bulk g-C3N4photocatalysts are displayed to further elucidate the chemical composition of the samples and for investigating the local structural state of each element. Based on the XPS data of all freeze-dried samples, the calculated atomic ratios of C/N are 0.79, 0.72, 0.78, and 0.75 for fUCp, fTCp, fMCp, and fDCp, respectively. These values are close to a theoretical C/N value (0.75) of g-C3N4. The C 1s XPS data of all samples are presented in Figure 9. Here the C 1s spectrum of fTCp is deconvoluted into four peaks centered at 284.5, 286.1, 288.0, and 289.2 eV, respectively. The three main peaks at 286.1, 288.0, and 289.2 eV are assigned as carbons of C = NH2, N = C-N, and COOH in the g-C3N4 structure, respectively, whereas a peak at 284.5 eV is labeled the C = C coordination of carbon impurities or defects of sp2-hybridized carbon atoms in the samples [31]. The C 1s spectrum of TCb shows only three deconvoluted peaks at 284.5, 286.1, and 288.0 eV, which ostensibly shows that O-containing functional groups have been introduced into the water-dispersible g-C3N4photocatalyst after chemical oxidation.
Figure 9 also depicts expanded O 1s XPS data for fTCp and TCb, and intensity ratios of O-species in the deconvoluted O 1s peaks for all photocatalysts. For the bulk g-C3N4 photocatalysts (TCb), only one O peak is detected at 532.3 eV, assigned as adsorbed water [38]. For fTCp, three more peaks are additionally detected at 530.4, 531.5, and 533.1 eV, contributed by COOH, C = O, and C-OH groups, respectively [26]. These various O-deconvolution peaks indicate that, with the exception of adsorbed water, several O-containing functional groups are
generated on the surface of g-C3N4 because of the chemical oxidation of bulk g- C3N4. The N1s XPS spectra for photocatalysts are deconvoluted into three peaks at 398.3, 399.7, and 401.1 eV, which are assigned as the sp2-bonded nitrogen of the C-N = C group, the tertiary nitrogen of N-(C)3, and the amino-functional groups (C-N-H) corresponding to incomplete condensation, respectively [36,38].
Interestingly, no new nitrogen peaks in the N 1s XPS data occur, even after chemical oxidation of bulk g-C3N4 from different precursors, whereas new C and O peaks are assigned in the O 1s and C 1s XPS data. This means that the O-species introduced into g-C3N4 during the chemical oxidation interacts with carbon but not nitrogen in the g-C3N4 structure, resulting in C-O bonding in the water-dispersible g-C3N4photocatalysts. Moreover, S 2p XPS data for TCb and fTCp were collected and S 2p spectra were fitted into five peaks at 163, 166.4, 167.5, 168.4, and 169.4 eV. The binding energy of S 2p in N-S bonds is found at roughly 163 eV. A peak at 166.4 eV represents the C-S bond, where nitrogen is replaced with S-atoms in the aromatic ring. The XPS peaks in the region of 168−170 eV correspond to the presence of sulfite species such as SO32− and SO42− [31,39–41]. Overall, the XPS peaks for S 2p reflect the incorporation of S-atoms into the g-C3N4 lattice. The atomic content of the S-element is calculated as 0.76 wt% for the fTCp sample. The S-content in the fTCp sample is higher than in the TCb sample, implying that chemical oxidation increases the S-concentration in TCp. However, although the weight percent of sulfur in TCp is small in the range from 0.03 to 1 wt%, it proves to be effective for the improvement of photocatalytic performance of g-C3N4 [39–
43].
Figure 10: Atomic ratios of sulfur and oxygen to carbon of bulk and water- dispersible g-C3N4photocatalysts with different precursors. The ratios were
calculated based on the XPS data.
Figure 10 shows the atom ratios of sulfur and oxygen to carbon in bulk and water-dispersible g-C3N4 photocatalysts, which are calculated from the XPS data.
The effect of the chemical oxidation treatment strongly depends on the precursors of bulk g-C3N4. Before chemical oxidation treatment, only TCb contains sulfur atom (0.11 at% S per total atom) in the g-C3N4structure, which is moved from the thiourea precursor whereas no S atom is detected in other bulk g-C3N4 structures (Figure 10A). After the chemical oxidation, a certain amount of sulfur-containing groups is introduced into all of the water-dispersible g-C3N4 photocatalysts due to sulfuric acid in the solvent. Specially, fTCp shows the highest sulfur-to-carbon ratio (S/C). In Figure 9, the additional S in fTCp exists in a sulfur- and oxygen- containing functional group. Figure 10B depicts the atom ratios of oxygen to carbon before and after the chemical oxidation. The oxygen-to-carbon ratios increase after the chemical oxidation. Specially, the O/C value for fTCp from thiourea increases by 2.84 times, compared with that of the corresponding bulk TCb.
As mentioned above, thiourea in the thermal polymerization process to bulk g-C3N4
releases soft bubbles, resulting in the generation of S-containing defect sites in the C3N4 structure of TCb, which plays an important role in the chemical oxidation process. The sulfur-containing defect sites can be easily oxidized due to the chemical oxidative etching, leading to generation of nanoholes with more sulfur and oxygen-containing function groups in fTCp (Figure 18).
3.1.2 The optical properties of g-C3N4photocatalysts
The optical behavior of photocatalysts results in an important impact on photodegradation reactions. The UV-Vis spectra for all photocatalysts were collected to investigate the optical properties of absorption edge and band gap (Figure 11). First, the absorption peak positions of all prepared photocatalysts are located in the UV range, and their shoulders tail to the visible range. Band-gap values were estimated by the Tauc’s plot gained from the UV-Vis spectra.
Figure 11: The UV-Vis absorption spectra of (A) bulk g-C3N4, (B) water- dispersible g-C3N4, and Tauc plots of E (eV) and (α.h.ν)2 for (C) bulk g-C3N4and
(D) water-dispersible g-C3N4.
The estimated band gap values are listed in Table 1. The band gaps of bulk g-C3N4 are approximately 2.7–3.0 eV, which is applicable for MB photodegradation. Following chemical oxidation, the water-dispersible g-C3N4
photocatalysts exhibit larger band gap values in the range of 3.4–3.5 eV, which is caused by g-C3N4 exfoliation from a bulk structure to thin layers. The quantum confinement effect increases the band gap of g-C3N4 [44]. Theoretically, the valence band edge potential (EVB) and the conduction band edge potential (ECB) of semiconductor materials can be calculated using the following equations:
= − + 0.5
= −
where EVB, ECB, X, EC, and Eg are the edge potentials of the valence band (VB) and conduction band, Mulliken’s absolute electronegativity (defined by the geometric average of the absolute electronegativity of the constituent atoms), the energy of the free-electron at the hydrogen scale (approximately 4.5 eV), and the band gap of semiconductors, respectively [45–47]. The X-value for g-C3N4 was calculated as 4.67 eV [48]. Based on this calculation, band diagrams of the bulk and water-dispersible g-C3N4 photocatalysts are plotted in Figure 12.
Figure 12: Band diagrams of the bulk and water-dispersible g-C3N4
Figure 14 shows the PL spectra under an excitation wavelength of 340 nm for the bulk and water-dispersible g-C3N4 photocatalysts. The PL emission peaks centered at roughly 420–490 nm for all photocatalysts originate from direct band- to-band transitions. Compared with the PL emission peak position for the bulk g- C3N4, the positions of PL emission peaks for water-dispersible g-C3N4 tend to be blue-shifted; this can also be explained by the quantum confinement effect resulting from the opposite shift between the conduction and valence bands [44,49].
Moreover, in Figure 14, the PL emission peak intensities of the water-dispersible g-C3N4 photocatalysts are much lower compared with those for bulk g-C3N4. The PL emission behavior is linked to the separation (or recombination) process of photo-induced electron and hole pairs. The exfoliation of bulk g-C3N4 to thin- layered water-dispersible g-C3N4 induces a decrease in PL emission intensity, which implies the suppression of the recombination process of photo-induced electron-hole pairs in the water-dispersible g-C3N4 photocatalysts. This interpretation can be applied to the precursor effect on water-dispersible g-C3N4
photocatalysts. The PL intensity at 448 nm for TCp is the lowest among the water- dispersible g-C3N4 photocatalysts (Figure 14), indicating the slowest recombination rate in TCp. The S-dopants in TCp generated from thiourea during the thermal polymerization and subsequent chemical oxidation can decrease the electron-hole recombination by helping the migration of excited electrons to active sites for the photocatalytic reaction [40,43].
For confirmation of the separation efficiency of photogenerated charge carriers, time-resolved fluorescence spectra were measured under 400-nm laser excitation and the emission decay profiles were fitted by tri-exponential functions (Figure 13). The inset table in Figure 13presents three radiative lifetimes τ1, τ2, τ3
and their percentages A1, A2, A3 with the average lifetime (τav) values. The calculated average lifetime values are 4.55, 5.09, 5.57, and 5.67 ns for DCb, MCb, TCb, and UCb and 5.96, 7.51, 11.71, and 7.59 ns for DCp, MCp, TCp, and UCp, respectively. After the chemical oxidation, the average lifetime of photoexcited charge carriers becomes prolonged and specially, TCp has the longest value at 11.71 ns. These results match well the PL emission data. However, the S-dopant
effect is valid for water-dispersible g-C3N4 not for bulk g-C3N4, since the PL emission intensity of TCb is larger than that of UCb in this study.
Figure 13: Time-resolved fluorescence decay spectra in the ns time scale for bulk and water-dispersible g-C3N4 with excitation 400 nm (Inset table: radiative fluorescence lifetimes and their relative percentages of photoexcited charge
carriers in all the photocatalysts).
Figure 14: (A) PL emission spectra of bulk g-C3N4 and corresponding water- dispersible g-C3N4 (inset) and (B) The EIS Nyquist plots of the bulk and water-
dispersible g-C3N4photocatalysts.
Electrochemical impedance spectroscopy (EIS) was also employed to investigate the photo-induced charge separation process on photocatalysts [50].
Figure 14B presents EIS Nyquist plots for the bulk and water-dispersible g-C3N4
photocatalysts. In these plots, the smaller arc radius indicates a smaller electron transfer resistance that enhances the effective separation of photo-induced electron−hole pairs and electron transfer in the photocatalytic degradation process [51]. The arc radii on the EIS Nyquist plots of water-dispersible g-C3N4 are much smaller compared with bulk g-C3N4. This phenomenon reveals that the water- dispersible g-C3N4 results in a higher separation efficiency for photogenerated electrons and holes compared with bulk g-C3N4. Among the water-dispersible g- C3N4 photocatalysts, fTCp shows the smallest values, which wholly matches the PL emission data in this study. Combining the EIS results with the PL emission data indicates that the water-dispersible g-C3N4 photocatalysts produce a slow recombination rate for photogenerated electron-hole pairs compared with the bulk g-C3N4. Furthermore, among the water-dispersible photocatalysts, S-containing photocatalyst (TCp) exhibits the best charge separation efficiency. Reduction in charge transfer resistance and enhancement in charge mobility can promote photo- induced carrier diffusion over longer distances; this enables more carriers to move to active sites to participate in photocatalytic reactions prior to recombination [52].
3.1.3 Adsorption and photocatalytic degradation of MB
Zeta potential measurement were conducted to investigate the surface charge of bulk and water-dispersible g-C3N4 in aqueous suspensions and their results are shown in (Figure 15). The IEP values of all the samples are between 3.5 and 4.5, indicating that the electrostatic interaction between MB, a cationic dye, and the photocatalysts takes place. The negatively charged surfaces of bulk and water- dispersible g-C3N4in the aqueous solution are suitable for the MB photodegradation test in this study.
Methylene blue adsorption kinetic experiments were conducted in a dark
investigated for 30 min at ambient temperature. Adsorption kinetic data obey the pseudo-second-order kinetic model, and the adsorption capacities of MB are calculated from the slope and intercept of plots t/qt and t as follows:
= 1
+ 1
where qt(mg/g) is the MB amount adsorbed on the photocatalyst at specific time t, qe(mg/g) is the MB amount adsorbed on the photocatalyst at equilibrium, and kads
(g/mg min) is the adsorption rate constant following the pseudo-second-order kinetic model, respectively [31]. The qeand kadsvalues fitted from the equation are listed in Table 2.
Figure 15: Zeta potential analysis of bulk and water-dispersible g-C3N4
photocatalysts.
Table 2: Kinetic data for MB adsorption and photocatalytic degradation of the prepared photocatalysts.
Sample
Adsorption kinetics Photocatalytic kinetics qe(mg/gcat)
a
kads(g/mg.min) a r2 a kapp× 103(min−1)
b
r2 b
DCb 49.11 0.0194 0.9890 2.3 0.9757
MCb 40.01 0.0205 0.9974 3.0 0.9848
TCb 52.68 0.0157 0.9898 3.9 0.9848
UCb 58.66 0.0140 0.9983 4.2 0.9989
DCp 104.38 0.0096 0.9888 13.0 0.9828
MCp 134.37 0.0074 0.9995 15.2 0.9660
TCp 277.45 0.0035 0.9989 25.1 0.9703
UCp 193.12 0.0051 0.9985 24.9 0.9817
aEquilibrium adsorption capacities and pseudo-second-order adsorption rate constants were determined from the slope and intercept of the plot of (t/qt) = f(t).
bApparent first-order reaction rate constants and corresponding determination coefficients were evaluated from the slope of MB photodecomposition by the pseudo-first-order reaction model ln(C/Co) = -kappt.
As shown in Figure 16, MB adsorption onto all photocatalysts reaches maximum adsorption within 10 min. The high determination coefficient values (r2
> 0.96) in Table 2 imply that this adsorption system adopts the pseudo-second- order kinetic model. In Table 2, the adsorption capacities of water-dispersible g- C3N4 photocatalysts are much higher compared with bulk g-C3N4. The highest adsorption capacity is observed for TCp (qe = 277.45 mg/g) with an adsorption capacity order of UCp (193.12 mg/g) > MCp (134.37 mg/g) > DCp (104.38 mg/g),
while the adsorption capacities of bulk g-C3N4 are in the range of 40-60 mg/g. The enhanced adsorption capacities of the water-dispersible photocatalysts are ascribed to an increase in specific surface area and to the introduction of functional groups via exfoliation of the chemical oxidation process. The bulk g-C3N4 photocatalysts exhibit a small specific surface area and hydrophobic properties leading to low MB adsorption capacity. The chemical oxidation process generates not only a thin- layered structure with a high specific surface area but also O or S-containing functional groups, as supported by the XPS data. These functional groups also increased organic dye adsorption ability [19]. In particular, the existence of S-atoms on the surface of TCp (with the highest surface area) leads to strong enhancement in MB adsorption [42].
To test the photocatalytic activity of photocatalysts, MB photodegradation was examined under simulated visible irradiation for 180 min (Figure 17). The kinetics of the MB photodegradation were estimated by the apparent-first-order reaction model as follows:
= −
where t, kapp, Co, and C are reaction time, apparent rate constant, MB concentration at the absorption-desorption equilibrium, and actual MB concentration at reaction time t, respectively. The reaction rate constant (kapp) was obtained from the slopes of plots of ln(C/Co) vs t [31]. The values of kappand determination coefficients (r2) are summarized in Table 2. The r2 values are higher than 0.98, indicating that the reaction rate constants of all reactions show good fit with the apparent-first-order reaction model. Similar to adsorption capacities, the kapp values (0.0130–0.0251 min−1) for water-dispersible photocatalysts are significantly higher compared with bulk photocatalysts (0.0023–0.0042 min−1). Again, TCp produces the highest kapp
value at 0.0251 min−1among water-dispersible g-C3N4photocatalysts, indicating it as the best photocatalyst in this study.
Figure 16:(A) Kinetic data of MB adsorption in the dark for the bulk and water- dispersible g-C3N4photocatalysts and (B) corresponding pseudo-second-order
kinetic plots.
Figure 17: The effect of different precursors of bulk and water-dispersible g-C3N4
on MB photodegradation under visible-light irradiation (A: C/C0vs. t and B:
ln(C/C0) vs t).
Figure 18: A schematic illustration of the preparation of TCb and TCp photocatalysts.
Figure 19: Contact angles of a droplet of water on bulk and water-dispersible g- C3N4 photocatalysts.
Figure 20: The recycle ability of TCp in three successive experiments for the photocatalytic degradation of MB under visible light irradiation.
Figure 18 illustrates the features of the TCp photocatalyst, i.e., a S- containing thin-layered g-C3N4 structure with a high specific surface area. In the thermal polymerization of thiourea, S-containing bulk g-C3N4 (TCb) was synthesized. The successive chemical oxidation process of TCb produced a thin- layered g-C3N4photocatalyst containing S and O-atoms (TCp). The thin-layered g- C3N4structure gave rise to the high specific surface area. The combination of S and O-containing functional groups, along with the thin-layered structure, caused the highest MB adsorption capacity of TCp (Table 2). Data for contact angles of a droplet of water on the photocatalysts are additionally provided in Figure 19. The lower contact angle means the higher hydrophilicity surface property, indicating the successful introduction of various hydrophilic functional groups onto the surface of g-C3N4 after the chemical oxidation and their influence on the surface of g-C3N4. Furthermore, these features of TCp influenced optical properties as evidenced by the PL emissions and EIS data. Based on the PL and EIS data, TCp exhibited the highest separation efficiency of photo-induced electron-hole pairs, resulting in the best photocatalytic performance for MB photodegradation.
Recycled testing results for the photocatalytic activity of the TCp sample are shown in Figure 20. After three successive cycles, the photocatalytic activity efficiency decreased slightly, revealing the pronounced stability of the TCp photocatalyst.
3.2 Effect of calcination atmosphere.
3.2.1 Morphology and structure properties
Fourier transform infrared (FTIR) spectroscopy was used to investigate the functional groups in graphitic carbon nitride structure (Figure 21 A). The FTIR spectra of all prepared g-C3N4samples show similar three characteristic absorption bands at 808, 1200 - 1700, and 3000 - 3500 cm-1. The sharp peak at 808 cm-1 is attributed to the triazine units breathing vibration. The strong bands at 1200 - 1700 cm-1 originate from the stretching vibration of aromatic heterocycles [53]. The broaden peaks ranging from 3000 to 3500 cm-1 are assigned to the stretching
vibration of N-H bonds and adsorbed water molecules [53]. Theses broaden peaks make it difficult to distinguish contribution
between amine groups and adsorbed water molecules. In addition, after chemical oxidation treatment these bands tend to blue-shifted and broaden indicate that the addition of oxygen functional groups C-O and C=O in the aromatic ring system of g-C3N4.
The crystal of all prepared g-C3N4 sample was characterized by XRD (Figure 21 B). There are two main characterized peaks positions at around 2θ = 13.1o and 2θ
= 27.6o. The low-angle reflection XRD peak at 13.1o (1 0 0) originated from in- planar packing of heptazine units. The strong peak ar 27.6o(0 0 2) is assigned to inter-planar stacking of π-conjugated aromatic systems. The (0 0 2) peak intensity is highest with material prepared under air flow, in CO2 and N2 flow remarkably decrease. This decrease maybe attribute to the inhibit crystal growth during thermal polymerization of N2 flow [54]. FTIR and XRD spectra basically suggest that they have the same chemical structure of g-C3N4 when be treated under different atmospheres.
The morphological characteristics of all as-prepared g-C3N4 samples were studied by FESEM (Figure 22) and TEM (Figure 23). The SEM images show the stacking particles in micrometer size with irregular shapes. The TEM images show the lamellar structure with wrinkled corners. In N2 and CO2 atmosphere, g-C3N4
show small holes etching. This can be explained by the formation of soft bubbles release during thermal polymerization process. After chemical oxidation process, g-C3N4in N2 and CO2 flow present bigger holes due to chemical etching. This can be explained by the more hole’s formation in CO2and N2flow, the more contacting points of g-C3N4surface with chemical oxidation agents, the etching process occur more prominent. Table 3 shows the physical properties of all prepared samples. N2
adsorption – desorption technique was used to measure the BET surface areas. In general, the freeze-drying samples of water-dispersible g-C3N4 of all samples have higher specific surface area compare with their bulk after chemical oxidation treatment. The SBET values are 25 m2/g (ATb), 17,9 m2/g (CTb) and the lowest is
11.4 m2/g (NTb). After chemical oxidation, g-C3N4 disperse in water was collected by freeze drying method. The SBET values are 70,1 m2/g (fATw), 23,0 m2/g (fCTw), 24 m2/g (fNTw). Although in CO2 and N2 atmosphere g-C3N4 contain many holes but the specific surface area is still very small due to the strong stacking layers structure (confirm via XRD pattern Figure 21B).
Figure 21: The FTIR spectra (A) and XRD patterns (B) of bulk and water- dispersible g-C3N4photocatalysts.
Figure 22:FESEM images of as-prepared samples
Figure 23:TEM images of as-prepared samples
Table 3: The physical and optical properties of the prepared photocatalysts.
Sample name
SBET
(m2/g)a
V (cm3/g) a
L (nm) a
Band gap (eV) b
ATb 25.0 0.203 18.3 2.96
CTb 17.9 0.121 26.5 3.20
NTb 11.4 0.130 45.9 3.14
fATw 70.1 0.455 14.5 2.83
fCTw 23.0 0.142 24.5 3.41
fNTw 24.0 0.248 40.0 3.17
aSpecific surface area, pore volume, and average pore size were determined via N2
adsorption–desorption isotherm measurements.
bEstimated band gaps were obtained from UV-Vis spectra.
cThe band gaps were measured using water-dispersible g-C3N4samples.
The XPS analysis was employed to study chemical oxidation states of O, C, N and S elements. The XPS data for C 1s was show in Figure 26 C 1s. There are three main peaks for bulk g-C3N4, 286.1 eV is assigned as carbons of C=NH2, 288.0 for N=C-N, and 284.5 eV is assigned as C=C coordination of carbon impurities or defects of sp2-hybridized carbon atoms in the samples, whereas with water dispersible samples has one more peak at. 289.2 eV for COOH in the g-C3N4
structure. After chemical oxidation, O-containing functional groups was introduced in all 3 photocatalyst samples with similar amount. Figure 26 O1s also shows the O1s data for all as-prepared samples. All bulk samples of g-C3N4 in 3 different environments show only one peaks at at 532.3 eV, assigned as adsorbed water. With 3 water-dispersible g-C3N4 samples, three more peaks are assigned at 530.4, 531.5, and 533.1 eV, contributed by COOH, C=O, and C-OH groups, respectively.
Figure 24The XPS data of C1s, N1s, O1s and S1p in g-C3N4.
![Figure 1: Treatment method for dye removal in wastewater [2]](https://thumb-ap.123doks.com/thumbv2/123dokinfo/11399200.0/15.892.146.781.105.413/figure-1-treatment-method-dye-removal-wastewater-2.webp)