저작자표시-비영리-변경금지 2.0 대한민국 이용자는 아래의 조건을 따르는 경우에 한하여 자유롭게
l 이 저작물을 복제, 배포, 전송, 전시, 공연 및 방송할 수 있습니다. 다음과 같은 조건을 따라야 합니다:
l 귀하는, 이 저작물의 재이용이나 배포의 경우, 이 저작물에 적용된 이용허락조건 을 명확하게 나타내어야 합니다.
l 저작권자로부터 별도의 허가를 받으면 이러한 조건들은 적용되지 않습니다.
저작권법에 따른 이용자의 권리는 위의 내용에 의하여 영향을 받지 않습니다. 이것은 이용허락규약(Legal Code)을 이해하기 쉽게 요약한 것입니다.
Disclaimer
저작자표시. 귀하는 원저작자를 표시하여야 합니다.
비영리. 귀하는 이 저작물을 영리 목적으로 이용할 수 없습니다.
변경금지. 귀하는 이 저작물을 개작, 변형 또는 가공할 수 없습니다.
Master of Electrical Engineering
THE SMOKE DETECTION FOR EARLY FIRE-ALARMING SYSTEM BASED ON VIDEO PROCESSING AND CNN
The Graduate School of the University of Ulsan
Department of Electrical Engineering University of Ulsan, Korea
Tao Peng
[UCI]I804:48009-200000371780 [UCI]I804:48009-200000371780 [UCI]I804:48009-200000371780 [UCI]I804:48009-200000371780 [UCI]I804:48009-200000371780 [UCI]I804:48009-200000371780
THE SMOKE DETECTION FOR EARLY FIRE-ALARMING SYSTEM BASED ON VIDEO PROCESSING AND CNN
Supervisor: Professor Byeong-Woo Kim
A Dissertation
Submitted to
The Graduate School of the University of Ulsan In partial fulfillment of the requirements
for the Degree of
Master of Electrical Engineering
by
Tao Peng
Department of Electrical Engineering University of Ulsan, Korea
February 2021
THE SMOKE DETECTION FOR EARLY FIRE-ALARMING SYSTEM BASED ON VIDEO PROCESSING AND CNN
This certifies that the dissertation of Tao Peng is approved.
Committee Chair Professor. Han-sil Kim
Committee Member Professor. Byeong-Woo Kim
Committee Member Dr. Su-jin Kwag
Department of Electrical Engineering University of Ulsan, Korea
February 2021
I
ACKOWLEDGEMENTS
When this thesis was completed, I felt a lot of emotion! Many people have offered me valuable help in my thesis writing, include my supervisor, my colleagues and my parents.
Firstly, I would like to thank my supervisor Professor Kim and Professor Cho for their meticulous guidance on my thesis, the selection of the theme of the thesis, the construction of the thesis frame, the supply of relevant materials, and the revision of the later stage for their valuable suggestions helped me successfully completed this thesis. I am grateful to Professor Cho for his meticulous care in all aspects of my study, work, and life in the past two years. I also thank for Professor Kim for not only granting me knowledge without reservation, but also teaching me the principle of being a researcher and how to work. His scientific and rigorous academic spirit, conscientious work attitude, keen and innovative design thinking all influence me subtly, and let me benefit a lot from his precepts and deeds.
I am grateful to the Department of Electrical Engineering of University of Ulsan, for creating good learning conditions and a strong academic atmosphere for me, allowing me to spend two years of pleasant and unforgettable study time, I am grateful to all the teachers, the knowledge you impart will become my precious wealth, used for life.
I am grateful to my dear family, friends and colleagues in the laboratory. The two years of study and life have been both painful and joyous. I am grateful to everyone along the way!
Thanks again!
II
요약
최근, 세계에서 대형 산불이 잇따라 발생해 우리 생활과 밀접한 차량 연소사고를 연상케 한다.
새로운 에너지 자동차의 개발로, 전기 자동차의 수량은 해마다 증가하고 있다. 그러나 불확실한 요소가 많아 전기자동차의 자연연소 현상이 항상 발생하는데, 특히 야외주차장에 주차된 전기자동차가 자연 발화했을 때 제때 알아내기가 어렵다, 일단 불이 번지면 단시간에 진화에 어려움을 겪는다. 화재의 통제는 주로 예방에 있다. 기존 일부 기술을 활용해 화재가 발생했을 때 조기경보를 확인하고 발령할 경우 화재가 확대되기 전에 진화할 수 있다. 스모크 화염이 타기 전에 가장 눈에 띄는 특징이기 때문에 화재 감지가 화염이 타지 않도록 하는 역할을 할 수 있다. 스모크 반투명한 특성이 가지고 있으며, 외적인 간섭에 의해 형태와 질감 특성이 쉽게 변화한다. 이러한 특성들이 스모크 인식 난이도를 결정한다. 본 논문은 주로 컴퓨터 비전과 CNN 기술을 활용하여 주차장 내 초기 화재로 발생한 스모크 감지하고 인식한다. 본 논문의 주요 연구 내용은 다음과 같다.
1. 사전 준비단계에서 수집·정렬을 통해 알고리즘의 효과를 검출하기 위해 사용되는 12개 동영상을
선택하였다. CNN의 훈련·시험에 사용되는 12,470개 스모크 이미지와 비 스모크 이미지 12,902개가 포함된다.
2. 화재 스모크의 정적(색상)과 역동적인 측면에서 화재 초기 스모크의 일반적인 특성을 분석한다.
3. CNN을 분류기로 삼아 스모크 이미지를 인식한다.
본 논문의 업적은 다음과 같은 혁신이 있다.
I. 데이터 세트. 본 논문에서 사용된 데이터 세트는 실외환경에서 녹화한 영상이다. 데이터 세트는 실제 상황에서 실제 화재 스모크 현장을 시뮬레이션 할 수 있는 실용적 있다.
III
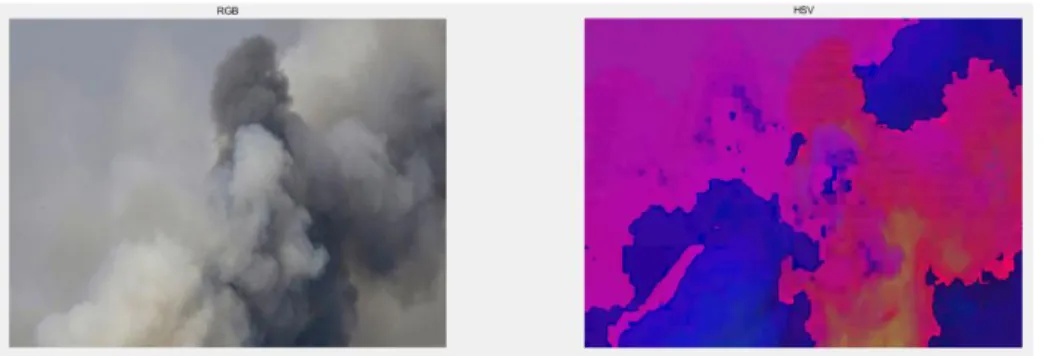
II. 스모크 색채 특성 추출. 본 논문에서는 RGB 색 공간의 낮은 화질로 인한 특징 장애를 방지하는 스모크 속 HSV 색 공간의 특성에 초점을 맞춘다.
III. CNN 은 스모크 인식으로 사용된다. 신경망은 다수의 훈련 데이터를 통해 영상의 특성을
자동으로 학습할 수 있어 단일 형상의 인위적 선택 문제를 피할 수 있다.
IV. 마지막으로 완전한 야외 화재 스모크 인식 시스템이 설계되어 화재 스모크 조기 경고의 야외에서 시스템을 달성할 수 있다. 그런 다음 제안된 알고리즘의 효과를 검증하기 위해 네 그룹의 대조도 실험을 사용한다. 제안된 방법이 다른 방법보다 정확도가 높고, 허위 경보율이 낮으며, 인식 누락률이 높다는 실험 결과도 CNN의 현장 적용이 일정한 연구 가치를 가지고 있음을 입증한다. 본 논문의 끝에는 제안된 알고리즘의 장단점을 요약하고, 알고리즘의 단점에 따라 그에 상응하는 해결책과 향후 연구의 방향을 제시한다.
키워드: 스모크 인식; 이미지 처리; GMM; HSV; CNN
IV CONTENTS
ACKOWLEDGEMENTS ... I 요약 ... II
CONTENTS... IV LIST OF FIGURES ... VII LIST OF TABLES ... IX
CHAPTER 1
INTRODUCTION ... 1
1.1 The Research Significance of the Subject ... 1
1.2 Current Status of the Research ... 3
1.3 Introduction to Smoke Detection Technology ... 5
1.4 Introduction the Structure of Smoke Detection System in This Thesis ... 6
1.5 The Structure of the Thesis and Main Work ... 8
CHAPTER 2 THE COMPILATION OF FIRE SMOKE VIDEO DATA SET ... 9
2.1 Collection of Data Sets ... 9
2.2 Organizing the Data Set ... 11
2.2.1 Screen ... 11
2.2.2 Crop... 11
2.2.3 Normalized ... 12
2.2.4 Bilinear Interpolation Algorithm ... 12
CHAPTER 3 PREPROCESSING ... 17
V
3.1 Filter ... 17
3.1.1 Mean Filter ... 18
3.1.2 Gaussian Filter ... 19
3.1.3 Experiment and Compare ... 20
3.1.4 Summary ... 22
3.2 Extract the Motion Area ... 23
3.2.1 Inter-frame Difference Method to Extract Motion Regions ... 23
3.2.2 Gaussian Mixture Model to Extract Motion Regions ... 24
3.2.3 Experiment and Compare ... 25
3.2.4 Summary ... 26
3.3 Color Feature Analysis and Extraction of Smoke Area ... 27
3.3.1 Features in the RGB Color Space ... 27
3.3.2 Features in the HSV Color Space ... 31
3.3.3 Experiment and Compare ... 36
3.3.4 Summary ... 36
3.4 Analysis and Extraction of Motion Feature in Smoke Area ... 37
3.4.1 Motion Direction Detection Based on Optical Flow Method ... 37
3.4.2 Based on the Motion Direction Detection of the Motion Block ... 40
3.4.3 Summary ... 42
CHAPTER 4 SMOKE IMAGES RECOGNITION ... 43
4.1 CNN ... 43
4.1.1 The Origin of CNN ... 44
4.1.2 Network Structure of CNN ... 45
4.1.3 Local Connection and Weight Sharing ... 47
4.2 HOG+SVM ... 49
VI
4.2.1 Support Vector Machine(SVM) ... 49
4.2.2 Histogram of Oriented Gradient(HOG) ... 49
4.3 Experiment and Compare... 52
4.4 Chapter Summary ... 54
CHAPTER 5 SMOKE DETECTION SYSTEM DESIGN AND RESULT ANALYSIS ... 55
5.1 System Environment ... 55
5.2 System Flow Design ... 56
5.2.1 Input Stage ... 56
5.2.2 Preprocessing Stage ... 56
5.2.3 Recognition Stage ... 57
5.2.4 Marking Stage ... 60
5.3 Analysis of Results ... 61
5.3.1 Experimental Method Description ... 61
5.3.2 Evaluation Method of Experimental Results ... 61
5.3.3 Experimental Results and Analysis ... 63
5.4 Chapter Summary ... 67
CHAPTER 6 CONCLUSION AND FUTURE WORK ... 68
6.1 Conclusion ... 68
6.2 Future Work ... 68
REFERENCES ... 70
RESEARCH RESULTS DURING THE STUDY PERIOD... 76
ABSTRACT ... 77
VII
LIST OF FIGURES
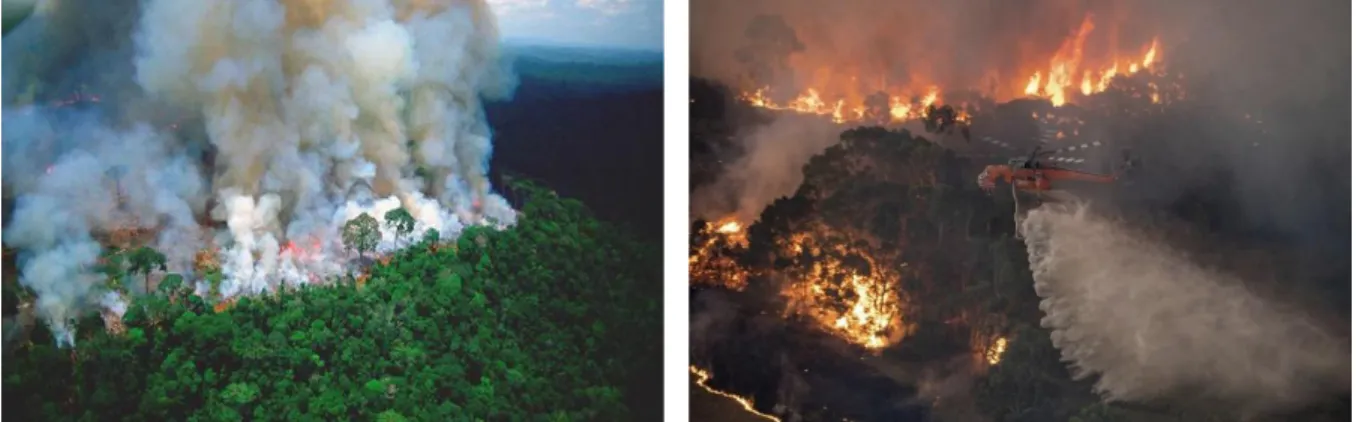
Figure 1-1: 2019, Amazon forest and Australia forest fires. ... 2
Figure 1-2: Spontaneous combustion of vehicles in outdoor charging stations and Newark Airport parking lot. ... 2
Figure 1-3: Diagram of the identification steps of fire smoke. ... 5
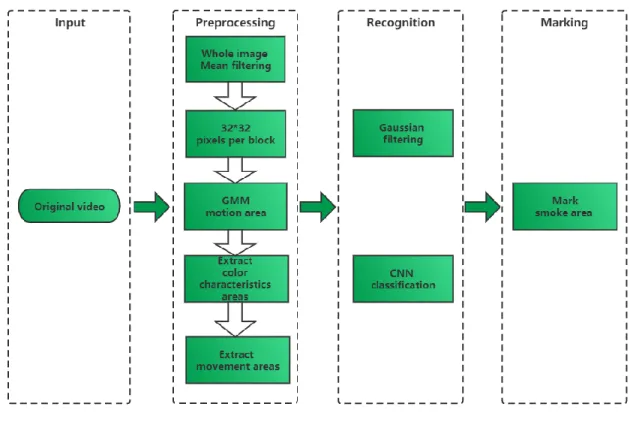
Figure 1-4: System framework diagram. ... 6
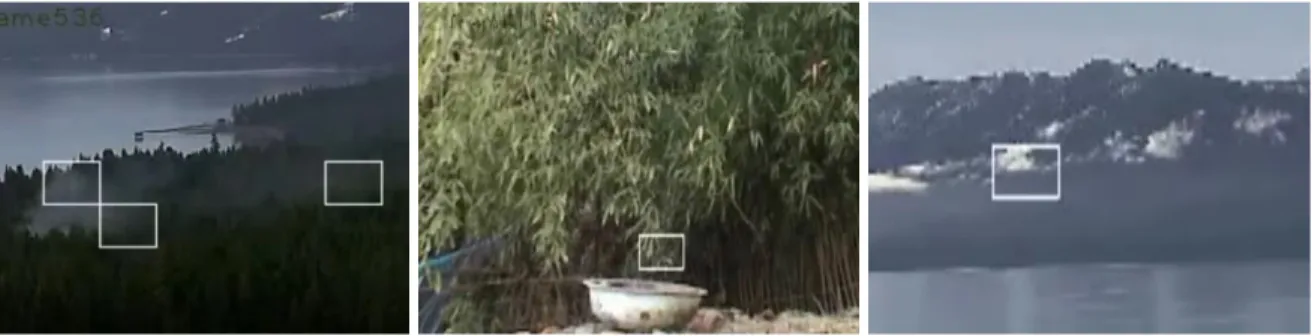
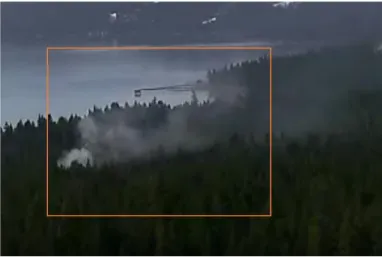
Figure 1-5: Schematic diagram of the final output. ... 7
Figure 2-1: The original video collected. ... 10
Figure 2-2: Schematic diagram of video cropping. ... 11
Figure 2-3: Bilinear interpolation method zoomed in the effect of the image. ... 14
Figure 2-4: The final video set. ... 15
Figure 3-1: Noise images comparison. ... 18
Figure 3-2: The filter effect of 320*240 pixels. ... 21
Figure 3-3: The filter effect of 32*24 pixels. ... 21
Figure 3-4: The motion area extracted by the GMM method (2) and the IFD method (3). ... 26
Figure 3-5: RGB color model. ... 27
Figure 3-6: Four comparison images and the two-dimensional and three-dimensional images of the R, G, B components of each images. ... 29
Figure 3-7: HSV cone model diagram. ... 31
Figure 3-8: The meaning of HSV cone model. ... 31
Figure 3-9: The comparison between the image converted to HSV space and the original image. ... 33
Figure 3-10: Smoke image. ... 33
Figure 3-11: HSV three-dimensional image. ... 34
Figure 3-12: S-V projection image. ... 34
Figure 3-13: S-H projection image. ... 35
Figure 3-14: V-H projection image. ... 35
VIII
Figure 3-15: Smoke area extraction results based on RGB (1) and HSV (2) color spaces. ... 36
Figure 3-16: Point motion image in the optical flow field. ... 37
Figure 3-17: Use optical flow method to detect movement direction. ... 40
Figure 3-18: Schematic diagram of movement direction. ... 41
Figure 4-1: Deep neural network (1) and ordinary neural network (2). ... 44
Figure 4-2: Conceptual diagram of convolutional neural network structure. ... 45
Figure 4-3: Example of max pooling, the left images is the original image, and the right images is the image after pooling. ... 46
Figure 4-4: Schematic diagram of image data flattening. ... 47
Figure 4-5: Fully connected neural network (1) and partially connected neural network (2) ... 48
Figure 4-6: Non-weight sharing (1) and weight sharing (2). ... 48
Figure 4-7: Gamma correction ... 50
Figure 4-8: HOG feature extraction algorithm... 51
Figure 4-9: Some Non-smoke images (negative sample) in the data sets. ... 52
Figure 4-10: Some Smoke images (positive sample) in the data sets. ... 52
Figure 4-11: The position of the first smoke image frame detected by CNN ... 53
Figure 4-12: The position of the first smoke image frame detected by HOG+SVM. ... 53
Figure 5-1: System design flow chart. ... 56
Figure 5-2: Schematic diagram of the convolutional neural network. ... 58
IX
LIST OF TABLES
Table 3-1: Comparison results of mean filter and Gaussian filter. ... 21
Table 3-2: Comparison of the influence of image filtering on the recognition rate of CNN. ... 22
Table 4-1: CNN and SVM classification experiment results. ... 53
Table 5-1: Network parameter configuration ... 59
Table 5-2: Confusion matrix of classification results. ... 62
Table 5-3: Experiment 1: Use CNN experiment statistical result. ... 63
Table 5-4: Experiment 2: Use HOG+SVM experiment statistical result. ... 64
Table 5-5: Experiment 3: Use HSV+CNN experimental statistical result. ... 65
Table 5-6: Experiment 4: Use Preprocessing+CNN experimental statistical result. ... 66
1
CHAPTER 1 INTRODUCTION
1.1 The Research Significance of the Subject
In 2019, Amazon forest fires occurred frequently. As of August 18, 2019, the number of Amazon forest fires has exceeded 72,000 since 2019. Beginning in September of the same year, a forest fire broke out in Australia, which lasted for nearly 5 months and was not extinguished until 2020. The fire caused very great losses to Australia and even the entire human race. From these news content can always remind people of fire accidents that are closely related to our lives. Especially the fire in the parking lot that also occurs outdoors, and something that will cause us large property losses. Through the investigation of many large- scale fire accidents in the parking lot, it was found that the initial stage of the fire was caused by the spontaneous combustion of individual vehicles and other reasons. The discovery was not timely, and the rapid spread of the fire caused the fire to intensify and finally caused more serious fire accidents.
On February 1, 2019. 17 cars catch fire at Newark Airport parking garage. February 23, 2019. 300 cars gutted in massive fire at parking lot near Aero India show in Bengaluru. April 17, 2019, vehicles in the parking lot of a community in Guangdong ignited spontaneously, lead to 15 cars were burned. June 29, 2019, a vehicle spontaneous combustion accident occurred in an underground parking lot in Qingdao, which burned more than 40 cars, April 5, 2020. 3,500 Rental Cars Destroyed by Massive Fire in Florida. April 27, 2020, a vehicle spontaneous combustion accident occurred in an outdoor parking lot in Shenzhen, and the incident caused 5 nearby cars to be burned. Vehicles in the parking lot are relatively dense. Once a fire takes shape, it will inevitably cause a large amount of property losses and even casualties. If there is a monitoring system that can detect the occurrence of fires and eliminate fire hazards as soon as possible, to eliminate the fire in an unburnt state can better protect the safety of human life and property. Smoke detection is the early detection of fires that occur. When the fire occurs, people are given a fire alarm, so that we can carry out put out a fire in time, and most reduce the loss caused by the fire. This thesis combines the static and dynamic characteristics of smoke and applies image recognition technology to early fire detection, which has important practical significance and application value for fire prevention, fire scale judgment and put out a fire.
2
Figure 1-1: 2019, Amazon forest and Australia forest fires.
Figure 1-2: Spontaneous combustion of vehicles in outdoor charging stations and Newark Airport parking lot.
In recent years, with the development of computer science, computer vision and artificial intelligence have formed a research hotspot. Many new and improved algorithms have been continuously proposed [3-5], making the field of computer vision faster Development and application of computer vision technology to early fire smoke detection has important practical significance and application value for fire prevention, fire scale judgment and put out the fire.
3
1.2 Current Status of the Research
For fire smoke detection, sensors and infrared probes are now used more frequently. Sensors include smoke detector sensors, gas sensors, and temperature sensors. By monitoring the carbon dioxide and carbon monoxide in the air, and the temperature is monitored to achieve the purpose of detection. This detection method is effective in indoor enclosed areas and small space areas, such as tunnels. But for the outdoor, due to the limited sensing range of sensors, generally for spaces exceeding 12𝑚 [6], conventional point fire detectors can't play a very good role to detection the smoke. It is even impossible to install the large number of sensor equipment in the outdoor environment. In addition, the environment changes drastically in the outdoor environment, and the sensor equipment is easily damaged when exposed to the outdoors for a long time, causing false alarms. It is a cheap, convenient and accurate feasible solution to use a camera to monitor and use computer vision technology to detection smoke.
Scholars have been conducting research in this area since the 1990s. Early research was mainly aimed at the recognition of flames, most of which used its bright and color characteristics to be much obvious and easy to extract features. From the initial RGB color model [8-10], to the HIS [11], YCbCr [12] color model, later researchers have used these features to do corresponding research. For the convenience of improve accuracy, more researchers began to pay attention to other characteristics of flames and smoke. For flames, Wang Lin et al. [13] studied the characteristics of flame beats and found that the beat frequency of the flame's centroid was about 10𝐻𝑍, this feature can be used to distinguish flame and non-flame areas. Yuan Feiniu et al. [14] identified the smoke based on the characteristic that the smoke always moves upward after it is produced. Yaqin Zhao [15] and Yuan Feiniu [16] also used LBP and LBPV to extract local features to identify flames and smoke. Many scholars use wavelet analysis to extract edge features or wavelet energy [15] features for identification. For the convenience of further improve the accuracy of recognition, many scholars have also begun to integrate multiple features for recognition [21-23]. The main fusion features are color, motion state, background blur, wavelet transform, etc. Literature [24] uses the temporal and spatial features of smoke combined with dynamic texture model to detect smoke.
In recent years, many scientific research teams have begun to conduct research on fire smoke identification.
The Smart Media Computing Laboratory of Sun Yat-sen University published a paper in 2014 [25], published the source code and examples on its website. Professor A. Enis Cetin of Bilkeng University in Turkey published several papers on fire video detection from 2008 to 2009 [26], put fire video detection examples and program installation packages on his website.
4
The Computer Vision and Pattern Recognition Laboratory of Keimyung University in South Korea released four versions of flame and smoke detection systems for four years from 2008 to 2013, and published several papers [27-28], Constantly put forward new detection methods, and the accuracy rate is constantly improving.
The Machine Intelligence Laboratory of Salerno, Italy established its own fire smoke video data set in 2012 and published papers in 2014 and 2015 [29-30]. The Multi Expert System (MES) designed by it is accurate in identifying flames. The rate reached 93.55%.
However, in recent years, most of the research on fire smoke detection is aimed at the detection of flames, and most of them are aimed at indoor spaces, and the detection of smoke is currently relatively small. In addition, because there is no standard video data set for fire and smoke detection, most of the video data used in the research are collected by some visual research laboratories [31-33]. Most of the flames and smoke in these videos are made indoors. The particularity of fire in the external natural environment. The Machine Intelligence Laboratory of the University of Salerno has collected a relatively complete set of outdoor smoke and fire video data sets, and conducted related research, but its main research is the detection after the fire has occurred, and there are fewer early detections.
With the popularity of deep learning, it has excellent performance in speech recognition [34-35], image recognition [36-38], natural language processing (NLP) [39-40] and other fields. Convolutional neural network (CNN) is a multi-layer perceptron designed to recognize two-dimensional shape data. It is a special deep neural network model. Its local connection and weight sharing characteristics reduce the complexity of the network model. CNN also have a lot of research and applications in the field of image recognition [41-45]. In recent years, some people have also started to talk about the application of CNN in fire and smoke recognition. In reference [46], the author designed a three-layer CNN as a recognition model for fire images, achieved better recognition results on small sample data sets using the parameter replacement method in reference [47]. The author uses the deep learning framework-Caffe to implement a CNN, compares the effects of a variety of different CNN and a relatively mature outdoor fire algorithm-fshell of the German Space Center on outdoor fire smoke video sets. The research results show that CNN can also perform well in outdoor fire recognition.
Early fire smoke detection can better realize fire monitoring and warning, has more practical significance and research value for fire prevention. However, there are few studies on this content at present, and the research on outdoor early fire smoke detection technology for many different types of fire and smoke videos, explore new algorithms for the complexity and strong interference of outdoor environments.
5
1.3 Introduction to Smoke Detection Technology
Generally, fire smoke recognition is mainly divided into four steps as shown in Figure 1-3 below: image preprocessing, extraction of the area to be detected, feature extraction, and classification and recognition.
Figure 1-3: Diagram of the identification steps of fire smoke.
Image preprocessing: mainly for image graying, denoising, key frame extraction and other steps, for the convenience of eliminate interference and enhance the target area.
Extract the area to be detected: mainly use the obvious characteristics of the movement of the smoke, color, etc., to segment the suspected smoke area in the video, avoiding the calculation of the entire image to reduce the amount of calculation.
Extract features: It mainly extracts features such as texture, motion direction, color, and energy of the target area as the basis for the next step of classifying the images.
Classification recognition: mainly use Support Vector Machines (SVM), Decision Tree, Artificial Neural Network (ANN) and other classifier models to classify and recognize the extracted regions.
In traditional recognition methods, appropriate features must be selected manually, and then the features can be extracted through algorithms before they can be input into the classifier for classification. However, due to the non-rigidity, boundary uncertainty, and translucency of smoke, the characteristics of smoke are not so obvious, and it is easily interfered by other factors. With the development of CNN, neural networks are used in the classification of smoke images. The self-learning characteristics of CNN can find and learn the most suitable features for distinguishing smoke regions. In the CNN, feature extraction and classification recognition can be completed at the same time.
Experiments have proved that on the same smoke image data set, extracting the histogram of smoke orientation gradient (HOG) as a feature, using SVM as a classifier, the recognition rate of smoke images is only 82.26%, while the recognition rate of the CNN can reach 96.55%. To a certain extent, it reflects that the CNN's ability to classify images is much stronger than traditional methods, and the use of CNN for images classification eliminates the trouble of manual feature selection and feature extraction.
6
1.4 Introduction the Structure of Smoke Detection System in This Thesis
Different from traditional classifiers, convolutional neural networks include the functions of feature extraction and detection and recognition. For the convenience of make the system structure clear and facilitate the design of structured programming, this paper divides the system into four stages: input stage, preprocessing stage, recognition Stage, marking stage, the system framework diagram is shown in Figure 1-4. This system realizes the function of real-time video smoke detection. When using this system for smoke recognition, on the PC configured as described in section 5.1, On the training set described in section 4.2, after a short period of training, the specified video can be recognized.
Figure 1-4: System framework diagram.
1)Read the video and decode it into a single frame image and input it into the system one by one, 2)Perform mean filtering on the input image, and then divide the image into regions according to the size of 32*24 pixels. Each region is a small image block; the Gaussian mixture model is used to extract the motion area in the entire video, and the motion area is included. Extract small image blocks, extract color features and motion features for each small image block, then use the image with both features in accordance with the smoke feature as the final image to be recognized,
7
3)The images to be recognized obtained in the preprocessing stage are processed by Gaussian filtering one by one, and then input into the trained convolutional neural network for classification and recognition, 4)Mark the position of the small image identified as smoke in the original video frame. The final output is as follows. The final output result is shown in Figure 1-5.
Figure 1-5: Schematic diagram of the final output.
8
1.5 The Structure of the Thesis and Main Work
This article summarizes some existing smoke recognition algorithms based on traditional methods. On this basis, an outdoor fire smoke detection method combining traditional methods and CNN is proposed, and a complete outdoor fire smoke detection system is completed. Compared with traditional methods, it proves that the CNN has a better effect in outdoor fire smoke recognition. The detailed structure of this thesis is as follows.
Chapter 1. This thesis introduces the research significance of fire smoke video recognition and the current research status at home and abroad, and briefly introduces the basic principles of fire smoke video detection technology and the basic structure of the system designed in this thesis.
Chapter 2. Introduced the source and sorting method of the smoke video data set used in the research.
Chapter 3. Introduces the pre-processing work that needs to be done before inputting the image into the CNN for classification, including filtering, extracting the smoke candidate area, and feature extraction.
Through the comparison of different methods, the reasons for choosing the method used in this thesis are explained and given Comparison chart of the results.
Chapter 4. Introduced the basic principles of CNN and the smoke image recognition method based on CNN, compared the method of extracting HOG features of the image and using the SVM classification method to point out that the CNN has better recognition ability for smoke.
Chapter 5. Introduces the algorithm flow of the outdoor fire smoke detection system, verifies the effectiveness of the system through statistics and analysis of the four sets of comparative experimental results.
Chapter 6. Summarizes the advantages and disadvantages of the system, puts forward some ideas for algorithm improvement and some views on the prospects of smoke detection research.
9
CHAPTER 2
THE COMPILATION OF FIRE SMOKE VIDEO DATA SET
2.1 Collection of Data Sets
For image recognition research such as license plate recognition and face recognition, many institutions have established standard data sets during the research. However, due to the difficulty of obtaining smoke images and the relatively small number of researchers, smoke recognition is still no standard data set for research. The most data set used in the current research is the data set of the mobile phone of professors and students in the signal processing group of Bilkent University in Turkey[48], the official website of the Computer Vision and Pattern Recognition Laboratory of Keimyung University in Korea[49], In addition, the Machine Intelligence Laboratory of the University of Salerno in Italy established its own fire smoke video data set in 2012 [50], but there are still fewer people using this data set for research. From the University of Science and Technology in China, Professor Feiniu Yuan produced and published part of the data set, most of the video data sets be used are videos that recorded using burning objects outdoors to simulate smoke. The data set also includes tens of thousands of smoke and non-smoke images. In addition, other videos are mostly collected from YouTube and other video sites, and like the author of Reference [47], they make their own data sets. However, due to the uncertainty of outdoor fires and the constraints of conditions, it is difficult to make videos by self. Most of the data used in this thesis are collected from references. The data sources mainly include the following.
1) Download the public data set from the official website of the Signal Processing Group of Bilkent University in Turkey [48].
2) Download the public data set from the official website of the Computer Vision and Pattern Recognition Laboratory of Keimyung University in South Korea [49].
3) Download the public data set published by Professor Feiniu Yuan of University of Science and Technology in China.
4) Outdoor fire smoke data set from the Computer Vision Laboratory of the University of Nevada in Reno.
5) Part of the video collected by the video websites.
10
Some of the collected original video screenshots are shown in Figure 2-1. Can know that the size of the video is not consistent, and the quality of the video is also uneven. For the convenience of research, we will screen and crop the useful videos first, and then use the normalization method to sort out a set of video image data sets with uniform specifications and multiple environmental conditions.
(1)16:9/720*405 (2)4:3/640*480 (3)1:1/240*240
(4) 4:3/640*480 (5) 4:3/640*480 (6) 16:9/1920*1080 Figure 2-1: The original video collected.
11
2.2 Organizing the Data Set
2.2.1 Screen
The collected video data sets are not all ideal videos that meet the requirements. For example, the image definition in Figure 2-1 (4) is too low, although the smoke area is visible to the naked eye, the noise in the video is too interference, not very researchable. Figure 2-1 (5) is a video in an indoor environment. The original video size of the image shown in Figure 2-1 (6) is 1920*1080 pixels, and the video size is too large, which is different from the current experimental conditions. In other words, the calculations are too large, difficult to meet real-time calculations, and the smoke area is small. If the video is scaled down, it will cause serious loss of the smoke area. Therefore, after collecting the data set, first perform the screening, only the ideal data set that meets the conditions is filtered out.
2.2.2 Crop
For videos that are too large, only the more experimentally significant parts are selected and cut. In Figure 2-2, the area in the lower left corner is where the smoke appears. The area in the lower left corner is reduced according to a rectangular area with an aspect ratio of 32 to 24 and saved as a new video clip. In addition, the upper left corner of the video is the floating cloud in the sky. In outdoor fire smoke recognition, the characteristics of cloud and smoke are very close, which is one of the important objects that interfere with recognition. Therefore, the part with clouds in the upper left corner is also cut out the rectangular section with an aspect ratio of 32 to 24. The other parts are mostly static backgrounds, and there is not much information displayed in the entire video, so it is not considered. In addition, for the convenience of normalization, the video is uniformly cropped to a video resolution of 320 pixels wide and 240 pixels high.
Figure 2-2: Schematic diagram of video cropping.
12
Regarding the crop size, the reason why a rectangle with an aspect ratio of 32:24 is selected during the cropping process is as follows.
Most video and monitors have an aspect ratio of 16:9 or 4:3, and 32:24 is 4:3. This size makes people looks comfortable.
32 and 24 are eight times of 4 and 3. Some algorithms in image processing often expand or shrink the highlight by multiples. 8 is the cubic of 2 can support the image to be reduced by multiples three times, which can meet the needs of the algorithm. However, the eight times of 16 and 9 are 144 and 72. Excessive values will cause the image size to be too large, which will increase the calculation during processing.
When cropping a video, the complete information in the original video should be retained, that is, when cropping the video, the object in the video must be completely cropped, not just a part of the object. When cropping a video, cannot just crop the smoke area, it must include the area around the smoke, especially some information that interferes with smoke recognition.
2.2.3 Normalized
Normalization is to change the video size to a uniform size through a scaling algorithm. Considering the calculation and video quality, the normalized uniform size is finally determined to be 320 pixels wide and 240 pixels high, which is convenient for dividing the video into 32 ∗ 24 image blocks in the subsequent processing. The division of the video reduce the calculation, is an effective means to improve the detection efficiency. In the collected original video set, there are some videos whose aspect ratio is not 32 ∗ 24, but the difference is not very large. After the image is scaled, the deformation has little effect on the recognition effect, and the original ratio of the video can be changed. The video size is uniformly 320 ∗ 240 pixels.
The scaling algorithm used in this article to normalize the video is a bilinear interpolation algorithm.
2.2.4 Bilinear Interpolation Algorithm
The bilinear interpolation algorithm in the image scaling is an algorithm that has a better effect of scaling an image and a higher computational efficiency. Bilinear interpolation is to perform interpolation operations in both the x direction and the y direction. In the bilinear interpolation algorithm, the pixel of the target image is determined by its four points in the corresponding position of the original image, so the algorithm can better fill the missing pixels.
Before the interpolation operation, coordinate mapping must be performed first, assumption that 𝑆(𝑚, 𝑛) is a pixel point on the original image, 𝐷(𝑝, 𝑞) is the point corresponding to it on the scaled target image, then the relationship of 𝑆 and 𝐷 is.
13 𝑝 =𝑆𝑊 ∗ 𝑚
𝐷𝑊
(2-1)
𝑞 =𝑆𝐻 ∗ 𝑛 𝐷𝐻
(2-2)
Among them, 𝑆𝑊 is the width of the original image, 𝑆𝐻 is the height of the original image, 𝐷𝑊 is the width of the target image, and 𝐷𝐻 is the height of the target image. Let 𝑖 = [𝑝], 𝑗 = [𝑞], then the value of 𝐷(𝑝, 𝑞) is determined by the four adjacent points 𝑆(𝑖, 𝑗), 𝑆(𝐼, 𝑗 + 1), 𝑆(𝑖 + 1, 𝑗), and 𝑆(𝑖 + 1, 𝑗 + 1) , let 𝑥 = 𝑝, 𝑦 = 𝑞, 𝑥1 = 𝑖, 𝑥2 = 𝑖 + 1, 𝑦1= 𝑗, 𝑦2= 𝑗 + 1, then the interpolation calculation formula of 𝐷 in the x direction is as follows.
The interpolation calculation formula in the y direction is as follows.
𝑆(𝑝, 𝑞) = 𝑦2− 𝑦 𝑦2− 𝑦1
𝑆′(𝑝, 𝑞) + 𝑦 − 𝑦1 𝑦2− 𝑦1
𝑆′′(𝑝, 𝑞) (2-5)
In the end.
𝑆(𝑝, 𝑞) =(𝑥2− 𝑥)(𝑦2− 𝑦)𝑆(𝑖, 𝑗)
(𝑥2− 𝑥1)(𝑦2− 𝑦1) +(𝑥 − 𝑥1)(𝑦2− 𝑦)𝑆(𝑖 + 1, 𝑗) (𝑥2− 𝑥1)(𝑦2− 𝑦1)
+(𝑥2− 𝑥)(𝑦 − 𝑦1)𝑆(𝑖, 𝑗 + 1)
(𝑥2− 𝑥1)(𝑦2− 𝑦1) +(𝑥 − 𝑥1)(𝑦 − 𝑦1)𝑆(𝑖 + 1, 𝑗 + 1) (𝑥2− 𝑥1)(𝑦2− 𝑦1)
(2-6) 𝑆′(𝑝, 𝑞) = 𝑥2− 𝑥
𝑥2− 𝑥1𝑆(𝑖, 𝑗) + 𝑥 − 𝑥1
𝑥2− 𝑥1𝑆(𝑖 + 1, 𝑗) (2-3)
𝑆′′(𝑝, 𝑞) = 𝑥2− 𝑥
𝑥2− 𝑥1𝑆(𝑖, 𝑗 + 1) + 𝑥 − 𝑥1
𝑥2− 𝑥1𝑆(𝑖 + 1, 𝑗 + 1) (2-4)
14
50*50 pixels 100*100 pixels 200*200 pixels
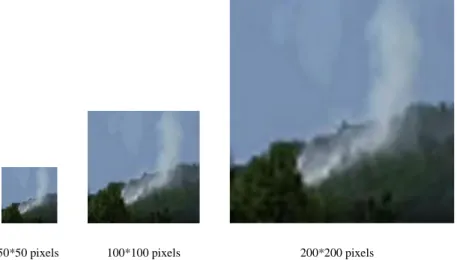
Figure 2-3: Bilinear interpolation method zoomed in the effect of the image.
The zooming effect diagram of the bilinear interpolation algorithm is shown in Figure 2-3, where the image in the middle is the original size of 100 ∗ 100 pixels, the image on the left is reduction to 50 ∗ 50 pixels after using the bilinear interpolation algorithm, and the image on the right side is magnification to 200 ∗ 200 pixels after using the bilinear interpolation algorithm. As show in the figure, the effect of using bilinear interpolation to process the image is better and can fill in the exact pixels, but for reduction images, jagged edges will appear, indicating the use of bilinear interpolation when the method is used to reduce the image, the problem of missing pixels cannot be avoided.
After screening, cropping, and normalization, 12 video clips with a size of 320 ∗ 240 pixels are finally produced, including 9 smoke videos and 3 non-smoke videos. The video set is shown in Figure 2-4. Among them, the short videos (1)-(3) are non-smoke videos, and the videos (4)-(12) are smoke videos. This video collections select smoke videos in a variety of outdoor environments, focuses on simulating a variety of outdoor environments through the experiment of this data set, the effectiveness of the system can be fully proved.
15
(1) (2) (3)
(4) (5) (6)
(7) (8) (9)
(10) (11) (12) Figure 2-4: The final video set.
16
2.3 Chapter Summary
This chapter introduced the source of the data set in the process of this research, as well as the selection and tailoring of the data set for normalization. Finally, 12 video clips samples were produced as the research data set of this thesis. In the data set, the video of the occurrence of smoke under a variety of different conditions is included in the outdoor environments. It also contains some of the main factors that affect the identification of smoke in the outdoor environments. This data and research can fully prove the effectiveness of the algorithm in this paper. After the data set production and processing is completed, in the next chapter, will introduce how to preprocess the data set proposed in this thesis.
17
CHAPTER 3 PREPROCESSING
In the system designed in this thesis, the final input into the CNN for classification is small image blocks of 32 ∗ 24 pixels selected from the entire image. The preprocessing stage is to select these small image blocks from the entire image. This preprocessing stage selects the smoke area through four processes:
filtering, extracting the motion area, extracting the color feature of the region of interest (ROI), and extracting the motion feature of the ROI. Through the preprocessing, it is avoided to input the entire image into the CNN, which reduces the amount of calculation of the system ensures the real-time performance of the system. At the same time, in the preprocessing stage, images that have been classified incorrectly can be filtered out, thereby improving the recognition accuracy of the system.
3.1 Filter
In the process of image collection, storage, and transmission, the quality of the image will be reduced by the interference and influence of various noise factors. The quality of the image will have a great impact on the subsequent segmentation, recognition, and recognition. The most common image noise is salt and pepper noise and gaussian noise. Salt and pepper noise include white salt noise and black pepper noise. The image of salt and pepper noise is shown in Figure 3-1 (2). The characteristic of salt and pepper noise is that the pixel depth of the noise is basically fixed, the position is random, and the mean filter can be used to remove it well. The image of gaussian noise is shown in Figure 3-1 (3). In contrast to salt and pepper noise, most pixels in gaussian noise have noise interference, and the pixel depth of the noise is uncertain. Gaussian filter eliminates gaussian noise can achieve better results. Mean filter and Gaussian filter are commonly used and effective filter methods in image processing. The following will compare the effects of these two filter methods in smoke detection applications, and finally determine the filter method used in this thesis.
18
(1) Original image (2) Salt and Pepper noise (3) Gaussian noise Figure 3-1: Noise images comparison.
3.1.1 Mean Filter
Mean filter is a linear filter method, which has a relatively good effect on eliminating salt and pepper noise, is a common filter method with low computational complexity. Mean filter uses a mean filter template, which slides the template along the 𝑥-axis and 𝑦-axis in sequence on the original image, calculates the mean value of all pixels within the coverage of the template, and replaces the value of the center of the position covered by the template with this value filter out the noise. Since salt and pepper noise is often independent points, in this way, using the mean value of the surrounding points of the pixel to determine the value of the original pixel, the salt and pepper noise can be removed very well. However, because this method simply uses surrounding pixels the mean value of the point replaces the center point, does not consideration the excessive relationship between the pixels. Therefore, the Mean filter is not the best filter method, but due to its simple operation, when the filter effect is not very important, the mean filter is a very practical filter method.
The Mean filter template 𝑀5 with a radius of 5 is as follows (3-1).
𝑀5= 1 25
[
1 1 1 1 1 1 1 1 1 1 1 1 1 1 1 1 1 1 1 1 1 1 1 1 1]
(3-1)
Calculating the mean value of pixels can be done by means of image convolution. The formula for calculating the filtered image is
𝐼𝑚= 𝐼 ∗ 𝑀5= ∑ ∑ (𝐼(𝑥 + 𝑗, 𝑦 + 𝑖)𝑀5(𝑗, 𝑖))
𝑤𝑖𝑑𝑡ℎ
𝑗=0 ℎ𝑒𝑖𝑔ℎ𝑡
𝑖=0
(3-2)
19
Where 𝐼𝑚 represents the filtered image, 𝐼 represents the original image, ℎ𝑒𝑖𝑔ℎ𝑡 represents the height of the average filter template, 𝑤𝑖𝑑𝑡ℎ represents the width of the average filter template, and 𝑥 and 𝑦 represent the offset of the current sliding window relative to the origin of the original image.
3.1.2 Gaussian Filter
Gaussian filter is also a linear filter method, which has a good effect on eliminating gaussian noise and is widely used in image denoising. Gaussian filter uses a filter template to perform a weighted average on each pixel of the entire image, and each weight in the filter template meets the gaussian distribution.
In the implementation of Gaussian filter, the image is gaussian blurred by image convolution. The convolution kernel slides along the original 𝑥 and 𝑦 directions. The convolution kernel and the image pixel values covered by it are convolved, and then used the convolution value replaces the pixel value at the center of the template. Assuming 𝐼 is the original gray-scale image, 𝐺𝜎 is the convolution kernel or filter template, and 𝐼𝜎 is the image after convolution (filter), then 𝐼𝜎 can be express as
𝐼𝜎 = 𝐼 ∗ 𝐺𝜎 (3-3)
Among them, ∗ means convolution operation; 𝐺𝜎 is a two-dimensional gaussian kernel with standard deviation 𝜎, which is defined as.
𝐺(𝑥, 𝑦) = 1 2𝜋𝜎2𝑒
−(𝑥−𝜇𝑥)2
2𝜎𝑥2 +−(𝑦−𝜇𝑦)2 2𝜎𝑦2
(3-4) Among them, 𝜇 is the mean value, 𝜎 is the variance, and the variables 𝑥 and 𝑦 represent the x-axis and y- axis of the two-dimensional image. Assuming that the coordinates of the center point is (0,0), that is taking the center point as the origin, the equation (3-4) can be simplified to.
𝐺(𝑥, 𝑦) = 1 2𝜋𝜎2𝑒
−(𝑥2+𝑦2) 2𝜎2
(3-5) Therefore, the Gaussian filter template 𝐺5 with a radius of 5 is as follows.
𝐺5= 1 273
[
1 4 7 4 1
4 16 26 16 4 7 26 41 26 7 4 16 26 16 4
1 4 7 4 1]
(3-6)
20
Finally, the original image 𝐼 and the Gaussian filter template 𝐺𝜎 are convolved according to the following formula (3-7) to obtain the final Gaussian filter result.
𝐼𝜎= 𝐼 ∗ 𝐺𝜎= ∑ ∑ (𝐼(𝑥 + 𝑗, 𝑗 + 𝑗)𝐺𝜎(𝑗, 𝑖))
𝑤𝑖𝑑𝑡ℎ
𝑗=0 ℎ𝑒𝑖𝑔ℎ𝑡
𝑖=0
(3-7)
Among them, 𝐼𝜎 represents the filtered image, 𝐼 represents the original image, 𝐺𝜎 represents the Gaussian filter template, ℎ𝑒𝑖𝑔ℎ𝑡 is the height of the Gaussian filter template, 𝑤𝑖𝑑𝑡ℎ is the width of the Gaussian filter template, and 𝑥 and 𝑦 are the deviations of the current sliding window relative to the original image origin shift.
In the process of Gaussian filter and average, there is a problem of processing image edge pixels. Since the center of the convolution kernel cannot be slid to the edge of the image when the image is convolved, the pixels at the edge of the image cannot be filtered. There are two common ways to solve this problem, which is to ignore the edge pixels and cannot perform filter operations. There are two commonly used ways to solve this problem. One is to directly ignore the edge pixels. After the filter is completed, add a layer of random values or original edge pixels on the outer edge of the image. Add a layer of random values or pixels at the edge of the original image. Another way is adjunction a layer of 0 or other data on the periphery of the original image, and then convolve the image so that the image after convolution is as large as the original image. Since there are many pixels in the image, and the amount of information contained in the pixels at the edge of the image is not large, the loss caused by the two processing methods to the image is acceptable.
3.1.3 Experiment and Compare
The experimental effects of Mean filter and Gaussian filter are shown in Table 3-1. Figures 3-2 and 3-3 show the filter effects of images with a size of 320 ∗ 240 pixels and 32 ∗ 24 pixels respectively. Figure (1) is the original image, Figure (2) is the effect diagram of Mean filter, and Figure (3) is the effect diagram of Gaussian filter.
21
(1) Original image (2) Mean filter (3) Gaussian filter Figure 3-2: The filter effect of 320*240 pixels.
(1) Original image (2) Mean filter (3) Gaussian filter Figure 3-3: The filter effect of 32*24 pixels.
It can be seen from Table 3-1 that, from the time consumed by the two filter methods, the time consumed by Gaussian filter is shorter than the time consumed by Mean filter, but the time consumed is only a few microseconds. The effect of the two filter methods is not large, from the effect of the two filter methods, the naked eye cannot judge which method is more suitable. After many tests during the experiment, it was found that before processing the video, a Mean filter with a kernel size of 5 ∗ 5 was used to filter the original image with a size of 320 ∗ 240 pixels, and then the kernel size was used in the recognition stage. The 5 ∗ 5 Gaussian filter performs Gaussian filter on the proposed target area with a size of 32 ∗ 24 pixels. This method has a better effect. Therefore, it is finally decided to use the Mean filter to perform the mean filter processing on the entire image in the preprocessing stage, and to use the Gaussian filter to perform the gaussian filter on the proposed target area in the recognition stage.
Table 3-1: Comparison results of mean filter and Gaussian filter.
Filter method Nuclear radius Image size Filter effect Time
Mean filter 5 ∗ 5 320 ∗ 240px Figure3-2(2) 2.17ms
Gaussian filter 5 ∗ 5 320 ∗ 240px Figure3-2(3) 0.81ms
Mean filter 5 ∗ 5 320 ∗ 240px Figure3-3(2) 0.21ms
Gaussian filter 5 ∗ 5 320 ∗ 240px Figure3-3(3) 0.13ms
22
For prove the influence of image filter on image recognition, the images with Gaussian filter and without Gaussian filter were used as input data. On the same training set and test set, the same structure of CNN was used for test. The experimental results are as show in Table 3-2.
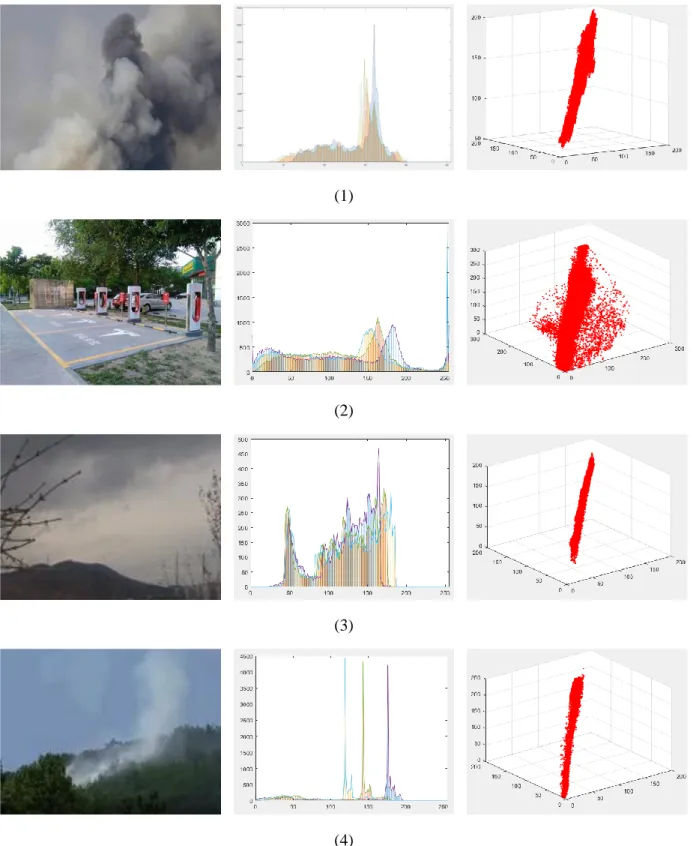
Table 3-2: Comparison of the influence of image filtering on the recognition rate of CNN.
Filter method Nuclear radius Classifier Image content Recognition rate
Gaussian filter 5 CNN Smoke and
non-smoke 96.55%
Unfiltered / CNN Smoke and
non-smoke 94%
The CNN and data set used in the experiment here are consistent with those introduced in Section 4.2, and the recognition rate is the recognition rate of the CNN in the test data set. The results show that after the input image is processed by Gaussian filter, the recognition rate is 96.55%, and the recognition rate without processed by Gaussian filter is 94%, indicating that filter has a certain influence on the recognition rate of the CNN. At the same time, it is found in experiments that if the image input to the network is not filtered, the CNN is prone to overfitting during the training process, which causes the network to fail and cannot effectively determine the image type.
3.1.4 Summary
This section introduced the two filter algorithms of Mean filter and Gaussian filter. After comparative experiments and actual tests, comprehensively considering the influence of Mean filter and Gaussian filter on the final recognition effect of the system, it is finally determined to use Mean filter method to filter the entire image, use Gaussian filter as a method for filter candidate regions. A simple classification test illustrates the importance of filter in image processing. In the next chapter, will introduce how to extract the smoke ROI. The ROI is the image area initially extracted from the entire image, indicating that the area has a certain possibility of being a smoke area. The ROI is selected to reduce the input during classification.
improve the efficiency of the system.
23
3.2 Extract the Motion Area
Because the computational complexity of image processing algorithms is relatively large, and the image data is two-dimensional, every time the image increases, the amount of calculation increases in exponential growth. However, video processing requires real-time performance. Generally, the ROI in the video only occupies a small part of the entire video image area, so for facilitate rapid processing of video data, can first extract the ROI in the video, and then perform further processing on the ROI.
In the research process of this thesis, found that after the appearance of smoke, due to the fluidity of the air, the smoke will always be in a moving state. According to this characteristic, the moving area in the video can be extracted first, but the moving area is not necessarily all smoke area. The area may also be moving cars, white cloud and smog, human and other objects, so after extracting the moving area, further processing is needed to determine whether the area is a smoke area.
Commonly used methods for extracting motion regions are optical flow method, inter-frame difference (IFD) method, Gaussian mixture model (GMM) method, etc. Due to the relatively large calculation in the optical flow method, this method is directly abandoned, and the method of extracting the motion area is selected in two methods: the IFD and the GMM method.
3.2.1 Inter-frame Difference Method to Extract Motion Regions
The basic idea of the inter-frame difference method for extracting the motion area is to compare the difference between the two consecutive images (or a few frames in between) in the video. If the difference is greater than a certain threshold, it is regarded as moving in the video part, and the difference is regarded as the movement area.
The principle of the IFD method can be expressed as the formula (3-8).
𝐷(𝑥, 𝑦) = {1, 𝑖𝑓|𝐼𝑡− 𝐼𝑡−1| > 𝑇 0, 𝑜𝑡ℎ𝑒𝑟𝑠
(3-8) Among them, 𝐷(x, y) represent the difference image of the two images before and after, 1 represent white, represent the motion area, 0 represent black, the non-motion area, 𝐼𝑡 and 𝐼𝑡−1 represents the original image at time 𝑡 and (𝑡 − 1)respectively, and 𝑇 represent the threshold value, that is When the number of non-zero points in the image is greater than 𝑇, it means that the motion area is acquired, and the difference image is binarized, then the white area in the binarized image represents the motion area.
The advantage of the IFD method to extract the motion area is that it is simple in operation, sensitive to the moving part and has good adaptability to external interference factors such as light. However, the
24
disadvantage is that it cannot accurately extract the position of the motion area and cannot completely extract it, and the target area is prone to voids.
3.2.2 Gaussian Mixture Model to Extract Motion Regions
The GMM is a commonly used method to establish a background image model in the research of background filter. The pixel value of the background image is generally not really fixed. The reasons for the change of the background pixel value include two categories.
1) Object movement. Including the movement of objects in the background image, such as the movement of branches blown by the wind, the movement of clouds, the movement of cars, the movement of humans, etc., as well as the changes caused by the shaking of the camera itself.
2) Changes in brightness. In a still image, even if the objects in the image are not moving, changes in the light in the external environment can also cause changes in the background pixel values, such as direct sunlight, flashing lights, and other objects blocking light.
The pixel changes caused by these changes generally make small changes near the original pixel value, and the distribution is very close to the gaussian distribution, so it is very suitable to use the gaussian distribution to model the distribution of background pixel values. However, in many cases, the distribution of pixel values does not just change around one value, but changes around multiple values, such as shaking leaves, moving cars, or shadow changes caused by the movement of light happening, etc. Therefore, it is a reasonable way to use multiple gaussian distributions to model the background.
The basic idea of the GMM is to select 𝐾 gaussian distributions, each gaussian distribution is called a component, and these components are linearly added to form the probability density function of GMM, as shown in (3-9).
P(𝑥) = ∑ πκ𝒩(𝑥|μκ, ∑κ)
Κ
κ=1
(3-9)
Among them, 𝐾 represent the number of gaussian distributions, 𝒩(𝑥|μκ, ΣΚ) represent the multivariate gaussian distribution, πκ represent the mixed weight value (mixture coefficient), and πκ satisfies0 ≦πκ≦ 1 𝑎𝑛𝑑 ∑𝐾κ=1πκ= 1.
Calculate the probability distribution of GMM using the pixel values of the first 𝑁 frame of images collection. Now that the probability density function is knowns, the parameters can be determined by maximum likelihood estimation. The likelihood function of GMM is as show in (3-10).
25
∑ log {∑ πkN
k
i=1
(X|μk, ∑k)}
k
i=1
(3-10)
Finally, use the Expectation Maximum Algorithm (EM) to calculate the parameters.
γ(i, k) = πkN(Xi|μk, ∑k)
∑kj=1πjN(Xi|μj, ∑kj) (3-11)
Nk = ∑ γ(i, k)
N
i=1
(3-12)
πk=Nk
N (3-13)
μk= 1
Nk∑ γ(i, k)Xi
N
i=1
(3-14)
∑k= 1 Nk
∑ γ(i, k)(Xi− μk)(Xi− μk)T
N
i=1
(3-15)
In the formula (3-11), γ(i, k) represent the probability that the i data has the k component.
Starting from the 𝑁 + 1 frame, it is determined whether each pixel in the image matches the constructed k Gaussian model. If the matching is unsuccessful, it is determined as the front scenic spot, otherwise it is the background point.
3.2.3 Experiment and Compare
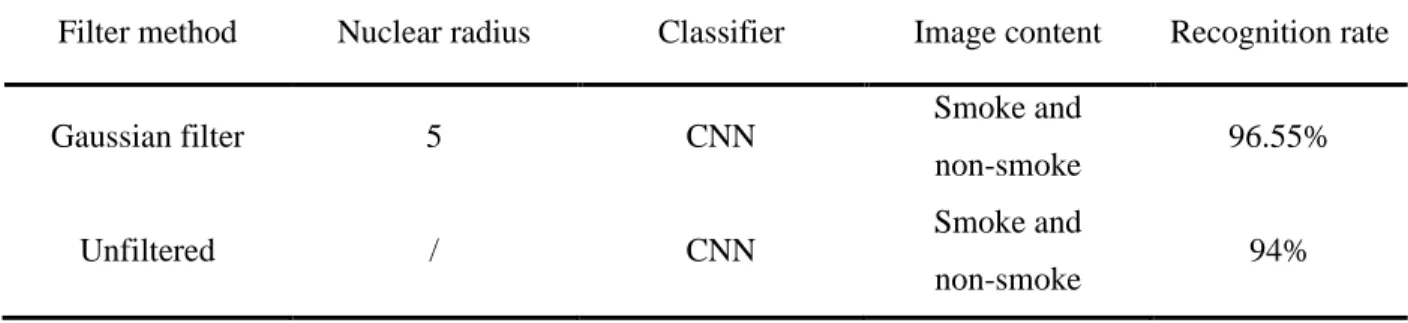
The effect of extracting background between frame difference method and GMM method is shown in the figure, where image (1) is the original image, image (2) is the motion area extracted by GMM method, and image (3) is the motion area extracted by IFD method.
From the comparison result, can get that the GMM can extract the motion area more accurately and completely, while the motion area extracted by the IFD method has holes and omissions. In addition, due
26
to the occurrence of leaf shaking in the wild environment, such as the regular and continuous movement of leaf shaking, for the inter-frame difference algorithm, each leaf shaking will be detected as a motion area, but like this regular and persistent movement is not the target area. For the GMM, a regular and continuous motion area like leaves, when a stable gaussian distribution is formed, the motion area extraction method based on the GMM will treat this area as a part of the background area, thus avoiding the interference of similar situations. The extracted background area will inevitably have some noises. These noises can be removed by mathematical morphological methods. For example, using "open operation" can remove isolated points in the image, and "close operation" can fill in small-scale holes in the image.
(1) (2) (3)
Figure 3-4: The motion area extracted by the GMM method (2) and the IFD method (3).
Because the location of the smoke is generally fixed in the video, when the smoke continues for a period of times, the GMM can easily determine the smoke area as a background image, which will cause the smoke area to be missed. The test found that it can pass reasonable increase the number of historical frames for gaussian modeling to alleviate this problem.
3.2.4 Summary
This section introduced how to use the algorithm model to extract the motion area in the video image, comprehensively analyzes the advantages and disadvantages of the optical flow method, the inter-frame difference method and the GMM method in extracting the motion area, the optical flow is complicated to calculate and is not suitable for real-time monitoring systems, the IFD method is simple to calculate, but the detection results are incomplete, the background subtraction effect is good, but the establishment of a good background model requires a lot of calculation and storage overhead. And finally determines the GMM through experiments, have better robustness, so the GMM is used as the algorithm to extract the motion area. In the next chapter, will analyze the color characteristics and motion characteristics of the smoke, and further filter the extracted motion regions.
27
3.3 Color Feature Analysis and Extraction of Smoke Area
The characteristics of smoke include color characteristics and motion characteristics, diffusion characteristics, wavelet energy, image entropy, etc. The color of the smoke produced by different burning materials is also different. For example, when petrochemical dyes are burned, black smoke will be emitted.
After investigation and research in this thesis, the color of early fire smoke is mainly gray and white. In addition, when the smoke is generated, it is caused by burning. As the air rises, the cold air falls to form air convection, and the smoke generally has a tendency move to upwards. In this thesis, color and motion features are mainly selected as features for detecting smoke candidate regions.
3.3.1 Features in the RGB Color Space
In the RGB color model, the different superpositions of the three colors of R/G/B can present a variety of different colors, and the value range of each color component is [0,255], 0 means that the color occupies the proportion of is the smallest, 255 means the proportion of the color is the largest, (255,0,0) means red, (0,0,0) means black, and (255,255,255) means white. The RGB color space uses the RGB color model.
Figure 3-5: RGB color model.
Smoke images can find some characteristics in the RGB color space. In the reference [57], the color of the smoke proposed the generally presents the characteristics close to the grayscale image. The color of the smoke can be divided into light gray and dark gray according to the gray level, which also indicates the R, G, B of the smoke image, the values of the three components are equal or close. Thus, the algorithm of smoke image in RGB color space is proposed, as shown in formula (3-16).
28 Rule1:
𝑅 + 𝛼 = 𝐺 + 𝛼 = 𝐵 + 𝛼 Rule2:
𝐿1≤ 𝐼 ≤ 𝐿2 (3-16)
Rule3:
𝐷1 ≤ 𝐼 ≤ 𝐷2 If (rule1) AND [(rule2) OR (rule3)] = TRUE
Then smoke pixel Else
not smoke pixel
The value of 𝛼 is 15~20, 𝐿1=150, 𝐿2=220, 𝐷1=80, 𝐷2=150. When the smoke is light gray, rule 2 is used, and when the smoke is dark gray, rule 3 is used.
This theory has a better recognition effect on smoke, but in outdoor smoke videos, due to the long shooting distance and low camera pixels, the image is blurred. In actual situations, non-smoke areas will also appear the color is close to the characteristics of the grayscale image, that is, the values of the three components of R, G, and B are close. This thesis did the following experiment to compare the characteristics of the smoke area and non-smoke area in the RGB color space in the outdoor fire smoke videos.
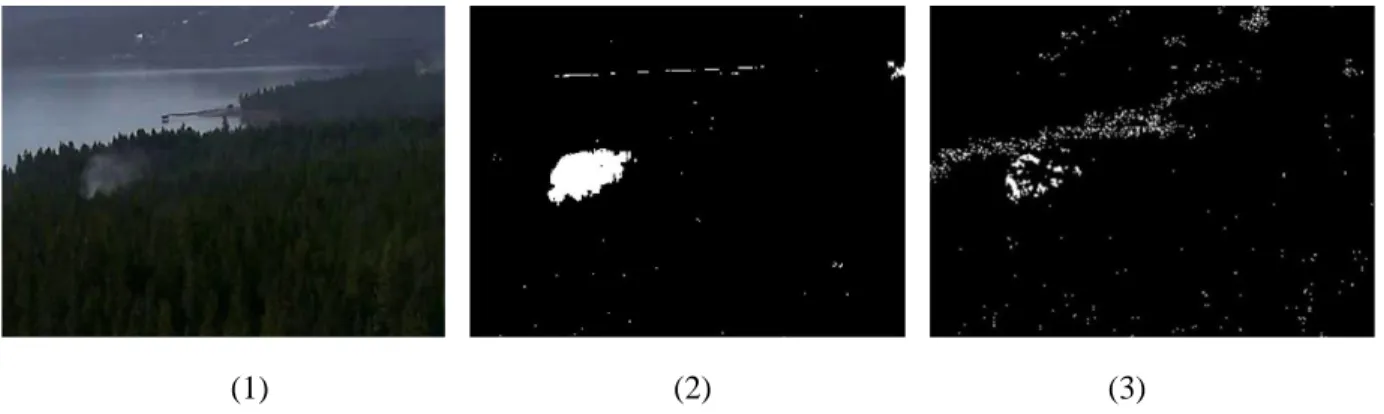
The above four groups of images are smoke images (Figure 3-6 (1)), non-smoke images in close-up (Figure 3-6 (2)), outdoor non-smoke images (Figure 3-6 (3)), and outdoor non-smoke images (Figure 3-6 (3)). The images after the smoke appears in the smoke area (Figure 3-6 (4)). The second image of each group is the statistics of the number of pixels in the R, G, and B color spaces of the first image. The horizontal axis represents all the pixels from the upper left corner to the lower right corner of the image. The vertical axis represents the size of the pixel value. The red, green, and blue lines respectively represent the three channels of each pixel in the image. The third image in each group is the representation of pixels in the RGB three- dimensional space. Through the analysis of the above chart, the following conclusions can be drawn.
29
(1)
(2)
(3)
(4)
Figure 3-6: Four comparison images and the two-dimensional and three-dimensional images of the R, G, B components of each images.
The above four groups of images are smoke images (Figure 3-6 (1)), non-smoke images in close-up (Figure 3-6 (2)), outdoor non-smoke images (Figure 3-6 (3)), and the image after the smoke appears in the smoke
30
area (Figure 3-6 (4)). The second image of each group is the statistics of the number of pixels in the R, G, and B color spaces of the first image, the horizontal axis represents all the pixels from the upper left corner to the lower right corner of the image, the vertical axis represents the size of the pixel value, the red, green, and blue lines respectively represent the three channels of each pixel in the image. The third image in each group is the representation of pixels in the RGB three-dimensional space. Through the analysis of the above chart, the following conclusions can be drawn.
1) For the smoke images (Figure 3-6(1)), from the RGB two-dimensional image, the spacing between the three curves is basically the same, and the difference is not very large. From the RGB three-dimensional image, the pixels are evenly distributed the non-smoke images (Figure 3-6(2)) in the close-range position is centered on the diagonal, and the non-smoke images taken at a closer distance. The color of the image is better and clearer. There are three in the RGB two-dimensional image. The interval of the curve is relatively uneven, and the distribution of the pixels in the RGB three-dimensional