Introduction
Magnesium sulfate is one of the most commonly prescribed medications in obstetrics. Over the past century, magnesium sulfate has been used as a tocolytic agent for the preven- tion and treatment of eclampsia and fetal neuroprotection
The effects of maternal body mass index and plurality on maternal and umbilical cord serum magnesium levels in preterm birth at less than 32 weeks of gestation
Yun Sun Choi, MD
1, Ji Young Hong, MD
1, Jee Youn Hong, MD
1, Yoo-Min Kim, MD
2, Ji-Hee Sung, MD
1, Suk-Joo Choi, MD, PhD
1, Soo-young Oh, MD, PhD
1, Cheong-Rae Roh, MD, PhD
1, Hye Seon Kim, MD
3, Se In Sung, MD, PhD
3, So Yoon Ahn, MD, PhD
3, Yun Sil Chang, MD, PhD
3Department of Obstetrics and Gynecology, 1Samsung Medical Center, Sungkyunkwan University School of Medicine, 2Chung-Ang University Hospital, Chung-Ang University College of Medicine; 3Department of Pediatrics, Samsung Medical Center, Sungkyunkwan University School of Medicine, Seoul, Korea
Objective
To evaluate the effects of maternal body mass index (BMI) and plurality on maternal and umbilical cord serum magnesium levels after antenatal magnesium sulfate treatment.
Methods
This was a retrospective cohort analysis of 135 women treated with antenatal magnesium sulfate at less than 32 weeks of gestation between January 2012 and June 2018. Subjects were stratified into groups according to maternal BMI (group I [18.5–22.9 kg/m²], group II [23.0–24.9 kg/m²], and group III [≥25.0 kg/m²]) and plurality (singleton and twin). Univariable and multivariable analyses were performed to compare the umbilical cord serum magnesium levels between the groups.
Results
Maternal serum magnesium levels were not significantly different between the maternal BMI groups and singleton and twin pregnancies. Umbilical cord serum magnesium levels were significantly different among the maternal BMI groups (3.3±1.2 mg/dL in group I, 3.3±1.2 mg/dL in group II, and 4.0±1.4 mg/dL in group III, P=0.003). The trend of increase in magnesium levels was statistically significant (P=0.001, Jonckheere-Terpstra test). Umbilical cord serum magnesium levels were not significantly different according to plurality. However, in the multivariable analysis, maternal BMI and plurality were not significantly associated with umbilical cord serum magnesium levels after adjusting for indication and total dose of magnesium sulfate treatment, gestational age at delivery, mode of delivery, neonatal sex, and birth weight.
Conclusion
Maternal BMI and plurality were not significantly associated with maternal or umbilical cord serum magnesium levels after exposure to antenatal magnesium sulfate treatment.
Keywords:
Obesity; Twin; Magnesium sulfate; Preterm birth
Received: 2020.08.12. Revised: 2020.09.29. Accepted: 2020.10.21.
Corresponding author: Suk-Joo Choi, MD, PhD
Department of Obstetrics and Gynecology, Samsung Medical Center, Sungkyunkwan University School of Medicine, 81 Irwon- ro, Gangnam-gu, Seoul 06351, Korea
E-mail: [email protected] https://orcid.org/0000-0002-8946-4789
Cheong-Rae Roh has been an Editorial Board of Obstetrics & Gynecology Science;
however, he was not involved in the peer reviewer selection, evaluation, or decision process of this article. Otherwise, no other potential conflicts of interest relevant to this article was reported.
Articles published in Obstet Gynecol Sci are open-access, distributed under the terms of the Creative Commons Attribution Non-Commercial License (http://creativecommons.
org/licenses/by-nc/3.0/) which permits unrestricted non-commercial use, distribution, and reproduction in any medium, provided the original work is properly cited.
Copyright © 2021 Korean Society of Obstetrics and Gynecology https://doi.org/10.5468/ogs.20235
eISSN 2287-8580
[1]. In the United States, more than 700,000 newborns are exposed to antenatal magnesium sulfate per year [2]. Since it is commonly used, there is a large body of academic research examining the protocols, therapeutic effects, and side effects of magnesium sulfate [2,3]. However, concerns about safety and the potential toxicity of magnesium sulfate on mothers and fetuses remain.
Maternal side effects of magnesium sulfate treatment, such as flushing, sweating, respiratory depression, muscular pa- ralysis, tetany, hypotension, depressed reflexes, and cardiac arrest, are known to be related to the maternal serum level of magnesium sulfate [4,5]. Fetal and neonatal side effects of magnesium therapy include lethargy, hypotonia, respiratory depression, bone demineralization, and increased risk of in- traventricular hemorrhage and neonatal mortality [6]. These risks are known to increase with high doses or long-term use of drugs [7-11].
Magnesium concentrations can be affected by various fac- tors. The maternal body undergoes extensive physiologic changes during pregnancy, altering the pharmacokinetics and pharmacodynamic profiles of drugs. Maternal blood vol- ume increases by an average of 40–45% during pregnancy, and it is more pronounced during twin pregnancy [12]. These changes can affect the drug’s concentration in the body and, similarly, obesity can affect the volume of medication distribution. There have been several reports on the effect of maternal body mass index (BMI) and plurality on maternal or fetal/neonatal serum magnesium levels, but the results are inconclusive [13-17]. Moreover, there has been no study investigating the effects of plurality and BMI on maternal or fetal serum magnesium levels in the Korean population.
Therefore, we evaluated the effects of plurality and maternal BMI on maternal and umbilical cord serum magnesium levels after antenatal magnesium sulfate treatment.
Materials and methods
1. Study population and data collection
This was a retrospective cohort study of 135 pregnant wom- en and their 153 neonates exposed to antenatal magnesium sulfate treatment and born at less than 32 weeks of gesta- tion at a tertiary referral center in Seoul, Korea, between Jan- uary 2012 and June 2018. Fetal death and major congenital anomalies were excluded.
Medical records of mothers and neonates were reviewed independently by obstetricians and neonatologists. Research- ers blinded to maternal data, including the antenatal mag- nesium sulfate treatment, reviewed the neonatal data for the outcome. Maternal demographic characteristics included maternal age, BMI at magnesium sulfate treatment, parity, and plurality. Subjects were classified into 3 groups according to BMI using the definition of the World Health Organization Asia-Pacific Perspective [18]: group I, 18.5–22.9 kg/m² (nor- mal); group II, 23.0–24.9 kg/m² (overweight), and group III,
≥25.0 kg/m² (obese). Subjects were reclassified into 2 groups according to plurality as a singleton and twin pregnancies.
One woman who was underweight (BMI<18.5 kg/m²) and 2 women with triplet pregnancies were excluded because the sample size was too small.
The antenatal treatments investigated were indications for antenatal magnesium sulfate treatment, total dose of magnesium sulfate use, and the type and cycle of antenatal corticosteroid treatment. Pregnancy outcomes included ges- tational age at delivery, indications for preterm delivery, and mode of delivery. Indications for preterm delivery were classi- fied into preterm labor, preterm premature rupture of mem- branes, and maternal-fetal indications such as pre-eclampsia, placenta previa, placenta abruption, and intrauterine growth restriction.
Neonatal outcomes included birth weight, sex, Apgar scores, mortality, necrotizing enterocolitis (≥stage 2b), spon- taneous intestinal perforation, duration of neonatal intensive care unit admission, duration of ventilator treatment, respira- tory distress syndrome, moderate to severe bronchopulmo- nary dysplasia, intraventricular hemorrhage (IVH) (≥grade 3), periventricular leukomalacia, early- and late-onset neonatal sepsis, retinopathy of prematurity (≥grade 3), and patent ductus arteriosus.
2. Magnesium sulfate treatment and magnesium level measurement protocol
Indications of antenatal magnesium sulfate treatment were
fetal neuroprotection and severe pre-eclampsia. The magne-
sium sulfate treatment protocol consisted of an intravenous
loading dose of 4 g over 15 to 20 minutes, followed by a
maintenance infusion of 1 g per hour. For fetal neuroprotec-
tion, magnesium sulfate was started for women with immi-
nent preterm birth within 24 hours. A maintenance dose was
infused until delivery if delivery occurred within 24 hours,
but it was discontinued if the delivery did not occur within 24 hours and was no longer considered imminent. The main- tenance dose was resumed if the risk of imminent delivery
recurred within 6 hours. A repeat loading dose and subse- quent maintenance therapy were administered if the risk of imminent delivery recurred after 6 hours. To treat severe
Table 1. Maternal characteristics, antenatal treatments and pregnancy outcomes according to maternal body mass index
Characteristics Group I (n=32) Group II (n=28) Group III (n=75) P-valuea)
Age (yr) 32.5±4.2 33.4±4.5 34.2±3.5 0.099b)
BMI (kg/m2) 21.2±1.0 23.8±0.8 29.4±3.5 <0.001b,c,d,e)
Multiparity 13 (40.6) 8 (28.6) 22 (29.3) 0.474
Plurality 0.579
Singleton 26 (81.3) 25 (89.3) 66 (88.0)
Twin 6 (18.8) 3 (10.7) 9 (12.0)
Gestational age at MgSO4 treatment (wk) 27.9±2.6 27.6±2.5 27.5±2.7 0.764
Indication for MgSO4 treatment <0.001b,c,d,e)
Neuroprotection 28 (87.5) 18 (64.3) 24 (32.0)
Severe preeclampsia 4 (12.5) 10 (35.7) 51 (68.0)
Total dose of MgSO4 (g) 4 (4–198) 4 (4–185) 22 (4–482) <0.001b)
Maternal serum Mg level 4.4±1.4 4.8±1.5 4.5±1.2 0.808
Interval from MgSO4 treatment to Mg level measurement (hr)
12 (4–35) 19 (11–113) 14 (5–106) 0.308
Antenatal corticosteroids use 30 (93.8) 27 (96.4) 68 (90.7) 0.586
Type of corticosteroids 0.869
Betamethasone 29 (96.7) 26 (96.3) 63 (92.6)
Dexamethasone 1 (3.3) 1 (3.7) 4 (5.9)
Mixedf) 0 (0.0) 0 (0.0) 1 (1.5)
Cycles of corticosteroids 0.983
Incomplete cycle 6 (20.0) 4 (14.8) 12 (17.6)
Complete cycle 20 (66.7) 20 (74.1) 48 (70.6)
Multiple cycles 4 (13.3) 3 (11.1) 8 (11.8)
Gestational age at delivery (wk) 28.0±2.5 27.8±2.6 27.9±2.5 0.947
<26 8 (25.0) 7 (25.0) 15 (20.0) 0.786
<28 15 (46.9) 13 (46.4) 38 (50.7) 0.898
<30 22 (68.8) 20 (71.4) 55 (73.3) 0.889
Indication for preterm delivery <0.001b,c,e)
PTL 10 (31.3) 8 (28.6) 14 (18.7)
PPROM 14 (43.8) 4 (14.3) 10 (13.3)
Maternal-fetal indication 8 (25.0) 16 (57.1) 51 (68.0)
Cesarean delivery 19 (59.4) 27 (96.4) 61 (81.3) 0.002b,c,e)
Data are presented as number (percentage), mean±standard deviation or median (range).
BMI, body mass index; MgSO4, magnesium sulfate; Mg, magnesium; PTL, preterm labor; PPROM, preterm premature rupture of membranes.
a)Analysis of variance, Kruskal-Wallis test or χ2 test; b)Significant trend by Jonckheere-Terpstra test or linear-by-linear association analysis; c)Signif- icantly different between the normal and overweight group (Bonferroni test); d)Significantly different between the overweight and obese group (Bonferroni test); e)Significantly different between the normal and obese group (Bonferroni test); f)Initial dexamethasone injection followed by rescue betamethasone injection.
pre-eclampsia and eclampsia, a maintenance dose was in- fused until delivery and discontinued 24 hours after delivery.
Magnesium sulfate was not used for tocolytics in our hospi- tal. Women treated with magnesium sulfate as tocolytics in other hospitals and transferred to our hospital were excluded because the exact protocol of magnesium sulfate treatment, including dose and duration, was unknown.
Maternal and umbilical cord serum magnesium levels were measured in the hospital laboratory by the endpoint calorimetric method using xylidyl blue (Cobas c 702; Roche Diagnostics, Basel, Switzerland). The first maternal serum magnesium level measured after magnesium sulfate infusion was used for the analysis, and the time interval from mag- nesium sulfate treatment (loading dose) to the first maternal
serum magnesium level measurement was calculated. Fetal magnesium and calcium concentrations were measured in the umbilical cord serum collected immediately after delivery.
3. Statistical analysis
The primary outcomes of this study were maternal and um- bilical cord serum magnesium levels. Continuous variables were compared using independent-sample parametric (Stu- dent’s t-test for comparison between 2 groups and analysis of variance for comparison among 3 groups) or nonparamet- ric (Mann-Whitney U test for comparison between 2 groups and Kruskal-Wallis test for comparison among 3 groups) tests depending on data normality. Categorical variables were compared using the χ
2test or Fisher’s exact test when
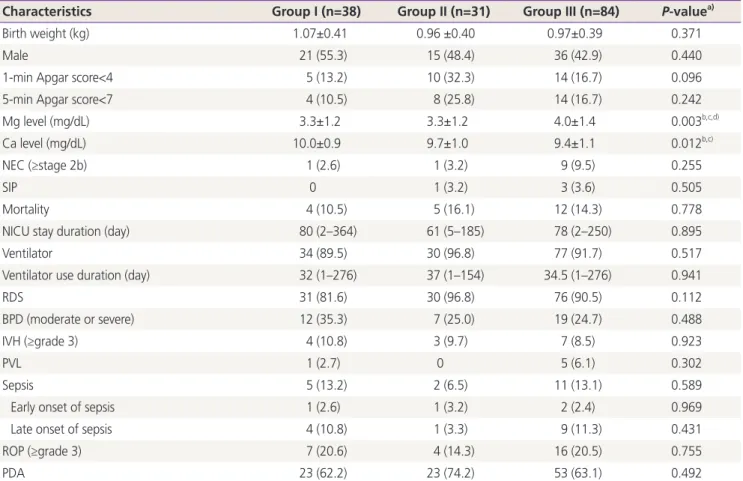
Table 2. Neonatal outcomes according to maternal body mass index
Characteristics Group I (n=38) Group II (n=31) Group III (n=84) P-valuea)
Birth weight (kg) 1.07±0.41 0.96 ±0.40 0.97±0.39 0.371
Male 21 (55.3) 15 (48.4) 36 (42.9) 0.440
1-min Apgar score<4 5 (13.2) 10 (32.3) 14 (16.7) 0.096
5-min Apgar score<7 4 (10.5) 8 (25.8) 14 (16.7) 0.242
Mg level (mg/dL) 3.3±1.2 3.3±1.2 4.0±1.4 0.003b,c,d)
Ca level (mg/dL) 10.0±0.9 9.7±1.0 9.4±1.1 0.012b,c)
NEC (≥stage 2b) 1 (2.6) 1 (3.2) 9 (9.5) 0.255
SIP 0 1 (3.2) 3 (3.6) 0.505
Mortality 4 (10.5) 5 (16.1) 12 (14.3) 0.778
NICU stay duration (day) 80 (2–364) 61 (5–185) 78 (2–250) 0.895
Ventilator 34 (89.5) 30 (96.8) 77 (91.7) 0.517
Ventilator use duration (day) 32 (1–276) 37 (1–154) 34.5 (1–276) 0.941
RDS 31 (81.6) 30 (96.8) 76 (90.5) 0.112
BPD (moderate or severe) 12 (35.3) 7 (25.0) 19 (24.7) 0.488
IVH (≥grade 3) 4 (10.8) 3 (9.7) 7 (8.5) 0.923
PVL 1 (2.7) 0 5 (6.1) 0.302
Sepsis 5 (13.2) 2 (6.5) 11 (13.1) 0.589
Early onset of sepsis 1 (2.6) 1 (3.2) 2 (2.4) 0.969
Late onset of sepsis 4 (10.8) 1 (3.3) 9 (11.3) 0.431
ROP (≥grade 3) 7 (20.6) 4 (14.3) 16 (20.5) 0.755
PDA 23 (62.2) 23 (74.2) 53 (63.1) 0.492
Data are presented as number (percentage), mean±standard deviation or median (range).
Mg, magnesium; Ca, calcium; NEC, necrotizing enterocolitis; SIP, spontaneous intestinal perforation; NICU, neonatal intensive care unit; RDS, respiratory distress syndrome; BPD, bronchopulmonary dysplasia; IVH, intraventricular hemorrhage; PVL, periventricular leukomalacia; ROP, reti- nopathy of prematurity; PDA, patent ductus arteriosus.
a)Analysis of variance, Kruskal-Wallis test or χ2 test; b)Significant trend by Jonckheere-Terpstra test or linear-by-linear association analysis; c)Signif- icantly different between the normal and overweight group (Bonferroni test); d)Significantly different between the overweight and obese group (Bonferroni test).
one or more expected values were less than 5. The Bonferro- ni test was used for post hoc analysis to correct for multiple comparisons. The trend was analyzed using the Jonckheere- Terpstra test for continuous variables and linear-by-linear association analysis for categorical variables. Multivariable linear regression analysis was used to evaluate the effects of potential confounding variables including an indication of magnesium sulfate treatment, gestational age at magnesium
sulfate treatment, the interval from magnesium sulfate treat- ment to magnesium level measurement, the total dose of magnesium sulfate infused, maternal BMI, and plurality for maternal serum magnesium level, gestational age at delivery, mode of delivery, neonatal sex, birth weight, maternal BMI, and plurality for umbilical cord serum magnesium level. A P- value of less than 0.05 was considered statistically significant.
For multiple comparisons, the P-value was adjusted to 0.017
Table 3. Maternal characteristics, antenatal treatments and pregnancy outcomes according to plurality
Characteristics Singleton (n=117) Twin (n=18) P-valuea)
Age (yr) 33.7±4.1 33.4±2.7 0.775
BMI (kg/m2) 26.4±4.6 25.7±3.7 0.519
Multiparity 42 (35.9) 1 (5.6) 0.010
Gestational age at MgSO4 treatment (wk) 27.7±2.6 27.5±3.1 0.780
Indication for MgSO4 treatment 0.177
Neuroprotection 58 (49.6) 12 (66.7)
Severe preeclampsia 59 (50.4) 6 (33.3)
Total dose of MgSO4 (g) 7.5 (4–482) 4.0 (4–88) 0.405
Maternal serum Mglevel 4.5±1.3 5.0±0.5 0.369
Interval from MgSO4 treatment to Mg level
measurement (hr) 14.5 (5–113) 16 (4–47) 0.957
Antenatal corticosteroids use 107 (91.5) 18 (100) 0.358
Type of corticosteroids 0.371
Betamethasone 102 (95.3) 16 (88.9)
Dexamethasone 4 (3.7) 2 (11.1)
Mixedb) 1 (0.9) 0
Cycles of corticosteroids 0.367
Incomplete cycle 17 (15.9) 5 (27.8)
Complete cycle 76 (71.0) 12 (66.7)
Multiple cycles 14 (13.1) 1 (5.6)
Gestational age at delivery (wk) 28.0±2.4 27.6±3.1 0.598
<26 24 (20.5) 6 (33.3) 0.232
<28 56 (47.9) 10 (55.6) 0.543
<30 86 (73.5) 11 (61.1) 0.276
Indication for preterm delivery 0.214
PTL 25 (21.4) 7 (38.9)
PPROM 24 (20.5) 4 (22.2)
Maternal-fetal indication 68 (58.1) 7 (38.9)
Cesarean delivery 90 (76.9) 17 (94.4) 0.120
Data are presented as number (percentage), mean±standard deviation or median (range).
BMI, body mass index; MgSO4, magnesium sulfate; Mg, magnesium; PTL, preterm labor; PPROM, preterm premature rupture of membranes.
a)Student’s t-test, Mann-Whitney U test, χ2 test or Fisher’s exact test; b)Initial dexamethasone injection followed by rescue betamethasone injec- tion.
(0.05/3) by Bonferroni correction. All statistical analyses were performed using the Statistical Package for Social Sciences version 25 (SPSS Statistics; IBM, Armonk, NY, USA).
Results
A total of 135 women (153 neonates) were included in this study. There were 32 women (38 neonates) in group I, 28 (31 neonates) women in group II, and 75 (84 neonates) women in group III. Among the 135 women, 117 were singleton pregnant women (117 neonates), and 18 were twin preg- nant women (36 neonates).
The baseline maternal characteristics, antenatal treatments, and pregnancy outcomes according to maternal BMI are
shown in Table 1. Indications for magnesium sulfate treat- ment, indications for preterm delivery, and mode of delivery were significantly different among the 3 groups. The total doses of magnesium sulfate infused were significantly dif- ferent among the 3 groups (P<0.001, analysis of variance), and they increased significantly with increasing maternal BMI (P<0.001, Jonckheere-Terpstra test). However, the interval from magnesium sulfate treatment to magnesium level mea- surement and maternal serum magnesium levels were not significantly different among the 3 groups.
Neonatal outcomes, according to maternal BMI, are pre- sented in Table 2. Umbilical cord serum magnesium levels were significantly different among the 3 groups (3.3±1.2 mg/
dL in group I; 3.3±1.2 mg/dL in group II; and 4.0±1.4 mg/dL in group III; P=0.003, Kruskal-Wallis test), and they increased
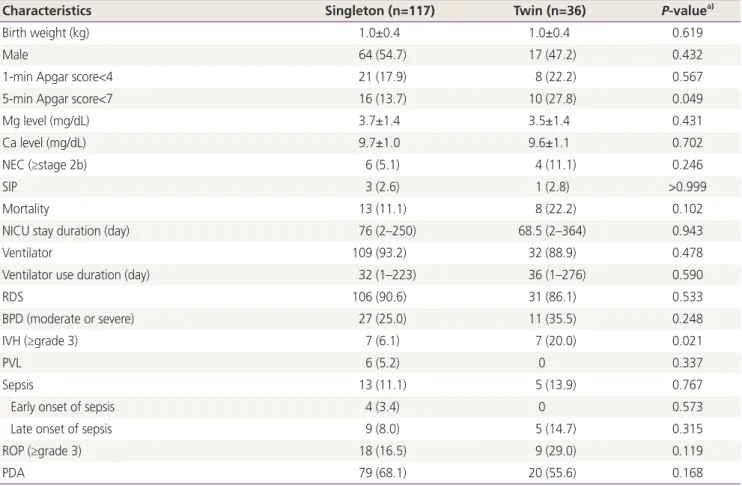
Table 4. Neonatal outcomes according to plurality
Characteristics Singleton (n=117) Twin (n=36) P-valuea)
Birth weight (kg) 1.0±0.4 1.0±0.4 0.619
Male 64 (54.7) 17 (47.2) 0.432
1-min Apgar score<4 21 (17.9) 8 (22.2) 0.567
5-min Apgar score<7 16 (13.7) 10 (27.8) 0.049
Mg level (mg/dL) 3.7±1.4 3.5±1.4 0.431
Ca level (mg/dL) 9.7±1.0 9.6±1.1 0.702
NEC (≥stage 2b) 6 (5.1) 4 (11.1) 0.246
SIP 3 (2.6) 1 (2.8) >0.999
Mortality 13 (11.1) 8 (22.2) 0.102
NICU stay duration (day) 76 (2–250) 68.5 (2–364) 0.943
Ventilator 109 (93.2) 32 (88.9) 0.478
Ventilator use duration (day) 32 (1–223) 36 (1–276) 0.590
RDS 106 (90.6) 31 (86.1) 0.533
BPD (moderate or severe) 27 (25.0) 11 (35.5) 0.248
IVH (≥grade 3) 7 (6.1) 7 (20.0) 0.021
PVL 6 (5.2) 0 0.337
Sepsis 13 (11.1) 5 (13.9) 0.767
Early onset of sepsis 4 (3.4) 0 0.573
Late onset of sepsis 9 (8.0) 5 (14.7) 0.315
ROP (≥grade 3) 18 (16.5) 9 (29.0) 0.119
PDA 79 (68.1) 20 (55.6) 0.168
Data are presented as number (percentage), mean±standard deviation or median (range).
Mg, magnesium; Ca, calcium; NEC, necrotizing enterocolitis; SIP, spontaneous intestinal perforation; NICU, neonatal intensive care unit; RDS, respiratory distress syndrome; BPD, bronchopulmonary dysplasia; IVH, intraventricular hemorrhage; PVL, periventricular leukomalacia; ROP, reti- nopathy of prematurity; PDA, patent ductus arteriosus.
a)Student’s t-test, Mann-Whitney U test, χ2 test or Fisher’s exact test.
significantly with increasing maternal BMI groups (P=0.001, Jonckheere-Terpstra test). Umbilical cord serum calcium levels were significantly different among the 3 groups (P=0.012, Kruskal-Wallis test), and they decreased significantly with maternal BMI (P=0.001, Jonckheere-Terpstra test). Other neonatal outcomes were similar among the 3 groups.
Baseline maternal characteristics, antenatal treatments, and pregnancy outcomes were not significantly different between the singleton and twin groups except for parity (Table 3). The total dose of magnesium sulfate infused, the interval from magnesium sulfate treatment to magnesium level measure- ment, and maternal serum magnesium levels were compa- rable between the singleton and twin groups. The umbilical cord serum magnesium levels (3.7±1.4 mg/dL in singletons and 3.7±1.4 mg/dL in twins; P=0.431) were not significantly different between the singleton and twin groups (Table 4).
Neonatal outcomes were comparable between the 2 groups, except for a higher rate of 1-minute Apgar score<7, and a higher rate of IVH (≥grade 3) in the twin group than in the singleton group.
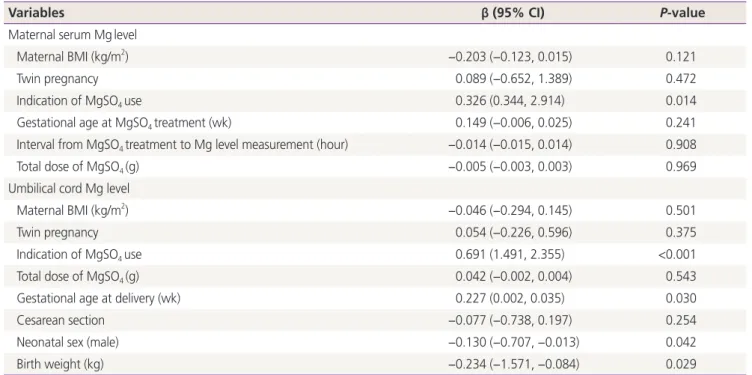
In the multivariable linear regression analyses, maternal serum magnesium levels were not associated with maternal BMI (β: −0.203; 95% confidence interval [CI], −0.123–0.015;
P=0.121) or plurality (β: 0.089; 95% CI, −0.652–1.389;
P=0.472) after adjusting for the indication of magnesium
sulfate treatment, gestational age at magnesium sulfate treatment, the interval from magnesium sulfate treatment to magnesium level measurement, and total dose of magne- sium sulfate infused (Table 5). Indication of magnesium sul- fate treatment was the only significant factor associated with maternal serum magnesium level. Umbilical cord serum mag- nesium levels were not also associated with maternal BMI (β: −0.046; 95% CI, −0.294–0.145; P=0.501) and a plurality (β: 0.054; 95% CI, −0.226–0.596; P=0.375) after adjusting for the indication of magnesium sulfate treatment, the total dose of magnesium sulfate infused, gestational age at deliv- ery, mode of delivery, neonatal sex, and birth weight (Table 5).
Indication of magnesium sulfate treatment, gestational age at delivery, neonatal sex, and birth weight were significantly associated with umbilical cord serum magnesium levels.
We analyzed the maternal and umbilical cord serum mag- nesium levels according to maternal BMI and plurality in women with pre-eclampsia. Maternal serum magnesium lev- els (5.0±0.5 mg/dL in group I; 4.9±1.3 mg/dL in group II; and 4.6±1.1 mg/dL in group III; P=0.411, Kruskal-Wallis test), and umbilical cord serum magnesium levels (5.6±1.4 mg/dL in the
Table 5. Multiple linear regression analyses of maternal and umbilical cord blood serum magnesium levels controlling for potential con- founding variables
Variables β (95% CI) P-value
Maternal serum Mglevel
Maternal BMI (kg/m2) −0.203 (−0.123, 0.015) 0.121
Twin pregnancy 0.089 (−0.652, 1.389) 0.472
Indication of MgSO4 use 0.326 (0.344, 2.914) 0.014
Gestational age at MgSO4 treatment (wk) 0.149 (−0.006, 0.025) 0.241
Interval from MgSO4 treatment to Mg level measurement (hour) −0.014 (−0.015, 0.014) 0.908
Total dose of MgSO4 (g) −0.005 (−0.003, 0.003) 0.969
Umbilical cord Mg level
Maternal BMI (kg/m2) −0.046 (−0.294, 0.145) 0.501
Twin pregnancy 0.054 (−0.226, 0.596) 0.375
Indication of MgSO4 use 0.691 (1.491, 2.355) <0.001
Total dose of MgSO4 (g) 0.042 (−0.002, 0.004) 0.543
Gestational age at delivery (wk) 0.227 (0.002, 0.035) 0.030
Cesarean section −0.077 (−0.738, 0.197) 0.254
Neonatal sex (male) −0.130 (−0.707, −0.013) 0.042
Birth weight (kg) −0.234 (−1.571, −0.084) 0.029
CI, confidence interval; Mg, magnesium; BMI, body mass index; MgSO4, magnesium sulfate.