Korean Circulation Journal
Introduction
Dyslipidemia is considered as a major risk factor of cardiovascular disease (CVD), such as hypertension, diabetes mellitus, myocardial in-
Print ISSN 1738-5520 • On-line ISSN 1738-5555
The Prevalence, Awareness and Treatment of High Low Density Lipoprotein-Cholesterol in Korean Adults Without Coronary Heart Diseases
- The Third Korea National Health and Nutrition Examination Survey, 2005 -
Sun-Ja Choi, MPH, Sung-Hee Park, PhD, Kwang-Soo Lee, PhD, and Hyun-Young Park, MD
Division of Cardiovascular and Rare Diseases, Center for Biomedical Science, National Institute of Health, Seoul, Korea
Background and Objectives: The purpose of this study was to estimate the prevalence, awareness and treatment of high low density li- poprotein-cholesterol (LDL-C) level in Korean adults without coronary heart disease.
Subjects and Methods: National representative cross-sectional surveys, data of 5248 Korean adults (2246 men and 3002 women) aged between 20 and 79 years from the Third Korea National Health and Nutrition Examination Survey (KNHANES III, 2005) was used. High LDL- C level was defined with the risk prediction algorithm published by the National Cholesterol Education Program Adult Treatment Panel III (NCEP ATP III).
Results: The prevalence of the Korean adults with high LDL-C level who need therapeutic lifestyle changes was 19.9%, treatment with lipid-lowing medication was 2.1% and awareness of this condition was 7.9%. Meanwhile, the prevalence of the Korean with very high LDL-C level who should be considered for drug therapy was 13.5%, treatment with lipid-lowing medication was 2.7% and awareness of this condition was 8.1%. Overall, 47.9% (60.3% in male and 39.1% in female) of participants had a single lipid disorder (high LDL-C, high triglycerides: ≥200 mg/dL, low high density lipo protein-cholesterol: <40 mg/dL), whereas 15.5% (23.5% in male and 9.7% in female) had at least two. Only 1.9% (2.8% in male and 1.2% in female) of all participants had all three lipid abnormalities as defined.
Conclusion: These findings indicate that continuous efforts are needed to increase awareness and treatment of high LDL-C level in our population to prevent cardiovascular disease. (Korean Circ J 2012;42:86-94)
KEY WORDS: Dyslipidemia; Low density lipoprotein-cholesterol; Coronary heart disease.
Received: June 14, 2009
Revision Received: September 10, 2009 Accepted: October 1, 2009
Correspondence: Hyun-Young Park, MD, Division of Cardiovascular and Rare Diseases, Center for Biomedical Science, National Institute of Health, 194 Tongil-ro, Eunpyeong-gu, Seoul 122-701, Korea
Tel: 82-2-380-1534, Fax: 82-2-388-0924 E-mail: [email protected]
• The authors have no financial conflicts of interest.
This is an Open Access article distributed under the terms of the Creative Commons Attribution Non-Commercial License (http://creativecommons.
org/licenses/by-nc/3.0) which permits unrestricted non-commercial use, distribution, and reproduction in any medium, provided the original work is properly cited.
farction, and stroke.
1-6)Recently, the Third Korea National Health and Nutri tion Examination Survey (KNHANES III, 2005) data showed that the prevalence of dyslipidemia has increased from 32.4% in 1998 to 44.1% in adults.
5)Dyslipidemia can be classified into hypercholesterole mia, hyper- triglycemia, low high density lipoprotein-cho lesterol (HDL-C) and high low density lipoprotein-cho lesterol (LDL-C). Dyslipidemia has been proven one of major risk factors of CVD in many studies, includ- ing Framingham Heart Study.
7-9)It is shown that the morbidity and mortality of coronary heart disease (CHD) can be decreased by lo- wering blood cholesterol level. By with the treatment of hypercho- lesterolemia, CHD mor tality can be reduced by 20 to 24%.
7)8)10)Managing dyslipidemia is known to have a great ef fect in prevent-
ing the development of CHD and their complications. National Cho-
lesterol Education Program Adult Treatment Panel III (NCEP ATP III) pro-
vided cli nicians with guidelines in the diagnosis and treatment of high
blood cholesterol.
The NCEP ATP III guidelines classify patients into CHD risk cate- gories, based on the presence of CHD, risk equivalents of CHD and mul- tiple risk factors accord ing to LDL-C level, to determine their 10-year CHD risk distribution.
11)Recently, the Guideline committee of the Korean So ciety of Lipidology and Atherosclerosis published the modification of the second edition of its dyslipidemia treatment guideline for Koreans.
12)This treatment guideline is somewhat simi- lar to the NCEP ATP III guideline, although lipid levels in Korean are lower than those of western popul ation.
In Korea, the prevalence of dyslipidemia has been on the increas- ing tendency continuously: it is higher in male (54.5%) than female (34.0%) across all age groups, and low HDL- C and hypercholester- olemia were the dominant subtype of dyslipidemia in Korea.
5)13)The KNHANES reported a treatment rate was only 6.8%, and 33.3% of patients reached treat ment target in patients over 20 years of age with high LDL-C level (LDL-C ≥160 mg/dL).
5)The problem with dyslipidemia control is the ‘treat ment gap’ ph- enomenon-meaning failure to adhere to the recommendations outlined in established treatment guideline.
14)16)17)Overcoming this
‘treatment gap’ is a crucial part to prevent CVD and improve its prog- nosis. For this reason, the United States has already been work ing to decrease the ‘treatment gap’ and to apply treat ment guideline in cli- nical practice.
14-17)There are many reports on the ‘treatment gap’ in Korea, raising ar- guments on their representativeness be cause most studies are car- ried out in subjects who visit ed hospitals and clinics.
17-19)This study was designed to analyze lipid levels according to CHD risk categories, and to investigate awareness and treatment rate of high LDL-C level in Korean adults without history of CHD using KNHANES in 2005.
Subjects and Methods
Study population
Our research was based on data obtained in the KN HANES III, a cross-sectional health survey of nationally representative samples of Koreans. The KNHANES was conducted in 2005 by the Korea Centers for Disease Control and Prevention. The target population for this survey was non-institutionalized individuals. The total po- pulation was 34145 for the purpose of primary sampl ing. Subjects were randomly sampled throughout South Korea, and included in the Health Interview Survey. From the total sample population, 7597 individuals completed the Health Examination Survey. In to- tal, 5352 individuals aged between the age of 20 and 79 constitut- ed the study population. Subjects diagnosed with CHD and those without measurement of lipid levels were ex cluded. The final num- ber of study subjects for the Ko rean dyslipidemia analysis was 5248
(2246 male and 3002 female).
Definition of diseases
Diabetes mellitus was defined as fasting blood glu cose level above 126 mg/dL, and/or treatment with in sulin or oral antidiabetic medic- ations, and/or being diagnosed with diabetes mellitus by a doctor.
Hyper tension was defined as systolic blood pressure (SBP) over 140 mm Hg and/or diastolic blood pressure (DBP) over 90 mm Hg, and/
or use of antihypertensive medica tions and/or diagnosed with hy- pertension by a doctor. Smoking status was classified as either cur- rently smok ing or non-smoking. Current smokers are defined as those who smoked more than 100 cigarettes in the past year. Non- smokers are those who do not smoke currently and those who smok- ed less than 100 cigarettes in the past year.
Blood pressure measure and blood analysis
Blood pressure was measured by trained investigator using stan- dardized technique.
Cuff size fitting arm circumference was chosen and the subject was sat in a chair a with back rest for 5 mi nutes to relax before blo- od pressure was measured three times with a Baumanometer to ob- tain the average pres sure. When blood pressure was only measured twice, average SBP and DBP from two measurements were used. Blo- od was collected from the vein following an 8-hour fasting state;
serum was separated and stored in refri gerated conditions. Samples were transported on the same day to the central institute for anal- yses within 24 hours. Fasting blood glucose, total cholesterol (TC), HDL -C and triglyceride (TG) were analyzed using a Hitachi 747 au- to-analyzer (Tokyo, Japan). LDL-C was calculated using the Friedewald formula, [LDL-C (mg/dL)=TC (mg/dL)-{HDL-C (mg/dL)+TG (mg/
dL)/5}] for those with TG level below 400 mg/dL.
20)High low density lipoprotein-cholesterol level according to National Cholesterol Education Program Adult Treatment Panel III guidelines
High LDL-C was classified according to the NCEP ATP III guidelines, taking into account the number of major CHD risk factors and Fr- amingham point score.
11)Age (male over 45, female over 55), hyper- tension, low HDL-C and current smoking status were defined as major CHD risk factors. The target LDL-C level was set according to NCEP ATP III.
11)In this study, subjects were divided into two groups by target LDL-C: one group in need of therapeutic lifestyle change (TLC) and the other in need of drug therapy (Table 1).
Awareness and treatment rate of high low density lipoprotein-cholesterol
The awareness and treatment rates of high LDL-C were defined
as follows: awareness rate was investigated by a survey asking for disease and diagnosis history among high LDL-C population, in- cluding previously diagnosed patients and newly diagnosed pati- ent of dy slipidemia. Treatment rate was investigated by a survey ask- ing whether or not they had been taking oral lipid lowering agents.
Statistical analysis
All data was analyzed using Statistical Package for the Social Sci- ences (SPSS) version 12.0 (SPSS, Inc., Chicago, IL, USA) and p<0.05 was considered statistically signi ficant. Continuous variables are expressed in mean±standard deviation, and discrete variables are ex- pressed in numbers and proportions. Differences in categori cal data were analyzed using the Chi-square test.
Results
General characteristics of the subjects
The general characteristics of the study population are shown in Table 2. The mean age of the subjects for male and female was 46.5 years and 46.1 years, respectively. Both male and female showed the highest distribution in the 40-49 age group (male 26.4%, female 24.6%). SBP and DBP were higher in male subjects than in female.
The prevalence of CHD risk factors-hypertension, dia betes and cur- rent smoking was significantly higher in male than in female subjects.
Subject distribution according to lipid levels
Distribution of lipid levels according to study subjects and age groups are shown in Table 3 and Fig. 1. TC level did not significantly differ by gender, but LDL-C level was higher in female. Distribution of TC and LDL-C levels did not differ significantly by gender. Mean HDL-C level was significantly lower in male (42.4 mg/dL) than in fe- male (47.3 mg/dL), and those with HDL-C levels lower than 40 mg/
dL were significantly more in male. Mean TG level was significantly higher in male than in female, and subjects with higher TG level than 200 mg/dL were twice as many in male (22.4%) as in female (9.6%) (p<0.001).
According to lipid levels by age group, high TC (TC ≥240 mg/dL) and high LDL-C (LDL-C ≥160 mg/dL) in male increased until 40-49 years and then decreased after 50 year of age. However, female showed continuous increase until 50-59 years of age and then de- creased. High TG (TG ≥200 mg/dL) in male increas ed until 40-49 years and then decreased after 50 years of age. However, female increased until 50 years old but the levels stabilized after 50s. Low HDL -C (HDL-C <40 mg/dL) in male didn’t differ signifi cantly by age Table 2. Basic characteristics of the study population by gender in KNHANES III
Variables Total (n=5248) Male (n=2246) Female (n=3002) p*
Age (years) 46.3±14.6 46.5±14.1 46.1±14.9 0.276
20-29 677 (12.9) 274 (12.2) 403 (13.4)
30-39 1216 (23.2) 497 (22.1) 719 (24.0)
40-49 1329 (25.3) 592 (26.4) 737 (24.6) 0.001
50-59 883 (16.8) 396 (17.6) 487 (16.2)
60-69 759 (14.5) 354 (15.8) 405 (13.5)
70-79 384 (7.3) 133 (5.9) 251 (8.4)
SBP (mm Hg) 118.7±17.5 122.5±15.8 115.9±18.2 <0.001
DBP (mm Hg) 77.3±10.8 80.8±10.3 74.7±10.3 <0.001
CHD risk factors, n (%)
Hypertension 1350 (25.9) 683 (30.6) 667 (22.3) <0.001
Diabetes mellitus 437 (8.4) 238 (10.7) 199 (6.7) <0.001
Current smoking 1154 (22.6) 1028 (47.7) 126 (4.3) <0.001
Values are mean±SD or n (%). *Difference between men and women by t-test or Chi-square test. KNHANES III: Third Korea National Health and Nutrition Examination Survey, SBP: systolic blood pressure, DBP: diastolic blood pressure, CHD: coronary heart disease
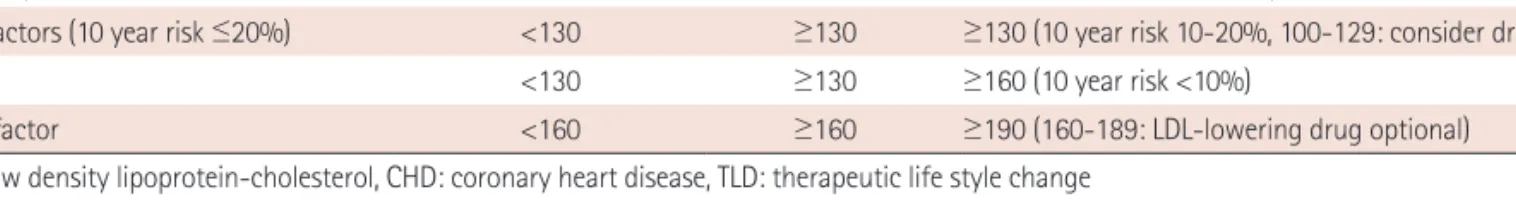
Table 1. LDL-C goals and cutpoints for therapeutic lifestyle changes and drug therapy in different risk categories
11)Risk category LDL-C goal (mg/dL) TLC (mg/dL) Consider drug therapy (mg/dL)
CHD risk equivalents (10 year risk >20%) <100 ≥100 100 (<100: consider drug options)
2+ risk factors (10 year risk ≤20%) <130 ≥130 ≥130 (10 year risk 10-20%, 100-129: consider drug options)
<130 ≥130 ≥160 (10 year risk <10%)
0-1 risk factor <160 ≥160 ≥190 (160-189: LDL-lowering drug optional)
LDL-C: low density lipoprotein-cholesterol, CHD: coronary heart disease, TLD: therapeutic life style change
groups, but female showed continuous in crease with age.
Distribution of subjects who need therapeutic life style change or drug therapy according to different risk categories in National Cholesterol Education Program Adult Treatment Panel III
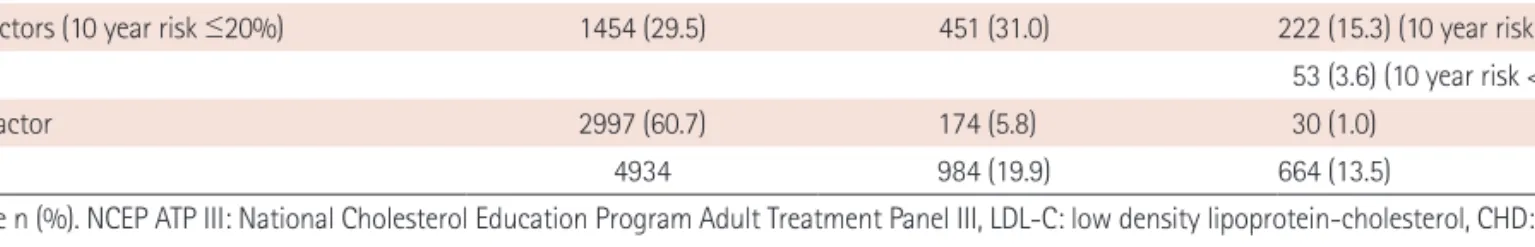
Subject distribution in need of TLC and drug therapy by risk cate- gories in regard to LDL-C level is shown in Table 4. Among Koreans over 20 years old without his tory of CHD, 9.8% had risks equivalent to CHD, 29.5% had more than two risk factors and 60.7% had less than two risk factors. Among 483 subjects with CHD-equi valent risks and/or a 10-year CHD risk of >20%, 359 subjects (74.3%) sh- owed LDL-C levels higher than 100 mg/dL in need of TLC and 74.3%
was in need of drug therapy with LDL-C levels over 100 mg/dL. Am- ong 1454 subjects with two or more CHD risk factors and a 10- year
CHD risk of ≤20%, 31.0% was in need of TLC with LDL-C levels over 130 mg/dL, and 18.9% was in need of drug therapy. Among subjects with 0-1 CHD risk factors, 5.8% was in need of TLC with LDL-C levels higher than 160 mg/dL and 1.0% was in need of drug therapy. Ra- tio of patients in need of aggres sive treatment was the highest in the group with CHD equivalent risk. 13.5% of the study population needed drug treatment.
Proportion of dyslipidemia by gender
Subjects with more than one lipid disorder were higher in male when the proportion of subjects with combined high LDL-C, high TG and low HDL-C was analyzed (Fig. 2). 60.3% of male had ≥1 lipid disorder among high LDL-C, high TG and low HDL-C, 23.5% had ≥2 lipid disorders and 2.8% had all three lipid abnormalities. 39.1% of female had ≥1 lipid disorder, 9.7% had ≥2 and 1.2% had all three Table 3. Mean value and distribution of lipid levels in KNHANES III
Variables Total Male Female p*
TC
Mean (mg/dL) 184.7±34.9 185.2±34.8 184.3±35.0 0.397
Distribution 0.378
<200 3641 (69.4) 1546 (68.8) 2095 (69.8)
200-239 1280 (24.4) 567 (25.2) 713 (23.8)
≥240 327 (6.2) 133 (5.9) 194 (6.5)
LDL-C
Mean (mg/dL) 114.0±30.2 113.0±30.4 114.7±30.0 0.043
Distribution 0.749
<100 1732 (33.9) 734 (34.2) 998 (33.6)
100-129 1964 (38.4) 828 (38.6) 1136 (38.3)
130-159 1079 (21.1) 452 (21.1) 627 (21.1)
160-189 272 (5.3) 109 (5.1) 163 (5.5)
≥190 66 (1.3) 23 (1.1) 43 (1.4)
HDL-C
Mean (mg/dL) 45.2±10.9 42.4±10.2 47.3±10.9 <0.001
Distribution <0.001
<40 1762 (33.6) 1013 (45.1) 749 (25.0)
40-59 2956 (56.3) 1094 (48.7) 1862 (62.0)
≥60 530 (10.1) 139 (6.2) 391 (13.0)
TG
Mean (mg/dL) 135.2±121.6 163.5±158.2 114.0±78.1 <0.001
Distribution <0.001
<150 3782 (72.1) 1387 (61.8) 2395 (79.8)
150-199 677 (12.9) 356 (15.9) 321 (10.7)
200-499 715 (13.6) 443 (19.7) 272 (9.1)
≥500 74 (1.4) 60 (2.7) 14 (0.5)
Values are mean±SD or n (%). *Difference between men and women by t-test or Chi-square test. KNHANES III: Third Korea National Health and Nutrition Ex-
amination Survey, TC: total cholesterol, LDL-C: low density lipoprotein-cholesterol, HDL-C: high density lipoprotein-cholesterol, TG: triglyceride
Fig. 1. The prevalence of TC, LDL-C, HDL-C, and TG levels by age group. TC: total cholesterol, LDL-C: low density lipoprotein-cholesterol, HDL-C: high density lipoprotein-cholesterol, TG: triglyceride.
TC (mg/dL)
TG (mg/dL) Age (years)
Age (years)
Age (years)
Age (years) 100
90 80 70 60 50 4030 20 10 0
10090 80 70 60 50 40 30 20 10 0
20-29 30-3 9 40-49 50-59 60-69 70-79
20-29 30-39 40-49 50-59 60-69 70-79
20-29 30-3 9 40-49 50-59 60-69 70-79
20-29 30-3 9 40-49 50-59 60-69 70-79
<200
150-199 200-499
<150 <40 40-59
<100 100-129 130-159 160-189
200-239 ≥240
≥500 ≥60
≥190 100
90 80 70 60 50 4030 20 10 0
100 90 80 70 60 5040 30 20 10 0
Distribution (%)Distribution (%) Distribution (%)Distribution (%)
LDL-C (mg/dL)
HDL-C (mg/dL) A. Male
TC (mg/dL)
TG (mg/dL) Age (years)
Age (years)
Age (years)
Age (years) 100
90 80 70 60 50 40 30 2010 0
100 90 80 70 60 50 40 3020 10 0
20-29 30-3 9 40-49 50-59 60-69 70-79
20-29 30-39 40-49 50-59 60-69 70-79
20-29 30-39 40-49 50-59 60-69 70-79
20-29 30-3 9 40-49 50-59 60-69 70-79
<200
150-199 200-499
<150 <40 40-59
<100 100-129 130-159 160-189
200-239 ≥240
≥500 ≥60
≥190 100
90 80 6070 50 40 30 20 10 0
100 90 80 6070 50 40 30 20 10 0
Distribution (%)Distribution (%) Distribution (%)Distribution (%)
LDL-C (mg/dL)
HDL-C (mg/dL) B. Female
types of dyslipidemia.
Awareness and treatment rate of high low density lipoprotein-cholesterol
The awareness and treatment rates of high LDL-C level are shown in Table 5. In 984 (19.9%) high LDL -C subjects, the awareness rate was 7.9% (male 7.3%, fe male 8.5%) and the treatment rate was 2.1% (male 1.2%, female 3.0%). The awareness and treatment rates of high LDL-C level were the highest in the 60-69 age group for both genders. The awareness rate in high LDL- C subjects who requir- ed drug therapy was 8.1% (male 7.2%, female 9.5%) and the treat- ment rate was 2.7% (male 1.5%, female 4.4%). The awareness and treatment rates in both male and female continuously increased from 20-29 to 60-69 years and then decreased from 70-79 years.
Female showed higher awareness and treatment rates than male.
When the results were analyzed by NCEP ATP III risk categories in regard to LDL-C level, both male and female with 0-1 CHD risk fac- tor show ed the lowest awareness and treatment rates. However, the awareness and treatment rates were still less than 8% in the group with CHD equivalent risks.
Discussion
Recently, cerebrovascular and cardiac diseases were respectively
the second and third cause of death, there fore CVD account for 20%
of overall death in Korea.
21)This study was designed to analyze the distribution of dys lipidemia, the prevalence of high LDL-C level ac- cording to the NCEP ATP III criteria and to make useful sugges tions that can lead to effective control strategies for high LDL-C level in the Korean population using NHANES in 2005.
The prevalence of hypertension in our study popul ation was 25.9%, which was slightly lower than the out come of 28.5% in a study conducted in adults, including CHD patients, over 20 years of age in the United States. However, the prevalence of diabetes (8.4%
vs. 8.8%) and the rates of current smoking (22.6% vs. 23.6%) were similar.
22)In our study, the prevalence of major CHD risk factors was also higher in male than female across all age group. Male demon- strated higher prevalence of hypertension (male 30.6%, female 22.3%), diabetes (male 10.7%, female 6.7%) and current smoking rate (male 47.7%, female 4.3%) than female. In addition, among the mean lipid levels, TG was higher in male (163.5±158.2 mg/dL) than female (114.0±78.1 mg/dL), however, LDL-C (male 113.0±30.4 mg/dL, female 114.7±30.0 mg/dL, p=0.043) and HDL-C (male 42.4±10.2 mg/dL, female 47.3±10.9 mg/dL, p<0.001) were lower in male than female.
Of the study subjects analyzed, 19.9% required TLC and 13.5%
required drug therapy according to NCEP ATP III. These results were lower than that of 28.0% and 25.3% from the United States study Table 4. Distribution of LDL-C for therapeutic lifestyle changes (TLC) and drug therapy in different risk categories by NCEP ATP III
Risk category Total TLC Consider drug therapy
CHD risk equivalents (10 year risk >20%) 483 (9.8) 359 (74.3) 359 (74.3)
2+ risk factors (10 year risk ≤20%) 1454 (29.5) 451 (31.0) 222 (15.3) (10 year risk 10-20%)
53 (3.6) (10 year risk <10%)
0-1 risk factor 2997 (60.7) 174 (5.8) 30 (1.0)
Total 4934 984 (19.9) 664 (13.5)
Values are n (%). NCEP ATP III: National Cholesterol Education Program Adult Treatment Panel III, LDL-C: low density lipoprotein-cholesterol, CHD: coronary heart disease
9.7 10.8
High LDL-C High LDL-C
Male (60.3%) Female (39.1%)
High TG Low HDL-C High TG Low HDL-C
2.8 1.2
9.3 3.4
1.5 9.9 0.9 4.2
4.9 22.2 2.9 15.6