J O U R N A L O F
Veterinary Science
pISSN 1229-845X, eISSN 1976-555X J. Vet. Sci. (2010), 11(4), 359-361 DOI: 10.4142/jvs.2010.11.4.359
Received: 05 Feb. 2010, Accepted: 28 May 2010
Case Report
*Corresponding author
Tel: +43-1-25077-5101; Fax: +43-1-25077-5190 E-mail: [email protected]
Table 1. Fructosamine and protein concentration of two dogs with IgA-monoclonal gammopathy before and during chemotherapy
Days of therapy
Fructosamine
(μmol/L) Total protein (g/dL)
Albumin (g/dL)
Globulin (g/dL) Case 1
0 654 10.54 1.60 8.90
10 583 10.67 1.47 9.20
24 519 9.77 1.93 7.84
116 447 8.59 2.49 6.10
383 307 8.43 2.72 5.71
Case 2
0 506 11.02 1.94 9.98
7 398 9.22 1.86 7.36
19 243 6.16 2.37 3.78
128 146 7.38 2.62 4.76
Reference range
< 370 6 to 7.5 2.6 to 4.7 1.5 to 3.5
Elevated fructosamine concentrations caused by IgA paraproteinemia in two dogs
Florian Zeugswetter
1,*, Miriam Kleiter
1, Birgitt Wolfesberger
1, Ilse Schwendenwein
2, Ingrid Miller
3Departments of
1Companion Animals and Horses,
2Pathobiology, and
3Biomedical Sciences, University of Veterinary Medicine, Vienna, Austria
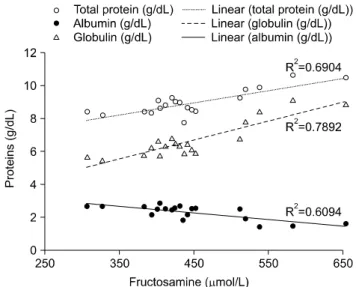
An 8-year-old male Austrian Pinscher and a 14-year-old male Golden Retriever were presented for evaluation due to unexplainable high fructosamine values despite euglycemia and epistaxis in combination with polydipsia/polyuria, respectively. Blood analysis revealed severe hyperglobulinemia, hypoalbuminemia and markedly elevated fructosamine concentrations in both dogs. Multiple myeloma with IgA- monoclonal gammopathy was diagnosed by serum and urine electrophoresis including immunodetection with an anti-dog IgA antibody and bone marrow aspirations. Diabetes mellitus was excluded by repeated plasma and urine glucose measurements. Fructosamine values were positively correlated with globulin, but negatively correlated with albumin concentrations. These cases suggest that, as in human patients, monoclonal IgA gammopathy should be considered as a possible differential diagnosis for dogs with high fructosamine concentrations.
Keywords: dogs, fructosamine, monoclonal IgA, paraproteinemia
Fructosamines are glycated proteins that are measured to identify diabetes mellitus and as indicators of glycemic control [4,9]. Their concentration is not influenced by acute hyperglycemia [6], but misleading elevations are possible in hypothyroid patients [8]. Because fructosamines are the product of the spontaneous condensation of glucose with primary amines followed by Amadori rearrangement, their concentrations also depend on protein concentration, turnover and composition [4]. The specific proteins involved are currently not well established, but there is a great deal of evidence that albumin is a major contributor. Studies conducted in dogs identified positive correlations between albumin and fructosamine, but little or no correlation between total protein and fructosamine concentration [4,9].
Because hyperglobulinemia commonly leads to compensatory hypoalbuminemia, fructosamine values are usually low in markedly hyperglobulinemic patients.
However, exceptional cases of unknown cause have been reported [9]. Here, markedly elevated fructosamine concentrations in two nondiabetic dogs with a monoclonal IgA-gammopathy are described.
Case No. 1
An 8-year-old 21 kg male Pinscher was presented with a
2-week history of vague gastrointestinal signs (inconsistent
appetite, flatulence) and lethargy. An extended health check
up-profile (IDEXX Vet Med Labor, Germany) revealed
unexplainable high fructosamine concentrations as determined
based on a colorimetric test conducted using a Roche Hitachi
91 Chemistry Analyzer (Boehringer, Germany; Table 1),
despite euglycemia (5.2 mmol/L, reference range 3-5.6
360 Florian Zeugswetter et al.
Fig. 1. Routine serum electrophoresis on a cellulose acetate strip with plastic support of a dog (Case 1) conducted using an automated system.
Fig. 2. Serum protein pattern of a dog (Case 1) with monoclonal gammopathy as determined by SDS-PAGE (8 × 6 cm gels with 10- 15% polyacrylamide gradient) and detection of the immunoglobulin class. General protein staining (silverstain). Samples from time course (before and during therapy), run under reducing conditions:
Lane 1: Molecular weight standard, Lane 2: Dog IgG pure substance, Lane 3: Serum of a healthy dog, Lanes 4-9: Serum samples from time course, at: 23 days before therapy and on the 10th, 24th, 50th, 69th, and 88th day of therapy; samples of this patient were more dilute than the healthy control. SA: serum albumin; MAb: monoclonal antibody (IgA class, consisting of heavy (α-) and light chains (L-)).
Fig. 3. Regression of serum fructosamine and total serum protein, globulin and albumin concentrations of a dog (Case 1) with IgA paraproteinemia before and during therapy. The lines represent the regression lines.
mmol/L) and normal serum thyroxine values (24.5 nmol/L, reference range 19.3-58 nmol/L; measured using a DPC Immulite 1000; Siemens, USA). Severe hyperglobulinemia associated with hypoalbuminemia was also detected (Table 1). The differential diagnosis for hyperglobulinemia in the absence of hyperalbuminemia included polyclonal (chronic inflammation or infection) and monoclonal (lymphoid tumors) gammopathy. The dog was found to be negative for leishmania antibodies (immunofluorescence), ehrlichiosis and anaplasmosis (PCR). No osteolytic lesions or lung metastasis were observed upon radiographic examinations.
A bone marrow needle aspiration from the ileum crest was conducted. Due to cluster formation, an exact cell count of the bone marrow aspirate could not be obtained, but plasma cells likely represented > 30% of all nucleated cells. Routine serum electrophoresis on cellulose acetate strips (Interlab Genio Electrophoresis-System, Densitometric Scanning, Elfolab Software; Menarini Diagnostics, Austria) displayed a large peak in the beta/gamma globulin region, comprising about 70% of the overall serum protein (Fig. 1). An additional SDS-PAGE conducted under reducing conditions [5] revealed a monoclonal gammopathy of IgA class (Fig. 2), evidenced by a prominent band at 59 kD (the α - = heavy chain) and a very narrow and distinct light chain of 28 kD. In contrast, light chains of polyclonal immunoglobulins display much larger heterogeneity and thus a much broader band, as seen in the control sample (Lane 3 of Fig. 2) or in IgG preparations (Lane 2 of Fig. 2) [7]. The immunoglobulin class was further confirmed in an immunoblot with an anti-dog IgA antibody ( α -chain specific; Bethyl Laboratories, USA). Small amounts of monoclonal antibody could also be detected in the urine. The diagnosis of IgA-multiple myeloma was based on the increased serum concentration of monoclonal immunoglobulins, proteinuria and dominance of plasma cells in the bone marrow. Oral therapy was started with 0.1 mg/kg melphalan hydrochloride (Alkeran; GlaxoSmithKline,
Austria) and 0.5 mg/kg prednisolone (Nycomed; Nycomed,
Austria) SID. After ten days, the melphalan was reduced to
0.05 mg/kg SID and prednisolone was reduced to 0.5 mg/kg
EOD. Upon treatment, the well-being of the dog clearly
improved and changes in the albumin and IgA levels were
observed in the electrophoretic patterns. Specifically, the IgA
concentrations decreased and the albumin band became
more prominent (both seen as changes in the thickness and
intensity of the respective bands in Fig. 2, Lanes 4-9). The
Fructosamine concentration in dogs with IgA paraproteinemia 361