서론
뇌혈관 질환은 위치와 정도가 질병의 예후와 밀접한 관련이 있다(1). 따라서 이를 정확히 평가하기 위한 진단방법의 선택이 중요한데, 자기공명영상(magnetic resonance imaging; 이하 MRI) 중에서도 비교적 비침습적이며 검사시간이 짧은 자기공명 혈관조영술(magnetic resonance angiography; 이하 MRA)은 특히 두개(intracranial) 내 혈관의 폐색이나 동맥류 환자에서 이미 그 유용성을 널리 인정받고 있다(2-4). 근래에는 3.0 테슬 라(tesla; 이하 T)의 고자장 자기공명영상기기가 개발되어 임상
에서 널리 사용 중이다. 3.0T MRA는 자장의 세기가 증가함에 따라 신호대잡음비(signal to noise ratio, SNR)가 향상되고 말 단 부위 혈관까지도 비교적 잘 관찰할 수 있도록 공간 분해능 을 증가시킴과 동시에 검사시간을 단축시킬 수 있는 등 양질의 영상을 얻을 수 있는 장점이 있다(5-7). 그러나 자장의 증가에 따른 자기감수성효과(magnetic susceptibility effect)에 기인한 인공음영이 증가하는 등의 문제점이 발생한다(8-10). 최근 임상 에서 의뢰되는 MRA 검사 환자 중 심미적인 만족 또는 사고나 노령으로 인하여 치아교정장치(Orthodontic device)를 부착한 환자가 증가하고 있는데(11), 이러한 치아교정장치는 주로 자
J Korean Soc Radiol 2011;65(1):1-8
Received October 4, 2010; Accepted March 2, 2011 Corresponding author: Dong Hun Kim, MD Department of Radiology, Chosun University Hospital, 588 Seoseok-dong, Dong-gu, Gwangju 501-717, Korea.
Tel. 82-62-220-3543 Fax. 82-62-228-9061 E-mail: [email protected]
Copyrights © 2011 The Korean Society of Radiology
Purpose: To evaluate the degree of image distortion caused by orthodontic devices during a intracranial magnetic resonance angiography (MRA), and to determine the effectiveness of the 3 dimensional phase-contrast (3D PC).
Materials and Methods: Subjects were divided into group A (n = 20) wearing a home-made orthodontic device, and group B (n = 10) with an actual orthodontic device. A 3.0T MR scanner was used, applying 3D time-of-flight (TOF) and 3D PC.
Two board-certified radiologists evaluated images independently based on a four point scale classifying segments of the circle of Willis. Magnetic susceptibility varia- tions and contrast-to-noise ratio (CNR) on maximum intensity projection images were measured.
Results: In group A, scores of the 3D TOF and 3D PC were 2.84 ± 0.1 vs. 2.88 ± 0.1 (before) and 1.8 ± 0.4 vs 2.83 ± 0.1 (after wearing device), respectively. In group B, the scores of 3D TOF and 3D PC were 1.86 ± 0.43 and 2.81 ± 0.15 (p = 0.005), re- spectively. Magnetic susceptibility variations showed meaningful results after wear- ing the device (p = 0.0001). CNRs of the 3D PC before and after wearing device were 142.9 ± 6.6 vs. 140.8 ± 7.2 (p = 0.7507), respectively. In the 3D TOF, CNRs were 324.8 ± 25.4 vs. 466.3 ± 41.7 (p = 0.0001).
Conclusion: The 3D PC may be a solution method for distorted images by magnetic susceptibility in the intracranial MRA compared with 3D TOF.
Index terms
Magnetic Resonance, Angiography Magnetic Resonance, Artifact Magnetic Resonance, Time of Flight Magnetic Resonance, Phase Contrast
Image Quality of the 3 Dimensional Phase-Contrast Technique in an Intracranial Magnetic Resonance Angiography with Artifacts Caused by Orthodontic Devices: A Comparison with 3
Dimensional Time-of-Flight Technique
1치과용 교정장치로 인한 인공물을 보인 두개 내 자기공명 혈관조영술의 3차원 위상대조 기법을 이용한 질 평가: 3차원 흐름시간 기법과의 비교
1Sung Jin Kang, MD
1, Young Soo Kim, MD
1, Hyun Sook Hong, MD
1, Dong Hun Kim, MD
21Department of Radiology, Soonchunhyang University College of Medicine, Bucheon, Korea
2Department of Radiology, Chosun University School of Medicine, Gwangju, Korea
정량적으로 비교하고, 3D PC MRA 기법의 유용성을 평가하고 자 하였다.
대상과 방법
검사대상
연구는 다양한 자기감수성 환경에 의한 MRA 영상의 왜곡정 도를 반영하기 위하여 20명의 대조군(group A)과 10명의 환자 군(group B)으로 나누어 각각 진행하였다. 연구 시작에 앞서 모 든 대조군 지원자와 환자들에게 충분히 설명한 후 연구에 대한 동의를 받았다. 대조군은 현재 뇌혈관 질환과 관련한 병력 및 임상적 증상이 없는 건강한 지원자 20명(남자 14명, 여자 6명, 연령범위 23~38세, 평균나이 28.1세)을 대상으로 하였고, 최대 한 동일한 자기감수성 환경을 유지하며 객관적이며 정량적인 분석을 하기 위하여 자체 제작한 모형치아교정장치를 사용하였 다(Fig. 1A). 환자군은 실제 치아교정의 목적을 가지고 다양한 형태의 치아교정장치를 부착하고 있으면서 현재 뇌혈관 질환과 관련한 병력이 없으나 두통을 주소로 내원하여 뇌혈관 검사를 진행하게 된 10명(남자 1명, 여자 9명, 연령범위 24~37세, 평 균나이 28세)을 대상으로 하였다(Fig. 1B). 대조군은 모형치아 교정장치의 착용 전과 후를, 환자군은 치아교정기 착용 상태 그대로 MRA를 촬영하였다.
MR 영상기법
MRA영상의 획득은 3.0T MR 장치(Signa 3.0T HDxt. GE Healthcare, Waukesha, WI, USA)와 8채널의 신경혈관계 배열 코일(HD 8-channel Neurovascular array coil, GE Healthcare, Waukesha, WI, USA)을 이용하였다. 3D TOF 기법과 3D PC (Inhance 3D velocity in GE) 기법을 사용하여 각각의 MRA 영 상을 획득하였으며 영상 매개변수는 Hiai 등(18)이 팬텀을 이용 한 연구에서 제안한 변수를 사용하였다. 각 MRA 기법별 영상 변수는 다음의 표와 같다(Table 1). 두 MRA 기법 모두 윌리스 동맥륜(circle of Willis)을 충분히 포함시키는 큰구멍-마루점 (foramen magnum-vertex) 방향으로 105 mm 영상범위 및 영 상의 공간분해능을 동일하게 설정하였다. 또한 검사시간 감소 를 위해 민감도 부호화(sensitivity encoding; 이하 SENSE) 기 법을 기반으로(15, 16) 한 평행영상(parallel imaging, ASSET in GE) 기법을 모두 적용하였고 가속인자(acceleration factor) 는 2.0으로 설정하였다(17). 검사시간은 3D TOF 기법이 평균 250 ± 16초, 3D PC 기법이 200 ± 17초였다. 3D TOF MRA 는 다중중복세편판획득(multiple overlapping thin-slab acquisi- tions, MOTSA) 기법을 이용하여 34 mm의 편판 3개를 6 mm 장의 왜곡을 초래하는 금속물질로 되어 있어서 MRA 검사시 정
확한 혈관영상 생성에 커다란 장애가 되고 있다. 따라서 정확한 MRA 검사를 위하여 교정장치를 제거해야 하고, 이후 재부착을 하면 교정치료의 효율이 감소하고 교정 기간이 연장되는 등의 문제가 발생한다(12, 13). 임상에서 일반적으로 사용되고 있는 3차원 흐름시간(3 dimensional time of flight; 이하 3D TOF) MRA 기법은 이러한 금속물질로 인한 자장왜곡에 민감한 검사 기법이어서 치아교정장치를 부착한 환자에게는 효용성이 떨어 진다(14). 반면, 3D 위상대조(phase contrast; 이하 PC) MRA 기법은 배경신호 억제가 뛰어나고 평행영상(parallel imaging) 기법을 이용하여 빠르게 촬영할 수 있다(15-17).
따라서 본 연구는 치아교정장치에 의한 영상왜곡의 정도를 3D TOF MRA와 3D PC MRA 기법을 각각 적용하여 정성적,
Fig. 1. Photograph of home-made orthodontic device model in group A (A) and patient wearing therapeutic orthodontic device in group B (B).
A
B
획득된 각각의 MRA 영상은 진단용 모니터(Nio 5MP, BAR- CO, Kortrijk, Belgium)를 이용하여 축상면 근원 영상(axial source images)과 최대강도투영(maximum intensity projec- tion; 이하 MIP)기법의 영상을 동시에 활용하여 2명의 영상의 학과 전문의(각각 23년, 9년 경력)가 관찰한 후 합의하여 평가 하고 그 결과를 바탕으로 통계적 유의성 검증을 하였다. 또한 대조군에서는 자기감수성 환경의 변화에 의한 최대강도투영 영 상의 투영 정도를 평가하기 위하여(21) 모형치아교정장치의 착 용 전, 후에 따른 혈관 외 배경신호의 제거상태(background suppression)를 MRA 기법별로 정량적으로 평가하였다. 정량적 평가를 위해서 MIP 영상의 하악마루점 투영(submentovertex projection)방향에서 양측 안와 후방 지방조직 부위에 50 ± 5 mm2의 관심영역(region of interest, ROI)을 선정하여 평균 신호 강도(signal intensity, SI) 및 대조도대잡음비(contrast to noise ratio; 이하CNR)를 측정하고 통계적 유의성을 알아보았다.
통계기법
통계적 분석에는 STATA SE 9.2버전을 사용하였고 일반적 기술은 평균 ± 표준편차로 하였다. 통계적 유의성은 윌콘슨 부 호순위검증(Wilcoxon signed-rank test)을 이용하여 알아보았 고, p < 0.05를 의미있는 통계값으로 정하였다.
결과
대조군의 각 MRA별 영상 평가는 Table 2와 같았다(Figs. 2, 3). 대조군의 경우에 평가점수 평균값은 모형치아교정장치 착 용 전 3D TOF 기법을 사용한 경우 2.84 ± 0.1, 3D PC 기법 을 사용한 경우 2.88 ± 0.1이었고, 착용 후에는 3D TOF 기법 씩 중복하였고, 영상 내 정맥혈류에 의한 신호를 제거하기 위하
여 3D 편판 상부에 사전포화(spatial saturation band)를 사용하 였다. 3D PC MRA는 윌리스 동맥륜을 이루는 혈관전체의 혈 류속도를 고려하여 혈류속도부호화(velocity-encoding, VENC) 값을 초당 45 cm/sec로 설정하였다(19, 20).
MRA 분석
MRA 영상의 평가를 위하여 윌리스 동맥륜을 다음과 같이 14 개의 분절로 나누었다; 1-양측 안동맥(ophthalmic artery), 2-양 측 내경동맥의 해면체부(cavernous segment of internal carotid artery), 3-양측 내경동맥의 추체부(petrous segment of internal carotid artery), 4-양측 전대뇌동맥의 A1 분절(A1 segment of anterior cerebral artery), 5-양측 전대뇌동맥의 A2 분절 이후 (A2 segment of anterior cerebral artery), 6-전교통 동맥(ante- rior communicating artery), 7-양측 중대뇌동맥의 M1 분지(M1 segment of middle cerebral artery), 8-양측 중대뇌동맥의 M2 분지(M2 segment of middle cerebral artery), 9-양측 중대뇌동 맥의 M3 분지(M3 segment of middle cerebral artery), 10-양측 후대뇌동맥의 P1 분절(P1 segment of posterior cerebral ar- tery), 11-양측 후대뇌동맥의 P2 분절(P2 segment of posterior cerebral artery), 12-양측 후교통 동맥(posterior communicating artery), 13-뇌기저동맥(basilar artery), 14-양측 척추동맥의 경막 내 분절(intradural segment of vertebral artery).
MRA 영상 질 평가는 혈관분절의 묘사정도를 0: 진단불가 (non diagnostic, not visible), 1: 부족함(poor, insufficient vi- sualization), 2: 적합함(adequate, depiction of the vessels was still sufficient), 3: 좋음(good, vessels was clearly depicted)의 4점 척도(4 point scale)로 분류하였다. 대조군과 환자군에서 Table 1. Scanning Parameters for the 3D TOF and 3D PC
Parameter Pulse Sequence
TR (ms) TE (ms) BW (KHz)
Slice Thickness
(mm)
Slap/
Overlap (mm)
Matrix
Size NEX FOV
(cm) FA Frequency Direction
ASSET Factor
Zero-fill Interpolation Recon. Matrix/Slice
Thickness (mm)
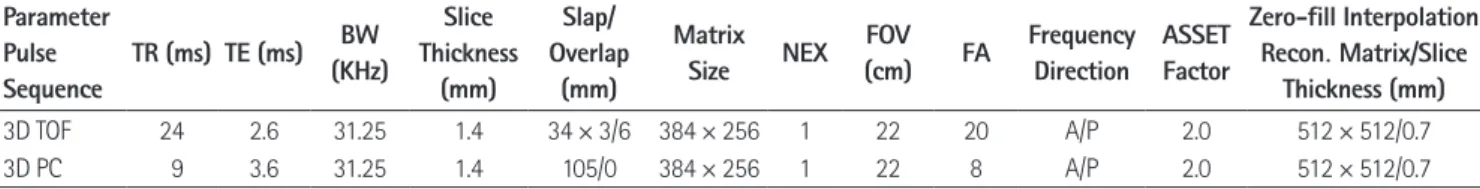
3D TOF 24 2.6 31.25 1.4 34 × 3/6 384 × 256 1 22 20 A/P 2.0 512 × 512/0.7
3D PC 9 3.6 31.25 1.4 105/0 384 × 256 1 22 8 A/P 2.0 512 × 512/0.7
Note.-ASSET = array spatial sensitivity encoding technique, BW = bandwidth, FA = flip angle, FOV = field of view, NEX = number of excitation, TE = echo time, TR = repetition time, 3D PC = 3 dimensional phase contrast, 3D TOF = 3 dimensional time of flight
Table 2. The Results of 3D TOF MRA and Inhance 3D Velocity MRA Interpretations Based on Four Point (0-3) Scoring for Vessels Visibility in Controls (group A)
Pulse Seq. Device Mean Scoring (n = 20)
Significant Probability
3D TOF 3D PC
Before wearing 2.84 ± 0.1 2.88 ± 0.1 p = 0.0767
After wearing 1.8 ± 0.4 2.83 ± 0.1 p = 0.0001
Note.-MRA = magnetic resonance angiography, PC = phase contrast, Seq = sequence, 3D TOF = 3 dimensional time of flight
실제 치아교정장치를 착용하고 있는 환자군(group B)에서의 MRA 영상 평가 결과는 Table 4와 같았다. 3D TOF 기법과 3D PC 기법에서 각각 1.86 ± 0.43과 2.81 ± 0.15의 결과를 보였 으며 3D PC 기법을 이용한 평가가 우수하였다(p = 0.005). 평 가점수의 환산비율은 3D TOF 기법과 3D PC 기법이 각각 47.6~78.6% (평균 67.7%), 83.3~100% (평균 93.6%)였다 (Fig. 5).
고찰
최근에 여러 목적으로 치아교정장치(orthodontic device)를 부착한 환자가 늘고 있으며 따라서, MRA 의뢰 역시 증가하고 있다. 이런 환자에게 있어 금속물질로 인한 자장의 왜곡이 원인 이 되는 인공음영이 발생하여 진단에 어려움을 주고 있다(14, 22). 치아교정장치를 부착한 환자에서 반드시 MRA 검사가 필 요한 경우에는 교정장치를 제거하여야 하는 경우도 있어 환자 에게 많은 불편함을 초래하고 있다. 저자들은 본 연구에서 이런 환자에게 유용하게 사용될 수 있는 3D PC (Inhance 3D ve- 은 1.8 ± 0.4, 3D PC 기법에서는 2.83 ± 0.1로 측정되어
3D PC 기법이 우수한 기법임을 알 수 있었다(p < 0.05). 또한 윌콘슨 부호순위검증을 이용한 통계적 유의성 검증에서는 모형 치아교정장치의 착용 전에는 두 기법 모두 평가결과에서 통계 적 의미를 보이지 않았으나(p = 0.0767), 착용 후에는 통계적 으로 의미 있는 차이를(p = 0.0001) 보였다. 평가점수의 환산비 율을 보면 모형치아교정장치 착용 전 3D TOF 기법을 사용한 경우는 88.1~100% (평균 94.8%), 3D PC 기법은 88.1~100%
(평균 95.8%)였고, 착용 후에는 3D TOF 기법의 경우 28.6~
81% (평균 60%), 3D PC 기법은 88.1~100% (평균 94.4%) 였다(Fig. 4). 대조군에서 얻은 MIP 영상의 CNR의 측정결과는 Table 3과 같다. 3D TOF 기법을 사용했을 때 모형치아교정장 치 착용 전과 후의 결과는 각각 324.8 ± 25.4, 466.3 ± 41.7 이었고, 3D PC 기법에서는 착용 전과 후의 결과가 각각 142.9
± 6.6, 140.8 ± 7.2였다. 3D TOF 기법에서 모형치아교정장 치 착용 후에 의미 있는 CNR의 차이를 보였다(p = 0.0001).
반면, 3D PC 기법에서는 혈관 외 배경신호의 억제에 별다른 변 화가 없음을 알 수 있었다(p = 0.7507).
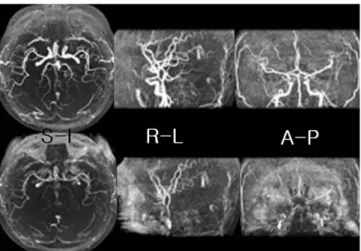
Fig. 2. Three dimensional time of flight magnetic resonance angiog- raphys in control (group A) before (top images) and after wearing the orthodontic device (bottom images). Maximal intensity projection im- ages of various directions without wearing the device show well delin- eation of distal cerebral arteries. However, after wearing the device, there are multiple arteries with signal loss and poor margination.
Note.-S-I = superior-inferior direction, R-L = right-left direction, A-P
= anterior-posterior direction
Fig. 3. Three dimensional phase contrast magnetic resonance angiog- raphys in control (group A) before (top images) and after wearing the orthodontic device (bottom images). All maximal intensity projection images show well marginated cerebral arteries regardless of wearing the device. Venous flows are detected in both transverse and sigmoid sinuses.
Note.-S-I = superior-inferior direction, R-L = right-left direction, A-P = anterior-posterior direction
Table 3. The Results of Measured CNR and Statistical Analysis from MIP Images in Controls (Group A)
Pulse Sequence 3D TOF 3D PC
Device Before Wearing After Wearing Before Wearing After Wearing
Mean (n = 20) ± 324.8 466.3 142.9 140.8
SD 25.4 41.7 6.6 7.2
Significant probability p = 0.0001 p = 0.7507
Note.-CNR = contrast to noise ratio, MIP = maximal intensity projection, PC = phase contrast, TOF = time of flight, 3D = 3 dimensional
이 3D PC MRA를 그 기반으로 하고 있다. 3D PC MRA는 속 도부호화(VENC)값 설정에 따른 감산된 신호를 바탕으로 영상 화하기 때문에 자장의 불균일 상태에서도 우수한 배경신호억제 영상을 얻을 수 있고 혈류의 특징을 정량적으로 분석할 수 있는 등의 장점이 있다. 다만, 3D TOF MRA에 비해 검사시간이 매 우 길다는 단점으로 그 동안 임상에서 사용하는 데 제한이 있었 다(8, 30). 최근에는 3D PC MRA의 고유한 장점을 유지하면 서 단점이었던 검사시간을 평행영상기법과 타원형 K-공간 충만 (elliptical K-space filling)기법 등을 병행하여 임상적용에 충분 한 수준으로 감소시킨 방법이 소개되었다(31). 본 연구결과에서 보듯 혈관영상의 평가와 배경신호의 억제 등에서 3D TOF보다 우수한 결과를 보여주었고 동시에 검사시간도 20%가량 감소 되었다. 3D TOF와 검사시간을 동일하게 하는 조건이라면 감소 된 검사시간만큼 공간분해능의 향상을 유도할 수 있는 영상매 개변수(imaging parameter)의 조절시간이 충분해진다. 3D PC 기법은 3D TOF 기법에 비해 혈관의 묘사 정도에서 전체적으로 높은 평가를 받았다. 정상 대조군에서 시행한 모형치아교정장 치에 착용 전, 후에 혈관을 분석하는 데 별다른 차이가 없었으 며, 이는 불균일한 자장에서도 충분한 진단가치가 있는 영상을 구현해낼 수 있음을 반증한다고 하겠다. 저자들의 연구결과에 서도 치아교정장치를 착용한 환자군의 경우에 치아교정장치의 부착 형태 및 재질에 따라 평가결과에서 조금의 차이는 있었지 locity in GE) 기법을 소개하였다.
뇌혈관 질환의 진단에는 고식적 혈관조영술(conventional angiography)이나 전산화단층 혈관조영술(computed tomo- graphic angiography; 이하 CTA), MRA를 이용하고 있으며, 그 중 고식적 뇌혈관조영술은 정확한 검사로 알려져 있지만 시술 에 따른 위험성을 내포하고 있는 침습적 검사방법으로서 진단 목적의 첫 영상법으로 사용하는 데는 제한점이 있다(23, 24).
따라서, 비침습적 방법으로 알려진 CTA나 MRA가 임상에 주로 이용되고 있으며, 특히 MRA는 뛰어난 공간 해상력으로 뇌혈관 의 병변을 쉽고 정확하게 찾을 뿐 아니라 조영제의 주입 없이 혈 관조영상을 얻을 수 있는 장점이 있다. 또한, 다양한 영상 기법 들이 개발되어 우수한 혈관조영에 대한 결과들이 보고되었다 (2, 25, 26). 대표적인 MRA 기법 중의 하나인 TOF 기법은 뇌 혈관조영술로 가장 흔하게 사용하고 있으며 특히 높은 신호대 잡음비(SNR) 및 공간분해능의 영상을 획득할 수 있는 3D TOF 기법이 많이 사용된다(27, 28). 하지만, 이 방법은 혈류의 포화효과로 인한 신호강도의 감소가 발생하거나 지방이나 출 혈, 단백질 성분의 조직 등과 근접한 혈관의 묘사에는 제한점이 있고, 자장의 균일 정도에 민감하여 금속 이식물이나 주변 다른 조직과의 경계면에서 자기감수성의 차이로 인해 인공음영이 발 생하는 단점이 있다(29). 다른 MRA 기법으로 위상대조(PC)를 이용한 방법이 있는데 본 연구에 사용된 Inhance 3D 속도 기법
Table 4. The Results of MRA Interpretation Based on Four Point (0-3) Scoring for Vessels Visibility in Patients (Group B)
Pulse Sequence 3D TOF 3D PC Significant Probability
Mean (n = 10) ± 1.86 2.81
p = 0.005
SD 0.43 0.15
Note.-MRA = magnetic resonance angiography, PC = phase contrast, TOF = time of flight, 3D = 3 dimensional
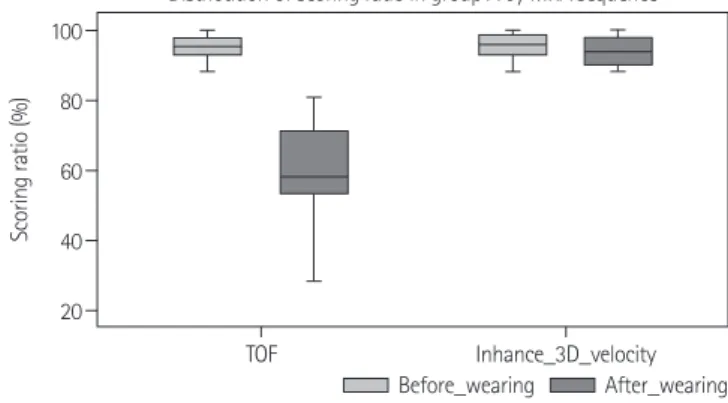
Fig. 4. Distribution of scoring ratio in controls (group A). Scoring ra- tios (percentage) measured from 3D TOF method show significant dif- ference between group before wearing device and group after wear- ing device. In 3D PC method, there are no differences of scoring ratios in two groups. ‘Inhance 3D velocity’ is MRA means 3D PC technique.
Note.-MRA = magnetic resonance angiography, PC = phase contrast, TOF = time of flight, 3D = 3 dimensional
Fig. 5. Distribution of scoring ratio in patients (group B). In patients wearing actual orthodontic devices, Difference of scoring ratios be- tween group with 3D TOF method (average 68%) and group with 3D PC method (average 94%) is significant. ‘Inhance 3D velocity’ means MRA using 3D PC technique.
Note.-MRA = magnetic resonance angiography, PC = phase contrast, TOF = time of flight, 3D = 3 dimensional
20 40 60 80 100
TOF
Distribution of scoring ratio in group A by MRA sequence
Inhance_3D_velocity
Scoring ratio (%)
40 60 80 100
TOF
Distribution of scoring ratio in group B by MRA sequence
Scoring ratio (%)
Before_wearing After_wearing TOF Inhance_3D_velocity
결론적으로 저자들이 이용한 3D PC MRA 기법은 3D TOF MRA 기법과 비교하여 치아교정장치에 의한 자기감수성변화 가 있는 경우에도 짧은 시간 안에 진단가치가 높은 우수한 영 상을 획득할 수 있음을 알았다. 따라서, 자기감수성변화에 의 해 영상왜곡이 발생하는 경우에 3D TOF MRA 기법을 대신하 여 비 침습적 두개 내 MRA 검사법으로 사용할 수 있을 것으로 기대한다.
참고문헌
1. Acheson J, Boyd WN, Hugh AE, Hutchinson EC. Cerebral angiography in ischemic cerebrovascular disease. Arch Neurol 1969;20:527-532
2. White PM, Wardlaw JM, Easton V. Can noninvasive imag- ing accurately depict intracranial aneurysms? A systematic review. Radiology 2000;217:361-370
3. Yang JJ, Hill MD, Morrish WF, Hudon ME, Barber PA, Dem- chuk AM, et al. Comparison of pre- and postcontrast 3D time-of-flight MR angiography for the evaluation of dis- tal intracranial branch occlusions in acute ischemic stroke.
AJNR Am J Neuroradiol 2002;23:557-567
4. Remonda L, Senn P, Barth A, Arnold M, Lövblad KO, Schroth G. Contrast-enhanced 3D MR angiography of the carotid artery: comparison with conventional digital sub- traction angiography. AJNR Am J Neuroradiol 2002;23:
213-219
5. Campeau NG, Huston J 3rd, Bernstein MA, Lin C, Gibbs GF.
Magnetic resonance angiography at 3.0 Tesla: initial clini- cal experience. Top Magn Reson Imaging 2001;12:183-204 6. Al-Kwifi O, Emery DJ, Wilman AH. Vessel contrast at three 만 전체적으로는 3D TOF 기법보다 높은 평가결과를 보였다.
또한 3D TOF 기법에서처럼 영상단면을 통과하는 혈관의 주행 방향에 따른 신호강도의 변화나 포화효과로 인한 인공음영(ve- netian blind artifact)도 발생하지 않았다. 하지만 혈류 특성에 맞는 정확한 속도부호화 값 설정에 대한 고려가 필요하였고, 3D TOF 기법처럼 사전포화에 의한 동맥과 정맥의 선택적 혈 관영상이 불가능하여 정맥혈류에 의한 신호도 영상화되는 단점 이 있었다. 앞서 언급된 3D PC 기법의 사용에 있어서 고려해야 할 속도부호화 값은 뇌혈관 전장을 고루 관찰할 수 있게 설정 하여야 한다. 따라서, 좀 더 긴 시간이 필요한 3D PC 영상을 얻 기 전에 짧은 시간 안에 2D PC 영상에서 다양한 속도부호화 (VENC) 값을 이용한 영상을 얻어 볼 수 있다. 저자들은 VENC 값 설정을 위하여 25 cm/sec, 35 cm/sec, 45 cm/sec의 서로 다른 값을 설정하여 영상을 얻어 보았다(Fig. 6). 25 cm/sec, 35 cm/sec의 값에서는 혈류속도가 빠른 동맥분절에 신호겹침 (aliasing) 인공음영이 발생하여 저신호강도를 보였다. 이런 소견 은 혈관 내경의 협착이나 혈전에 의한 혈류량 감소에 의한 소견 으로 오인할 수 있어 주의가 필요하다. 신호겹침 인공음영의 발 생시에는 VENC값을 좀 더 높게 설정해야하고, 혈관벽 음영이 불분명하면 VENC값을 낮춰볼 필요가 있다.
본 연구의 제한점은 첫째로 한가지 형태의 자체 제작한 치아 교정장치를 이용한 대조군 연구를 진행하여 실제 임상에서 사 용되고 있는 다양한 형태와 고정법을 가지고 있는 치아교정장 치들을 대변하는 데 한계가 있었다. 하지만, 다양한 교정장치를 착용한 환자군에서도 대조군과 유사한 결과를 얻을 수 있었다.
둘째로 환자군의 수가 10명으로 제한적이었다. 앞으로 좀 더 많 은 치아교정장치 착용 환자군에 대한 연구가 필요할 것으로 보 이며 또한 본 연구의 환자군에서는 뇌혈관 병변이 발견된 경우 가 없었으나 추후에는 치아교정장치를 착용한 뇌혈관 질환군에 대한 비교 연구도 필요할 것으로 생각한다.
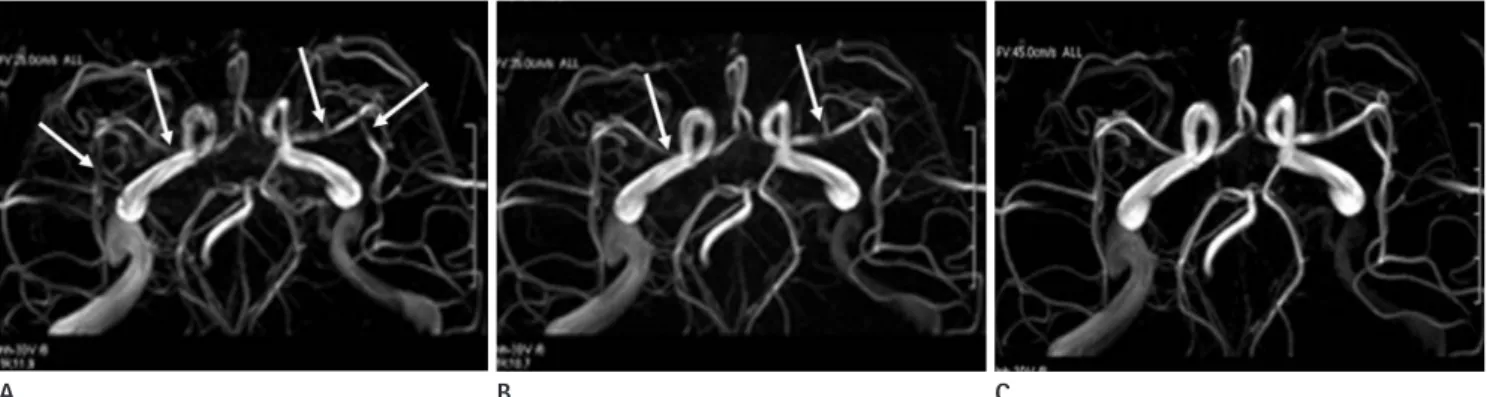
Fig. 6. Comparison of 3D PC MRAs by variable velocity encoding (VENC) values (25 cm/sec in A, 35 cm/sec in B, 45 cm/sec in C). MRAs scanned by 25 and 35 cm/sec VENC values show multifocal signal losses mimicking stenosis or slow flow in cerebral arteries (arrows). However, these phenomena disappear in C (45 cm/sec VENC value).
Note.-3D PC MRA = 3 dimensional phase contrast magnetic resonance angiography
A B C
Reson Imaging 2004;15:169-185
18. Hiai Y, Kakeda S, Sato T, Ohnari N, Moriya J, Kitajima M, et al. 3D TOF MRA of intracranial aneurysms at 1.5 T and 3 T:
influence of matrix, parallel imaging, and acquisition time on image quality - a vascular phantom study. Acad Radiol 2008;15:635-640
19. Marks MP, Pelc NJ, Ross MR, Enzmann DR. Determination of cerebral blood flow with a phase-contrast cine MR im- aging technique: evaluation of normal subjects and pa- tients with arteriovenous malformations. Radiology 1992;
182:467-476
20. Oelerich M, Lentschig MG, Zunker P, Reimer P, Rummeny EJ, Schuierer G. Intracranial vascular stenosis and occlu- sion: comparison of 3D time-of-flight and 3D phase-con- trast MR angiography. Neuroradiology 1998;40:567-573 21. Shonai T, Carpenter JS, Lemieux SK, Harada K, Omori K,
Kaneko N, et al. Improvement of vessel visibility in time- of-flight MR angiography of the brain. J Magn Reson Im- aging 2008;27:1362-1370
22. Grayev A, Shimakawa A, Cousins J, Turski P, Brittain J, Reeder S. Improved time-of-flight magnetic resonance angiography with IDEAL water-fat separation. J Magn Re- son Imaging 2009;29:1367-1374
23. Dion JE, Gates PC, Fox AJ, Barnett HJ, Blom RJ. Clinical events following neuroangiography: a prospective study.
Stroke 1987;18:997-1004
24. Grzyska U, Freitag J, Zeumer H. Selective cerebral intraar- terial DSA. Complication rate and control of risk factors.
Neuroradiology 1990;32:296-299
25. Randoux B, Marro B, Koskas F, Duyme M, Sahel M, Zouaoui A, et al. Carotid artery stenosis: prospective comparison of CT, three-dimensional gadolinium-enhanced MR, and conventional angiography. Radiology 2001;220:179-185 26. Hirai T, Korogi Y, Ono K, Nagano M, Maruoka K, Uemura S,
et al. Prospective evaluation of suspected stenoocclusive disease of the intracranial artery: combined MR angiogra- phy and CT angiography compared with digital subtrac- tion angiography. AJNR Am J Neuroradiol 2002;23:93-101 27. Bosmans H, Marchal G, Lukito G, Yicheng N, Wilms G,
Laub G, et al. Time-of-flight MR angiography of the brain:
comparison of acquisition techniques in healthy volun- teers. AJR Am J Roentgenol 1995;164:161-167
Tesla in time-of-flight magnetic resonance angiography of the intracranial and carotid arteries. Magn Reson Imag- ing 2002;20:181-187
7. Frayne R, Goodyear BG, Dickhoff P, Lauzon ML, Sevick RJ.
Magnetic resonance imaging at 3.0 Tesla: challenges and advantages in clinical neurological imaging. Invest Radiol 2003;38:385-402
8. Wilms G, Bosmans H, Demaerel P, Marchal G. Magnetic resonance angiography of the intracranial vessels. Eur J Radiol 2001;38:10-18
9. Walker MT, Tsai J, Parish T, Tzung B, Shaibani A, Krupinski E, et al. MR angiographic evaluation of platinum coil packs at 1.5T and 3T: an in vitro assessment of artifact produc- tion: technical note. AJNR Am J Neuroradiol 2005;26:848- 853
10. Willinek WA, Born M, Simon B, Tschampa HJ, Krautmacher C, Gieseke J, et al. Time-of-flight MR angiography: com- parison of 3.0-T imaging and 1.5-T imaging--initial expe- rience. Radiology 2003;229:913-920
11. Yu HS, Ryu YK, Lee JY. A study on the distributions and trends in malocclusion patients from department of or- thodontics, college of dentistry, Yonsei university. Korean J Orthod 1999;29:267-276
12. Lee YK, Cha JY, Yu HS, Hwang CJ. Effect of metal primer and thermocycling on shear bonding strength between the orthodontic bracket and gold alloy. Korean J Orthod 2009;39:320-329
13. Liu JK, Chang LT, Chuang SF, Shieh DB. Shear bond strengths of plastic brackets with a mechanical base. An- gle Orthod 2002;72:141-145
14. Gizewski ER, Ladd ME, Paul A, Wanke I, Göricke S, Forsting M. Water excitation: a possible pitfall in cerebral time-of- flight angiography. AJNR Am J Neuroradiol 2005;26:152- 155
15. Griswold MA, Jakob PM, Nittka M, Goldfarb JW, Haase A.
Partially parallel imaging with localized sensitivities (PILS).
Magn Reson Med 2000;44:602-609
16. Weiger M, Pruessmann KP, Leussler C, Röschmann P, Boesiger P. Specific coil design for SENSE: a six-element cardiac array. Magn Reson Med 2001;45:495-504
17. Wilson GJ, Hoogeveen RM, Willinek WA, Muthupillai R, Maki JH. Parallel imaging in MR angiography. Top Magn
30. Korosec FR, Mistretta CA. MR angiography: basic principles and theory. Magn Reson Imaging Clin N Am 1998;6:223- 256
31. Hollnagel DI, Summers PE, Poulikakos D, Kollias SS. Com- parative velocity investigations in cerebral arteries and aneurysms: 3D phase-contrast MR angiography, laser Doppler velocimetry and computational fluid dynamics.
NMR Biomed 2009;22:795-808 28. White PM, Teasdale EM, Wardlaw JM, Easton V. Intracrani-
al aneurysms: CT angiography and MR angiography for detection prospective blinded comparison in a large pa- tient cohort. Radiology 2001;219:739-749
29. Ozsarlak O, Van Goethem JW, Parizel PM. 3D time-of-flight MR angiography of the intracranial vessels: optimization of the technique with water excitation, parallel acquisition, eight-channel phased-array head coil and low-dose con- trast administration. Eur Radiol 2004;14:2067-2071
치과용 교정장치로 인한 인공물을 보인 두개 내 자기공명 혈관조영술의 3차원 위상대조 기법을 이용한 질 평가:
3차원 흐름시간 기법과의 비교
1강성진1
·
김영수1·
홍현숙1·
김동훈2목적: 두개 내 자기공명혈관조영술(이하 MRA)을 시행할 때 치아교정장치에 의한 영상왜곡의 정도와 3차원 위상대조(이 하 3D PC) MRA의 유용성을 평가하였다.
대상과 방법: 대상군은 자체 제작한 모형치아교정장치를 착용한 20명(A 집단)과 치료용 보조기를 착용한 10명(B 집단) 으로 나누었다. 3.0T MR 스캐너로 3차원 흐름시간(이하 3D TOF)과 3D PC MRA를 시행하였다. 평가는 윌리스 동맥륜 혈관분절의 묘사정도를 우수한 정도에 따라(0-3) 4점 척도로 2명의 영상전문의가 평가하였다. 또한, 자기 감수성 변화와 최대강도투영 영상에서 대조도-잡음비(이하 CNR)를 측정하였다.
결과: A 집단에서 3D TOF의 치아교정장치 착용 전과 후의 평가결과는 2.84 ± 0.1 대 1.8 ± 0.4, 3D PC는, 2.88 ± 0.1대 2.83 ± 0.1이었다. B 집단의 경우 3D TOF와 3D PC에서 각각1.86 ± 0.43, 2.81 ± 0.15로 큰 차이를 보였다(p
= 0.005). 자기감수성변화는, 치아교정장치 착용 후에 큰 차이를 보였다(p = 0.0001). 3D TOF와 3D PC에서 CNR은 치 아교정장치 착용 전과 후에 324.8 ± 25.4 대 466.3 ± 41.7 (p = 0.0001), 142.9 ± 6.6 대 140.8 ± 7.2로 나타났다(p
= 0.7507).
결론: 3D PC는 자기감수성변화에 의한 영상 왜곡시에 3D TOF를 대체할 수 있는 두개 내 MRA가 될 수 있다.
1순천향대학교 의과대학 부천병원 영상의학과학교실, 2조선대학교 의학전문대학원 영상의학과학교실