pISSN 1976-1457 eISSN 2005-6168
The framingham risk score, diet, and inflammatory markers in Korean men with metabolic syndrome
Cheongmin Sohn
1§, Juyong Kim
2and Wookyung Bae
21Major in Food and Nutrition, Wonkwang University, 344-2 Sinyong-Dong, Iksan, Jeonbuk 570-749, Korea
2Health Promotion Center, Seoul National University of Bundang Hospital, Seongnam 463-707, Korea
Abstract
The Framingham risk score (FRS) has been used to assess the risk of a cardiovascular event and to identify patients for risk factor modifications.
Therefore, the purpose of this study was to evaluate the relationship of the FRS with dietary intake and inflammatory biomarkers. We conducted a cross-sectional study of 180 men (49.2 ± 10.2 years) with MS. Serum levels of high sensitive C-reactive protein (hs-CRP), interleukin-6 (IL-6), and adiponectin were examined. Participants were asked to complete the food frequency questionnaire (FFQ) using the previous 1 year as a reference point. The absolute cardiovascular disease (CVD) risk percentage over 10 years was calculated to estimate the FRS, which was classified as low risk (< 10%), intermediate risk (10-20%), and high risk (> 20%). Mean intake of polyunsaturated fatty acids was lower in subjects who had > 20%
FRS than in subjects who had < 10% FRS (3.7 ± 1.9 g/day vs. 4.7 ± 1.9 g/day; P < 0.05). Significant differences in the Index of Nutritional Quality of protein, phosphorus, iron, vitamin A, vitamin B1, niacin, vitamin B6, and vitamin C were observed between the > 20% FRS group and the <
10% FRS group (P < 0.05). IL-6 concentrations were significantly lower in subjects with a < 10% FRS than in subjects who were 10-20% FRS or > 20% FRS (0.91 ± 0.26 vs. 1.48 ± 033 vs. 2.72 ± 0.57 pg/mL, respectively; P < 0.05). IL-6 and dietary intake of polyunsaturated fatty acids together explained 6.6% of the variation in FRS levels in a stepwise multiple regression model. Our results provide some evidence that dietary intake in the higher CVD risk group was inferior to that in the lower risk group and that dietary fat intake and IL-6 were associated with FRS and MS in Korean men.
Key Words: Framingham risk score, inflammation, polyunsaturated fatty acid, antioxidant, metabolic syndrome
Introduction
10)Metabolic syndrome (MS) is a group of conditions including abdominal obesity, dyslipidemia, hypertension, insulin resistance, and hyperglycemia, which increase the risk of CVD when they occur together [1-3]. According to a cohort study conducted in the US [4] and Europe [5], men with MS have 2-3 times greater probability for CVD than those without MS. The prevalence of MS among Korean men in 2005 was 32.9% by the Korean National Health and Nutrition Examination Survey, and this increasing prevalence is a growing health issue [6]. Unhealthy lifestyle characteristics such as an unbalanced diet and drinking and smoking habits are the main causes of MS in Korean men [7]. Health care professionals are conducting early identification and treatment of MS to prevent an epidemic increase in CVD.
The Framingham risk score (FRS) is a simplified coronary prediction tool developed to enable clinicians to assess the risk of a cardiovascular event and to identify candidate patients for risk factor modifications worldwide [8-11]. The FRS considers six coronary risk factors, including age, gender, total cholesterol (TC), high density lipoprotein (HDL)-cholesterol, systolic blood
pressure, and smoking habits [12], without considering dietary risk factors.
Many studies have shown an association between diet, lifestyle, and the incidence of CVD [13,14]. The National Cholesterol Education Program Adult Treatment Panel III recommended lifestyle modifications, such as diet and weight control, as CVD treatment [15]. Increasing evidence shows that diet modifications have favorable health effects and can prevent the development and progression of CVD. Furthermore, greater adherence to healthy dietary patterns, such as the traditional Mediterranean diet, has been associated with lower mortality rates and a lower incidence of CVD [16-18]. Dietary intake and MS patterns in Korean men have been analyzed in several cohort and case studies [19-21], but no studies have evaluated whether dietary factors are related to FRS or which nutrients are correlated with FRS in Koreans. Considering the prevalent use of FRS to predict CVD and to modify health-risk lifestyle modifications in clinical practice, dietary analyses according to FRS may be necessary to further address the modifiable dietary risk factors and to decrease the epidemic CVD burden.
Substantial evidence suggests that chronic inflammation is an
§Corresponding Author: Cheongmin Sohn, Tel. 82-63-850-6656, Fax. 82-63-850-7301, Email. [email protected] Received: November 3, 2011, Revised: May 24, 2012, Accepted: May 24, 2012
ⓒ2012 The Korean Nutrition Society and the Korean Society of Community Nutrition
This is an Open Access article distributed under the terms of the Creative Commons Attribution Non-Commercial License (http://creativecommons.org/licenses/by-nc/3.0/) which permits unrestricted non-commercial use, distribution, and reproduction in any medium, provided the original work is properly cited.
important factor in the initiation and progression of CVD. Acute inflammatory biomarkers, such as high sensitivity C-reactive protein (hs-CRP) and interleukin-6 (IL-6), are sensitive markers that predict the risk for developing CVD [22-24]. Similarly, an elevated level of plasma adiponectin, an antiatherogenic adipokine, is a predictor of decreased coronary heart disease risk [25].
Although inflammatory markers and the FRS predict vascular risk, the association between FRS with hs-CRP is inconsistent, with some reports indicating an association between circulating hs-CRP and FRS [11], whereas other studies have not found a significant association [26]. Some of these discrepancies may be explained by the different study populations. However, there are still an insufficient number of studies on the relationship between inflammatory markers and FRS.
Thus, we investigated the relationship between FRS and dietary factors in Korean men with MS espousing health risk factors for CVD. We also determined whether inflammatory biomarkers were correlated with predicting CHD risk as assessed by the FRS in Korean men with MS.
Subjects and Methods
Subjects
This cross-sectionally designed study was performed with subjects who underwent an annual health examination and voluntarily participated in a dietary modification program conducted at the Bundang Seoul National University Health Promotion Center [27] and Iksan Public Health Center. In total, 180 male subjects (age range, 20-65 yr) were recruited. Men were eligible if they met the MS criteria and exhibited more than three of the five factors reported in the joint interim statement from the International Diabetes Federation and the American Heart Association/National Heart, Lung, and Blood Institute [28]. There criteria were defined as triglyceride concentration ≥ 150 mg/dL, HDL-cholesterol concentration < 40 mg/dL, fasting glucose concentrations ≥ 100 mg/dL or taking antidiabetic drugs, systolic blood pressure ≥ 130 mmHg or diastolic blood pressure ≥ 85 mmHg or taking anti-hypertensive drugs, and waist circum- ference ≥ 90 cm. Exclusion criteria were individuals with CVD, cerebrovascular disease, diabetes complications, or systemic disorders such as severe hepatic, renal, or hematologic diseases.
Written informed consent was obtained from all participants, and this study was conducted in accordance with the guidelines of the institutional review board at each clinical center.
Data collection and laboratory analyses
Anthropometic measurements, a food frequency questionnaire (FFQ), and blood samples were collected. A self-administered questionnaire was used to obtain a history of smoking, alcohol drinking, and exercise. Participants were asked to complete the
semiquantitative FFQ using the prior 1 year as a reference time point for the nutrient intake analysis [29]. The participants described portion size and consumption frequency of 103 foods items by choosing one of nine options (almost null, 1 time/month, 2-3 times/month, 1-2 times/week, 3-4 times/week, 5-6 times/
week, 1 time/day, 2 times/day, or 3 times/day). The FFQ was used to assess average intake, which was converted to nutrient intake using a computerized nutrient analysis program. The Index of Nutritional Quality (INQ) was calculated to assess the adequacy of dietary intake [30]:
INQ = Nutrient intake /1,000 kcal
Dietary recommendation of nutrient/1,000 kcal Participants were first asked whether they had ever smoked or consumed alcoholic beverages. Past smokers and alcohol drinkers were asked about their age when they quit smoking or drinking. Information on physical activity was elicited, and the frequency and types of exercise were collected. Trained technicians obtained height and weight using an automatic recorder (DS-102, Jenix Co, Seoul, Korea) while participants wore light clothing without shoes. Body mass index (BMI) was calculated as weight divided by height squared. A fiber glass tape measure was used to measure waist circumferences at the point midway between the last rib and the iliac crest. Blood pressure measurements were taken using an automatic blood pressure monitor (Sysmex Co, Kobe, Japan) after > 5 min of rest. All blood samples were obtained from participants in the morning after a 12 hr overnight fast. Blood samples were centrifuged at 3,000 rpm for 15 minutes within 1 hr of collection and stored at -80℃ until analysis. Total and HDL-cholesterol, triglycerides, glucose, uric acid, λ-glutamyl transferase (λ-GT), and glycated hemoglobin were measured with an automated chemistry analyzer (BS-220, Mindray, Shezhen, China). Low density lipoprotein (LDL)-cholesterol concentrations were calculated using the Friedewald equation. Serum hs-CRP was measured by a latex agglutination immunoassay and an automatic analyzer (7600-110, Hitachi, Tokyo, Japan). Serum IL-6 was measured using a commercially available enzyme-linked immunosorbent assay (ELISA) kit (Bender Medisystems, Vienna, Austria).
Adiponectin was estimated using an enzyme immunoassay with an ELISA kit (Adipogen Inc, Seoul, Korea).
Assessment of cardiovascular risk
The FRS was calculated by adding the scores based on six coronary risk factors, including age, gender, TC, HDL- cholesterol, systolic blood pressure, and smoking habit. The following cutoffs were used to calculate the FRS: for TC: < 160, 160-199, 200-239, 240-279, and ≥ 280 mg/dL; for systolic blood pressure: < 120, 120-129, 130-139, 140-159, and ≥ 160 mmHg;
and for HDL-C: < 40, 40-49, 50-59 and ≥ 60 mg/dL. Ten year risk in percentage was calculated by total points (1 point, 6%;
2 points, 8%; 3 points, 10%; 4 points, 12%; 5 points, 16%; 6
Characteristic Total1) FRS
P-value
< 10% (n = 100) 10-20% (n = 58) > 20% (n = 22)
FRS (%) 9.13 ± 6.69 4.5 ± 2.5 11.7 ± 1.9 23.2 ± 3.6 0.000
Age (yrs) 49.2 ± 10.2 44.9 ± 8.2a 53.0 ± 9.0b 59.5 ± 11.2c 0.000
BMI (kg/m2) 26.7 ± 2.8 27.1 ± 3.1 26.2 ± 2.4 26.1 ± 2.5 0.123
Waist circumference (cm) 93.2 ± 6.8 93.6 ± 7.3 92.4 ± 5.9 93.7 ± 6.6 0.562
Systolic BP (mmHg) 127.3 ± 14.0 126.3 ± 13.9a 124.5 ± 11.8a 139 2 ± 13.8b 0.000
Triglyceride (mg/dL) 173.6 ± 75.1 157.9 ± 56.1a 183.4 ± 94.6a,b 220.9 ± 75.1b 0.002
HDL-cholesterol (mg/dL) 42.7 ± 8.3 42.8 ± 8.1 43.3 ± 9.5 41.2 ± 5.6 0.645
LDL-cholesterol (mg/dL) 109.9 ± 29.5 103.0 ± 27.2a 114.5 ± 28.1a,b 129.4 ± 33.4b 0.001
Total Cholesterol (mg/dL) 196.0 ± 36.1 185.2 ± 33.6a 204.8 ± 32.3b 223.7 ± 37.3c 0.000
rGT (mg/dL) 55.2 ± 30.8 56.0 ± 34.1 53.4 ± 27.8 56.3 ± 19.5 0.888
HbA1c (%) 6.02 ± 0.85 5.94 ± 0.79 6.05 ± 0.86 6.37 ± 1.08 0.169
Uric Acid (mg/dL) 6.82 ± 1.22 6.85 ± 1.23 6.71 ± 1.22 7.01 ± 1.23 0.675
hs-CRP (μg/mL) 1.75 ± 2.52 1.85 ± 2.80 1.56 ± 1.97 1.81 ± 2.55 0.805
IL-6 (pg/mL) 1.32 ± 2.33 1.19 ± 2.21 1.26 ± 2.30 2.07 ± 2.91 0.324
Adiponectin (μg/mL) 8.05 ± 2.56 7.84 ± 2.55 8.36 ± 2.60 8.22 ± 2.58 0.351
Demographic characteristics2)
Exercise (%) Yes 49.0 45.3 14.3 0.051
No 51.1 54.7 85.7
Alcohol consumption (%) Never 9.1 9.1 26.7 0.695
Former 10.1 5.5 0.0
Current 80.8 85.5 73.3
Smoking status (%) Non smokers 20.2 10.9 0.0 < 0.001
Former smokers 57.6 43.6 13.3
Smokers 22.2 45.5 86.7
1)Values are mean ± standard deviation.
2)Differences in exercise, smoking, and drinking status were compared by the chi-squaretest.
a,b,cValues in a row with different superscript letters are significantly different among FRS groups at P= 0.05 by Tukey’s test.
BMI, body mass index; Systolic BP, systolic blood pressure; HDL-cholesterol, high density lipoprotein-cholesterol; LDL-cholesterol, low density lipoprotein-cholesterol; rGT, gamma-glutamyl transferase; HbA1c, glycated hemoglobin; hs-CRP, high-sensitivity C-reactive protein; IL-6, interleukin-6
Table 1. Demographic, anthropometric, and biochemical characteristics of the subjects divided into groups by Framingham risk score (FRS) severity
points, 20%; 7 points, 25%; 10 points or more, > 30%). Absolute CVD risk percentage over 10 years was classified as low risk (< 10%), intermediate risk (10-20%), and high risk (> 20%) [12].
Statistical analysis
An analysis of variance was used to test for differences in anthropometric, biochemical, daily dietary intake, and INQ across the three groups, and post-hoc analyses were performed with Tukey’s test. Categorical variables were compared with the x
2test. Analysis of covariance (ANCOVA) was used to examine the relationship between FRS and inflammatory markers, considering the important covariates. Covariates included as potential confounders were age, BMI, and waist circumference.
The first model compared only inflammatory markers with BMI across the three groups. The next model included age, and the succeeding model added waist circumference. Significant differences identified by ANCOVA were assessed by Bonferroni post-hoc test. hs-CRP and IL-6 were log transformed before analysis due to skewness in their distributions. A hierarchical multiple linear regression model with FRS as the dependent variable was used to predict whether the FRS was related to
inflammatory markers and dietary intake. All independent variables with a correlation coefficient with FRS of up to 0.1 were entered into the model. Dietary intake such as fiber, iron, niacin, vitamin C, folate, vitamin E, and polyunsaturated fatty acids (PUFAs) were entered into model 1, and then log IL-6 and log adiponectin values were factored into model 2. All statistical analyses were performed using SPSS software version 12.0 (SPSS Inc, Chicago, IL, USA). A P < 0.05 was considered significantly different.
Results
The demographic, anthropometric, and biochemical characteristics of the participants by FRS are shown in Table 1. Fifty-six percent of the subjects (n = 100) were in the low risk (< 10%), 32% (n
= 58) were in the intermediate risk (10-20%), and 12% (n = 22)
were in the high risk (> 20%) categories. Participants with lower
risk had significantly lower systolic blood pressure, and
triglyceride, LDL-cholesterol, and total cholesterol levels than
those in participants with a higher FRS. No significant differences
were observed in serum λ-GT, uric acid, hs-CRP, IL-6, or
Total FRS
P-value
< 10% (n = 100) 10-20% (n = 58) > 20% (n = 22)
Total energy intake (kcal)1) 1,805 ± 516 1,971 ± 676 1,777 ± 509 1,801 ± 589 0.136
Protein (g) 66.4 ± 26.3 69.3 ± 26.2 63.4 ± 19.9a 61.1 ± 39.0 0.287
Calcium (mg) 457.3 ± 282.8 484.3 ± 314.0 416.9 ± 205.3 437.4 ± 303.9 0.385
Phosphorus (mg) 938.1 ± 376.3 970.0 ± 394.6 891.4 ± 275.3 878.8 ± 500.0 0.336
Iron (mg) 10.8 ± 4.9 11.3 ± 5.2 10.3 ± 4.1 9.5 ± 5.5 0.248
Zinc (mg) 9.1 ± 3.9 9.2 ± 4.0 8.8 ± 2.9 9.4 ± 5.8 0.783
Vitamin A (μgRE) 515.0 ± 370.2 553.1 ± 407.7 490.3 ± 325.4 401.7 ± 268.4 0.230
Vitamin B1 (mg) 1.10 ± 0.46 1.17 ± 0.48 1.02 ± 0.32 0.95 ± 0.58 0.053
Vitamin B2 (mg) 1.01 ± 0.47 1.08 ± 0.50 0.93 ± 0.35 0.89 ± 0.58 0.094
Niacin (mg) 15.6 ± 6.01 16.2 ± 6.17 15.0 ± 5.00 13.6 ± 7.33 0.158
Vitamin B6 (mg) 1.66 ± 0.72 1.73 ± 0.75 1.60 ± 0.61 1.51 ± 0.86 0.390
Folic acid (μg) 226.9 ± 127.6 238.4 ± 134.8 222.5 ± 123.2 184.3 ± 95.8 0.235
Vitamin C (mg) 101.5 ± 70.9 109.9 ± 75.2 93.8 ± 68.2 82.4 ± 51.0 0.202
SFA (g) 8.8 ± 5.3 10.8 ± 7.8 8.4 ± 4.4 9.1 ± 8.6 0.132
MUFA (g) 8.7 ± 5.1 11.0 ± 7.8 8.4 ± 4.4 8.9 ± 9.3 0.114
PUFA (g) 4.4 ± 1.8 4.7 ± 1.9a 4.1 ± 1.5a,b 3.7 ± 1.9b 0.036
Cholesterol (mg) 220 ± 141 231 ± 143 195 ± 98 217 ± 153 0.241
Fiber (g) 17.2 ± 8.5 18.1 ± 9.1 16.7 ± 8.0 14.5 ± 6.0 0.222
Alcohol (g) 23.9 ± 25.1 22.2 ± 26.1 26.7 ± 22.9 24.7 ± 26.4 0.599
Carbohydrate (% of energy) 67.5 ± 7.7 66.8 ± 7.2 68.8 ± 6.2 68.3 ± 11.4 0.268
Protein (% of energy) 14.5 ± 2.6 15.2 ± 3.0 14.6 ± 2.3 14.1 ± 2.8 0.072
Fat (% of energy) 17.0 ± 6.0 17.7 ± 5.5 16.2 ± 5.1 16.1 ± 8.7 0.281
INQ2)
Protein 1.59 ± 0.31 1.66 ± 0.32a 1.51 ± 0.23a 1.48 ± 0.35b 0.002
Calcium 0.81 ± 0.38 0.87 ± 0.42 0.72 ± 0.31 0.80 ± 0.36 0.06
Phosphorus 1.70 ± 0.36 1.77 ± 0.38a 1.57 ± 0.26a 1.61 ± 0.38b 0.001
Iron 1.37 ± 0.45 1.46 ± 0.49a 1.28 ± 0.37a 1.20 ± 0.35b 0.006
Zinc 1.28 ± 0.46 1.30 ± 0.36 1.21 ± 0.26 1.38 ± 0.46 0.261
Vitamin A 0.85 ± 0.26 0.92 ± 0.26a 0.77 ± 0.21b 0.77 ± 0.28b < 0.001
Vitamin B1 1.41 ± 0.39 1.49 ± 0.41a 1.32 ± 0.31a 1.30 ± 0.34b 0.009
Vitamin B2 0.91 ± 0.54 0.98 ± 0.61 0.84 ± 0.45 0.74 ± 0.31 0.089
Niacin 1.25 ± 0.29 1.32 ± 0.30a 1.17 ± 0.22b 1.09 ± 0.28b < 0.001
Vitamin B6 1.17 ± 0.30 1.26 ± 0.31a 1.07 ± 0.24b 1.00 ± 0.24b < 0.001
Folic acid 0.73 ± 0.32 0.78 ± 0.34 0.70 ± 0.29 0.63 ± 0.23 0.063
Vitamin C 1.32 ± 0.82 1.45 ± 0.89a 1.18 ± 0.75a 1.04 ± 0.51b 0.024
1)Values are mean ± standard deviation.
2)Index of Nutritional Quality
Values in a row with different superscript letters are significantly different among FRS groups at P= 0.05 by Tukey’s test.
SFA, saturated fatty acids; MUFA, monounsaturated fatty acids; PUFA, polyunsaturated fatty acids Table 2. Dietary intake of the subjects divided into groups by Framingham risk score (FRS) severity
adiponectin among the groups. The proportion of smoking patients was significantly different between the groups stratified by the FRS levels; however, the proportion of patients that exercised and consumed alcohol was not significantly different between the groups.
Nutrients intake did not differ significantly between the groups (Table 2). According to the dietary quality assessment, all subjects showed a INQ value > 1.0 for protein, phosphorus, iron, zinc, vitamin B
1, vitamin B
6, niacin, and vitamin C. However, the INQ of calcium, vitamin A, vitamin B
2, and folate were < 1.0.
Significant differences were observed in the INQ for nutrients between the classified FRS risk groups (P < 0.05). Protein,
phosphorus, iron, vitamin A, vitamin B
1, niacin, vitamin B
6, and vitamin C were consumed at higher levels in the lower risk group than those in the highest risk groups (P < 0.05).
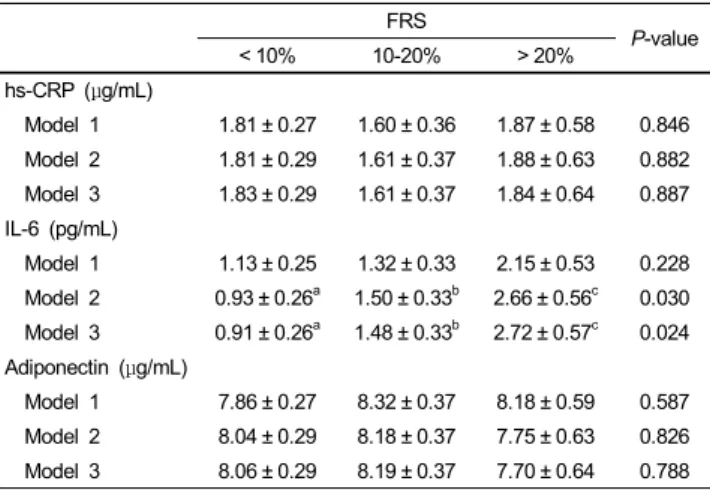
The means of various inflammatory markers across the three groups are shown in Table 3. Model 1 was adjusted for BMI, model 2 was further adjusted for age, and model 3 was further adjusted for waist circumference. No significant differences were seen in mean hs-CRP or adiponectin levels across the three groups, even after adjusting for covariates. However, IL-6 concentrations were significantly lower in subjects with a < 10%
FRS than in subjects who were 10-20% FRS or > 20% FRS (0.91
± 0.26 vs. 1.48 ± 033 vs. 2.72 ± 0.57 pg/mL, respectively; P <
FRS P-value
< 10% 10-20% > 20%
hs-CRP (μg/mL)
Model 1 1.81 ± 0.27 1.60 ± 0.36 1.87 ± 0.58 0.846 Model 2 1.81 ± 0.29 1.61 ± 0.37 1.88 ± 0.63 0.882 Model 3 1.83 ± 0.29 1.61 ± 0.37 1.84 ± 0.64 0.887 IL-6 (pg/mL)
Model 1 1.13 ± 0.25 1.32 ± 0.33 2.15 ± 0.53 0.228 Model 2 0.93 ± 0.26a 1.50 ± 0.33b 2.66 ± 0.56c 0.030 Model 3 0.91 ± 0.26a 1.48 ± 0.33b 2.72 ± 0.57c 0.024 Adiponectin (μg/mL)
Model 1 7.86 ± 0.27 8.32 ± 0.37 8.18 ± 0.59 0.587 Model 2 8.04 ± 0.29 8.18 ± 0.37 7.75 ± 0.63 0.826 Model 3 8.06 ± 0.29 8.19 ± 0.37 7.70 ± 0.64 0.788 Values are mean ± standard error
The models for the inflammatory factors were as follows: model 1, adjustment for body mass index (BMI); model 2, adjustment for age and BMI; model 3, adjustment for BMI, age and waist circumference.
Values in a row with different superscript letters are significantly different among FRS groups at P< 0.05 by Bonferroni correction for post-hoc multiple comparisons.
hs-CRP, high-sensitivity C-reactive protein; IL-6, interleukin-6
Table 3. Adjusted means of inflammatory markers according to Framingham risk score (FRS) severity
FRS
β Coefficient SE P R2
Model 1
PUFA -0.528 0.210 0.013 0.036
Model 2
Log IL-6 2.135 0.917 0.021 0.066
PUFA -0.584 0.209 0.006
Log IL-6, log interleukin-6; PUFA, polyunsaturated fatty acids
Table 4. Associations between Framingham risk score (FRS) and inflammatory markers and dietary intake
0.05) after adjusting for age, BMI, and waist circumference.
The effects of factors associated with the FRS in patients with MS are shown in Table 4. The relative contribution of each variable related to the FRS was evaluated in a stepwise multiple linear regression analysis. In model 1, which included dietary factors, PUFA explained 3.6% of the variance in FRS. After entering IL-6 (model 2), the total variance explained by the model changed to 6.6%. In this model, log transformed IL-6 was positively related to the FRS (β = 2.135, P = 0.021), whereas dietary PUFA intake was inversely correlated with the FRS (β
= -584, P = 0.006).
Discussion
Based on the prevalent worldwide health problem of CVD, researchers have been interested in elucidating CVD risk factors by assessing diet and inflammatory status in patients with MS.
We hypothesized that people at high risk for CVD have higher levels of inflammatory markers and pro-inflammatory dietary patterns. As a result, we found that dietary intake in the higher
CVD risk groups was poorer than that in the lower risk group, and FRS was independently associated with IL-6 levels after considering age and anthropometric measurements.
Several studies have shown that FRS differs by disease status.
According to the Korean National Health and Nutrition Examina- tion Survey, the mean CVD risk by the FRS in Korean men is only 5.11% in office workers and 7.03% in labor workers [31]. Approximately 87% of healthy men were in the low risk group (< 10%) in a study by Kim et al. [32]; however, the mean FRS was 15.3% in patients with diabetes (age, 57.4 ± 16.0 yr) [33]. In our study, the mean FRS was 9.13% and 12% of subjects belonged to the high risk (> 20%) group and 56% of them belonged to the low risk group (< 10%). Therefore, our results show that a higher mean FRS and ratio in the high risk criteria (> 20%) were seen in patients with MS than those in healthy subjects. MS is associated with accelerated atherosclerosis and CVD. Several studies have reported that the main pathogenic mechanism of MS is related to low level inflammation and oxidative stress [34-36]. Excessive abdominal fat accumulation may cause free radical production, innate oxidative damage, and chronic low-level inflammation in patients with MS. hs-CRP is a sensitive acute-phase protein that directly induces atherogenesis by disturbing endothelial function. In epidemiological studies, elevated levels of hs-CRP are associated with an increased risk for CVD [37]. In addition, CRP levels are significantly correlated with FRS in the Caucasian population, and have been used as an adjunctive indicator for global risk prediction of CVD [11].
In this study, we did not reveal a relationship between FRS and hs-CRP. Consistent with our observations, a study conducted by Alissa et al. [26] was unable to show a positive association between FRS and hs-CRP in Saudi men. The FRS is frequently used as a noninvasive screening tool to measure CVD risk in clinical practice and public health research; however, the predictive ability of the FRS varies between populations, ethnic groups, and socio-economic status [38,39]. This could be an explanation for this discrepancy between hs-CRP levels and the FRS in our study.
IL-6 levels are a CVD risk factor [24], and IL-6 has prominent effects on arterial intima-media thickness and pulse wave velocity in Japanese men [40]. In a meta-analysis, IL-6 levels showed a strong association with an increased incidence of CVD [41].
We found that IL-6 levels were associated with the FRS after adjusting for obesity factors. Because visceral adipose tissue, which secretes several adipokines, may affect CVD risk, we adjusted for BMI and waist circumference to eliminate the effects of adiposity on the FRS. Our results suggest that serum IL-6 concentration might be more sensitive than that of hs-CRP for detecting CVD risk and recommend an evaluation of IL-6 as a potential adjunct for predicting CVD with the FRS in men with MS.
Adiponectin functions as an anti CVD protein by increasing fatty acid oxidation and improving insulin sensitivity [25,42];
however, we were unable to show an inverse association between
FRS and adiponectin in men with MS. This may have been because our subjects were selected men with MS, who were insulin resistant, which may have attenuated the relationship between adiponectin and FRS.
INQ is used to calculate dietary quality by eliminating the calorie effect. We found that most INQ values of nutrients were
> 1.0, except calcium, folate, vitamin A, and vitamin B
2. We also showed that dietary quality, assessed by INQ, was lower in the higher CVD risk groups than that in the lower risk groups.
There is an inverse association between calcium intake and CVD mortality [43], and calcium supplementation may prevent absorption of saturated fatty acids resulting in a reduction in TC and LDL-cholesterol levels [44]. A folate deficiency can be a risk factor for CVD by preventing metabolism of homocysteine to methionine, and further inducing oxidative stress and altered lipid metabolism [45]. Therefore, nutritional education should be actively attempted to provide a healthy dietary intake with focus on insufficient nutrients to CVD-susceptible men with MS before the onset of clinical symptoms.
Dietary patterns low in natural antioxidants, such as the lack of consumption of fruits and vegetables, in patients with MS may activate the innate inflammatory response, most likely due to excess production of proinflammatory cytokines, which induce vascular endothelial dysfunction and ultimately increase the incidence of CVD [46]. In a study by Palmieri et al., serum concentrations of vitamin C and α-tocopherol in patients with MS were lower than those in control subjects [36]. In this study, we found that the INQ of vitamin C was inversely associated with FRS. Vitamin C is a water-soluble antioxidant with possible preventive effects as it restores vitamin E to its antioxidizing state, thereby lowering the oxidized LDL cholesterol and malondialdehyde levels and elevating the levels of glutathione peroxidase and superoxide dismutase [47]. Vitamin C also appears to be important for preventing CVD, as it improves arterial elasticity through arterial vasodilatation [48]. Furthermore, cigarette smokers and alcoholics are at risk for low vitamin C status [49,50]. In our study, vitamin C was appropriately consumed at a mean concentration of 101 mg/day, as compared to the mean daily-recommended nutrient intake of 100 mg proposed by the Korean Dietary Reference Intakes [51]. However, considering that vitamin intake was less than the recommended nutrient intake (82.4 mg/day) and that 86.7% and 73.3% of subjects were current smokers and alcohol drinkers in the highest FRS group, respectively, there is a need to ascertain the provision of sufficient levels of vitamin C to minimize oxidative stress in patients at high-risk for CVD.
Considerable evidence shows that a diet enriched with n-3 fatty acids protects against atherosclerosis and that PUFAs are effective in lowering LDL-cholesterol [52]. Dietary fatty acids modulate lipoprotein concentrations as well as inflammatory and endothelial function [53]. Our findings confirmed previous observations by providing a negative correlation between PUFA intake and the FRS in patients with MS.
We acknowledge the following limitations in this study. This was a cross-sectional rather than a prospective study; thus, we were unable to identify a causal relationship between inflam- matory markers and FRS. Another limitation is that the subjects consisted of patients who visited a health promotion center, so selection was biased. However, the present study has a strength in that it is the first study to examine the FRS and dietary intakes for a better understanding of the associations between dietary differences and CVD risk.
In conclusion, our results suggest that categorizing CVD risk by the FRS is related to serum IL-6 concentrations and can be used to estimate dietary insufficiencies in Korean men with MS and a higher risk for CVD.
Acknowledgments
We are indebted to Misung Kim, Woori Na, and Yesong Lee for their help. We also greatly appreciate Sohye Kim of Bundang University Hospital who participated in this study.
References
1. Ford ES. Risks for all-cause mortality, cardiovascular disease, and diabetes associated with the metabolic syndrome: a summary of the evidence. Diabetes Care 2005;28:1769-78.
2. Garber AJ. The metabolic syndrome. Med Clin North Am 2004;
88:837-46.
3. Isomaa B, Almgren P, Tuomi T, Forsén B, Lahti K, Nissén M, Taskinen MR, Groop L. Cardiovascular morbidity and mortality associated with the metabolic syndrome. Diabetes Care 2001;
24:683-9.
4. Malik S, Wong ND, Franklin SS, Kamath TV, L'Italien GJ, Pio JR, Williams GR. Impact of the metabolic syndrome on mortality from coronary heart disease, cardiovascular disease, and all causes in United States adults. Circulation 2004;110:1245-50.
5. Lakka HM, Laaksonen DE, Lakka TA, Niskanen LK, Kumpusalo E, Tuomilehto J, Salonen JT. The metabolic syndrome and total and cardiovascular disease mortality in middle-aged men. JAMA 2002;288:2709-16.
6. Ministry of Health and Welfare. Korean National Health and Nutrition Examination Survey Report. Seoul: Ministry of Health and Welfare; 2005.
7. Oh SW. Obesity and metabolic syndrome in Korea. Diabetes Metab J 2011;35:561-6.
8. Leaverton PE, Sorlie PD, Kleinman JC, Dannenberg AL, Ingster- Moore L, Kannel WB, Cornoni-Huntley JC. Representativeness of the Framingham risk model for coronary heart disease mortality: a comparison with a national cohort study. J Chronic Dis 1987;40:775-84.
9. Wilson PW, D'Agostino RB, Levy D, Belanger AM, Silbershatz H, Kannel WB. Prediction of coronary heart disease using risk factor categories. Circulation 1998;97:1837-47.
10. Liew SM, Doust J, Glasziou P. Cardiovascular risk scores do not account for the effect of treatment: a review. Heart 2011;97:
689-97.
11. Albert MA, Glynn RJ, Ridker PM. Plasma concentration of C-reactive protein and the calculated Framingham Coronary Heart Disease Risk Score. Circulation 2003;108:161-5.
12. Ford ES, Giles WH, Mokdad AH. The distribution of 10-year risk for coronary heart disease among US adults: findings from the National Health and Nutrition Examination Survey III. J Am Coll Cardiol 2004;43:1791-6.
13. Keys A, Menotti A, Karvonen MJ, Aravanis C, Blackburn H, Buzina R, Djordjevic BS, Dontas AS, Fidanza F, Keys MH, Kromhout D, Nedeljkovic S, Punsar S, Seccareccia F, Toshima H. The diet and 15-year death rate in the seven countries study.
Am J Epidemiol 1986;124:903-15.
14. Kafatos A, Diacatou A, Voukiklaris G, Nikolakakis N, Vlachoni- kolis J, Kounali D, Mamalakis G, Dontas AS. Heart disease risk-factor status and dietary changes in the Cretan population over the past 30 y: the Seven Countries Study. Am J Clin Nutr 1997;65:1882-6.
15. National Cholesterol Education Program (NCEP) Expert Panel on Detection, Evaluation, and Treatment of High Blood Cholesterol in Adults (Adult Treatment Panel III). Third Report of the National Cholesterol Education Program (NCEP) Expert Panel on Detection, Evaluation, and Treatment of High Blood Cholesterol in Adults (Adult Treatment Panel III) final report. Circulation 2002;106:3143-421.
16. Knoops KT, de Groot LC, Kromhout D, Perrin AE, Moreiras- Varela O, Menotti A, van Staveren WA. Mediterranean diet, lifestyle factors, and 10-year mortality in elderly European men and women: the HALE project. JAMA 2004;292:1433-9.
17. Panagiotakos DB, Dimakopoulou K, Katsouyanni K, Bellander T, Grau M, Koenig W, Lanki T, Pistelli R, Schneider A, Peters A;
AIRGENE Study Group. Mediterranean diet and inflammatory response in myocardial infarction survivors. Int J Epidemiol 2009;38:856-66.
18. Esposito K, Marfella R, Ciotola M, Di Palo C, Giugliano F, Giugliano G, D'Armiento M, D'Andrea F, Giugliano D. Effect of a mediterranean-style diet on endothelial dysfunction and markers of vascular inflammation in the metabolic syndrome: a randomized trial. JAMA 2004;292:1440-6.
19. Min C, Noh H, Kang YS, Sim HJ, Baik HW, Song WO, Yoon J, Park YH, Joung H. Skipping breakfast is associated with diet quality and metabolic syndrome risk factors of adults. Nutr Res Pract 2011;5:455-63.
20. Kang M, Joung H, Lim JH, Lee YS, Song YJ. Secular trend in dietary patterns in a Korean adult population, using the 1998, 2001, and 2005 Korean National Health and Nutrition Examina- tion Survey. Korean J Nutr 2011;44:152-61.
21. Yoo HJ, Kim Y. A study on the characteristics of nutrient intake in metabolic syndrome subjects. Korean J Nutr 2008;41:510-7.
22. Ridker PM. High-sensitivity C-reactive protein: potential adjunct for global risk assessment in the primary prevention of cardiovas- cular disease. Circulation 2001;103:1813-8.
23. de Ferranti SD, Rifai N. C-reactive protein: a nontraditional serum marker of cardiovascular risk. Cardiovasc Pathol 2007;16:
14-21.
24. Herder C, Schöttker B, Rothenbacher D, Roden M, Kolb H, Müller H, Brenner H. Interleukin-6 in the prediction of primary cardiovascular events in diabetes patients: results from the ESTHER study. Atherosclerosis 2011;216:244-7.
25. Ai M, Otokozawa S, Asztalos BF, White CC, Cupples LA, Nakajima K, Lamon-Fava S, Wilson PW, Matsuzawa Y, Schaefer
EJ. Adiponectin: an independent risk factor for coronary heart disease in men in the Framingham offspring study. Atherosclerosis 2011;217:543-8.
26. Alissa EM, Bahjri SM, Al-Ama N, Ahmed WH, Ferns GA. High cardiovascular risk in young Saudi males: cardiovascular risk factors, diet and inflammatory markers. Clin Chim Acta 2006;
365:288-96.
27. Kim M, Kim J, Bae W, Kim S, Lee Y, Na W, Sohn C.
Relationship between nutrients intakes, dietary quality, and serum concentrations of inflammatory markers in metabolic syndrome patients. Korean J Community Nutr 2011;16:51-61.
28. Alberti KG, Eckel RH, Grundy SM, Zimmet PZ, Cleeman JI, Donato KA, Fruchart JC, James WP, Loria CM, Smith SC Jr;
International Diabetes Federation Task Force on Epidemiology and Prevention; Hational Heart, Lung, and Blood Institute;
American Heart Association; World Heart Federation; Interna- tional Atherosclerosis Society; International Association for the Study of Obesity. Harmonizing the metabolic syndrome: a joint interim statement of the International Diabetes Federation Task Force on Epidemiology and Prevention; National Heart, Lung, and Blood Institute; American Heart Association; World Heart Federation; International Atherosclerosis Society; and Interna- tional Association for the Study of Obesity. Circulation 2009;
120:1640-5.
29. Ahn Y, Lee JE, Cho NH, Shin C, Park C, Oh BS, Kimm K.
Validation and calibration of semi-quantitative food frequency questionnaire: with participants of the Korean Health and Genome Study. Korean J Community Nutr 2004;9:173-82.
30. Hansen RG, Wyse BW. Expression of nutrient allowances per 1,000 kilocalories. J Am Diet Assoc 1980;76:223-7.
31. Choi MC, Song YH, Rhee SY, Woo JT. Framingham risk scores by occupational group: based on the 3rd Korean National Health and Nutrition Examination Survey. Korean J Occup Environ Med 2009;21:63-75.
32. Kim KA, Kim JS, Kim MS. Predictors of coronary heart disease risk in healthy men and women. J Korean Acad Nurs 2007;37:
1039-48.
33. Lim DM, Park KY, Kim BJ, Lee KW, Lee MJ, Yom YS, Koh GP. Cardiovascular risk according to the components of metabolic syndrome in type 2 diabetes. Korean Clin Diabetes 2009;10:
196-203.
34. Wellen KE, Hotamisligil GS. Inflammation, stress, and diabetes.
J Clin Invest 2005;115:1111-9.
35. Furukawa S, Fujita T, Shimabukuro M, Iwaki M, Yamada Y, Nakajima Y, Nakayama O, Makishima M, Matsuda M, Shimo- mura I. Increased oxidative stress in obesity and its impact on metabolic syndrome. J Clin Invest 2004;114:1752-61.
36. Palmieri VO, Grattagliano I, Portincasa P, Palasciano G. Systemic oxidative alterations are associated with visceral adiposity and liver steatosis in patients with metabolic syndrome. J Nutr 2006;
136:3022-6.
37. Ford ES, Giles WH. Serum C-reactive protein and fibrinogen concentrations and self-reported angina pectoris and myocardial infarction: findings from National Health and Nutrition Examina- tion Survey III. J Clin Epidemiol 2000;53:95-102.
38. Brindle P, Beswick A, Fahey T, Ebrahim S. Accuracy and impact of risk assessment in the primary prevention of cardiovascular disease: a systematic review. Heart 2006;92:1752-9.
39. D'Agostino RB Sr, Grundy S, Sullivan LM, Wilson P; CHD Risk Prediction Group. Validation of the Framingham coronary heart
disease prediction scores: results of a multiple ethnic groups investigation. JAMA 2001;286:180-7.
40. Nishida M, Moriyama T, Ishii K, Takashima S, Yoshizaki K, Sugita Y, Yamauchi-Takihara K. Effects of IL-6, adiponectin, CRP and metabolic syndrome on subclinical atherosclerosis. Clin Chim Acta 2007;384:99-104.
41. Danesh J, Kaptoge S, Mann AG, Sarwar N, Wood A, Angleman SB, Wensley F, Higgins JP, Lennon L, Eiriksdottir G, Rumley A, Whincup PH, Lowe GD, Gudnason V. Long-term interleukin-6 levels and subsequent risk of coronary heart disease: two new prospective studies and a systematic review. PLoS Med 2008;
5:e78.
42. Matsuzawa Y, Funahashi T, Kihara S, Shimomura I. Adiponectin and metabolic syndrome. Arterioscler Thromb Vasc Biol 2004;
24:29-33.
43. Van der Vijver LP, van der Waal MA, Weterings KG, Dekker JM, Schouten EG, Kok FJ. Calcium intake and 28-year cardio- vascular and coronary heart disease mortality in Dutch civil servants. Int J Epidemiol 1992;21:36-9.
44. de Wit NJ, Bosch-Vermeulen H, Oosterink E, Müller M, van der Meer R. Supplementary dietary calcium stimulates faecal fat and bile acid excretion, but does not protect against obesity and insulin resistance in C57BL/6J mice. Br J Nutr 2011;105:
1005-11.
45. Huang RF, Hsu YC, Lin HL, Yang FL. Folate depletion and elevated plasma homocysteine promote oxidative stress in rat
livers. J Nutr 2001;131:33-8.
46. Giugliano D, Ceriello A, Esposito K. The effects of diet on inflammation: emphasis on the metabolic syndrome. J Am Coll Cardiol 2006;48:677-85.
47. Mãrtensson J, Meister A. Glutathione deficiency decreases tissue ascorbate levels in newborn rats: ascorbate spares glutathione and protects. Proc Natl Acad Sci U S A 1991;88:4656-60.
48. Moreau KL, Gavin KM, Plum AE, Seals DR. Ascorbic acid selectively improves large elastic artery compliance in postmeno- pausal women. Hypertension 2005;45:1107-12.
49. Schectman G, Byrd JC, Gruchow HW. The influence of smoking on vitamin C status in adults. Am J Public Health 1989;79:
158-62.
50. Lecomte E, Herbeth B, Pirollet P, Chancerelle Y, Arnaud J, Musse N, Paille F, Siest G, Artur Y. Effect of alcohol consump- tion on blood antioxidant nutrients and oxidative stress indicators.
Am J Clin Nutr 1994;60:255-61.
51. The Korean Nutrition Society. Dietary Reference Intakes for Koreans. Seoul: Hanaleum Publisher Co.; 2010.
52. Massaro M, Scoditti E, Carluccio MA, De Caterina R. Nutraceu- ticals and prevention of atherosclerosis: focus on omega-3 polyunsaturated fatty acids and Mediterranean diet polyphenols.
Cardiovasc Ther 2010;28:e13-9.
53. Laugerette F, Vors C, Peretti N, Michalski MC. Complex links between dietary lipids, endogenous endotoxins and metabolic inflammation. Biochimie 2011;93:39-45.