Perfusion CT in Colorectal Cancer: Comparison of Perfusion Parameters with Tumor Grade and Microvessel Density
9
0
0
전체 글
(2) Kim et al.. INTRODUCTION Colorectal adenocarcinoma (CRC) is the third most common cancer in the world, accounting for 8.9-9.4% of all cancers (1, 2). The worldwide prevalence of CRC is second only to that of breast cancer (2). The 5-year survival for poorly differentiated CRC (29%) is significantly less than well differentiated and moderately differentiated CRC (59%, p = 0.0002) (3). In addition, increased microvessel density (MVD) is correlated with poor outcome in CRC (4, 5). The histologic MVD technique is the current gold standard by which tumor angiogenesis is characterized (6). Several studies have shown a statistically significant correlation between MVD, invasion, and metastasis in various solid tumors such as breast, lung, uterine cervix, and prostate (6-12). Des Guetz et al. (13) reported that there is a statistically significant inverse relationship between angiogenesis, assessed by MVD or vascular endothelial growth factor expression, and survival in human invasive CRC. Dynamic contrast-enhanced CT is also regarded as an appropriate non-invasive technique for assessment of angiogenesis, where positive correlations between CT parameters and immunohistologic measures, such as MVD, have been reported in studies of lung and kidney cancers (14). Goh et al. (14) reported that among perfusion parameters, the tumor permeability surface-area product (PS) and blood volume (BV) correlate positively with MVD and may reflect the degree of microvascularity within CRCs. In contrast, Li et al. (15) reported that there is no significant correlation between MVD and perfusion parameters in CRC. Indeed, debate continues regarding the correlation between MVD and CRC perfusion parameters, demonstrating the need for further investigation in this area of research. Few studies have been conducted on the relationship between tumor grade and perfusion CT in CRC (1, 2). Thus, the purpose of the current study was to compare preoperative CT perfusion parameters with tumor grade of CRC and to evaluate the correlation between pre-operative CT perfusion parameters and MVD to evaluate angiogenesis in CRC.. MATERIALS AND METHODS Patients Prior to the beginning of this study, the Institutional Review Board approved of the experimental design and S90. 부록-13.indd 90. methods outlined here. Written informed consent was obtained from each patient or the patient’s family before the pre-operative CT scan, including administration of radiation dose, was performed. Patients were excluded from the study if the patient had renal disease that precluded performing a contrast-enhanced CT (serum creatinine level, > 1.9 mg/dL). Between August 2006 and November 2007, 47 consecutive patients with CRC who underwent preoperative CT scans were prospectively enrolled in the study. The following were exclusion criteria for the study: preoperative radiation therapy or chemotherapy (n = 5), descending or ascending colon cancers with severe motion artifact (n = 3), poor identification of the tumor due to size (< 1 cm in diameter) at planning CT for perfusion scan (n = 3), no surgical intervention (n = 7), inability to place an intravenous cannula (n = 1), and mucinous carcinoma (n = 1). Thus, 27 consecutive patients (17 women and 10 men; mean age 59.3 years; range 32-82 years) who underwent pre-operative CT scans were prospectively enrolled in the study. CT Technique Pre-operative perfusion CT scans were performed with a 64 channel volume CT (Lightspeed VCT; GE Healthcare Technologies, Milwaukee, WI, USA) on all patients. To prevent peristaltic movement, 20 mg of the spasmolytic agent, hyoscine butylbromide (Buscopan®; Boehringer Ingelheim, Ingelheim am Rhein, Germany), was administered intravenously prior to data acquisition. Colonic dilatation with CO2 gas by automatic colon insufflators (protoCO2l; EZEM, Bicester, UK) was performed on all patients. Limited scout images were initially obtained from all patients in the lying position on the scanner table to identify colorectal tumor location by a supervising, experienced gastrointestinal radiologist before dynamic perfusion CT was performed. The scanning coordinates were used to plan the subsequent dynamic perfusion CT examination, which was focused on the mid-portion of the tumor. The following parameters for limited scout images were used: slice thickness, 5 mm; interval, 5 mm; scan type, helical mode; rotation speed, 1 sec; 80 Kvp, 200 mA, scan field of view, 33 cm; and matrix, 512 x 512 mm. One hundred mL of iopramide (Ultravist®; Schering, Berlin, Germany) was injected intravenously at a rate of 5 mL/s via an automatic pump injector for dynamic perfusion CT scans. Dynamic perfusion CT scans were performed at the mid-portion of the tumor for 60 seconds, beginning Korean J Radiol 13(Suppl 1), Jan/Feb 2012. kjronline.org. 12. 4. 16. 오전 9:27.
(3) Perfusion CT in Colorectal Cancer. 5 seconds after contrast injection using the following parameters: slice thickness, 5 mm; interval, 5 mm; scan type, cine mode; 8 contiguous sections of 40 mm diameter; rotation speed, 0.5 sec; 80 Kvp; 200 mA; scan field of view, 33 cm; and matrix, 512 x 512 mm. All patients underwent surgery without pre-operative chemotherapy or radiation therapy after perfusion CT was performed. Image Analysis All CT scanning data were sent to a workstation (Advantage Windows 4.2; GE Healthcare Technologies). Two gastrointestinal radiologists (YYJ and JWK, with abdominal imaging experience of 15 and 3 years, respectively) reviewed the eight contiguous section images and selected one section image as having the best visualized tumor, with consensus. One gastrointestinal radiologist analyzed the selected 5 mm tumor section image by using perfusion software based on distributed parameter analysis (Body Protocol, Perfusion 3.0; GE Healthcare Technologies). An arterial input was defined by using a mouse to place a circular region of interest (ROI), 25 mm2 in area, within the best visualized iliac or femoral artery on the selected image. The software automatically derived a smoothed arterial time-enhancement curve, and parametric maps were generated, with each pixel representing a parameter value. Three circular or ovoid ROIs (mean area = 31.23 mm2; range = 13-67 mm2) were manually defined on the most enhanced area of the tumor. The ROIs of the tumor did not include central, poorly enhanced, low-attenuated areas, which were considered to be areas of necrosis or poorly vascularized areas within the tumor. Among three ROIs, the one with the highest attenuation was selected as the tumor ROI (mean area = 30.85 mm2; range = 13-57 mm2). Tumor blood flow (BF), BV, mean transit time (MTT), and PS measurements were obtained by manually defining a tumor ROI within the tumor boundary (Fig. 1). We took care to ensure that the tumor ROI remained within the tumor boundary, and excluded luminal gas when present, by viewing a cine loop of the perfusion CT images. The mean values for each of the four perfusion parameters (BF, BV, MTT, and PS) were recorded. Tumor Grade, Immunohistochemical Staining and Microvessel Density The surgical specimens were fixed with 10% formaldehyde and embedded in paraffin, then the tumor specimens were divided by one gastrointestinal pathologist (JHL, with kjronline.org. 부록-13.indd 91. Korean J Radiol 13(Suppl 1), Jan/Feb 2012. 15 years of experience) into three histologic subgroups (well differentiated, moderately differentiated, and poorly differentiated CRC). For evaluation of tumor angiogenesis, additional tissue blocks from each tumor were acquired for further immunohistochemical staining. The locations for additional tissue on tumor specimens were selected at the mid-portion of the tumor in the craniocaudal direction, then several 4 μm-thick sections (range, 3-7 μm) acquired by 5 mm intervals along the cranial and caudal direction from the selected tumoral mid-portion. Particular care was taken to ensure additional tissue did not include necrotic portions of the tumor, if possible. A representative paraffin block of 10% formalinfixed tumor tissue was cut to a thickness of 4 μm and immunohistochemical staining was carried out using a Microprobe Immuno/DNA stainer (Fisher Scientific, Pittsburgh, PA, USA). Immunohistochemical analysis of CD34 (titer 1:200, monoclonal; Zymed, San Francisco, CA, USA) was performed using the avidin-biotin complex method. Sections were deparaffinized, then incubated in the primary antibodies for 20 minutes at 45°C. Tissue sections for CD34 were incubated in pepsin solution (Research Genetics, Huntsville, AL, USA) for 4 minutes before application of primary antibody. Anti-mouse immunoglobulin G (Sigma Chemical, St. Louis, MO, USA) labeled with biotin was used, and a secondary antibody for the detection of primary antibodies was incubated for 7 minutes at 45°C. The streptavidin-horseradish peroxidase detection system (Research Genetics, Huntsville, AL, USA) was then applied to capillary channels, followed by 10 minutes of incubation at 45°C. After drainage, the tissue sections were ready for chromogen reaction with 3,3’-diamino-benzidine. The sections were counterstained with hematoxylin and mounted in Universal Mount (Research Genetics, Huntsville, AL, USA). Negative controls were treated similarly, with the exception of primary antibodies. Hot spot analysis was used as criteria for microvessel counting, as established by Weidner (16). The rationale of counting microvessels in vascular ‘hot spots,’ or in areas giving the impression at low magnification of containing numerous microvessels, is that these areas originated from tumor cell clones with the highest angiogenic potential, and consequently, had the easiest access to the blood stream and an increased probability of producing metastasis capable of becoming angiogenic and growing tumors (17). Any single brown-staining endothelial cell or small S91. 12. 4. 16. 오전 9:27.
(4) Kim et al.. clusters of brown-staining endothelial cells, with or without a lumen, clearly separate from adjacent microvessels, tumor cells, and other connective tissue elements, were. considered as individual vessels. Vessels of a caliber larger than approximately eight red blood cells and vessels with a thick muscular wall were excluded from the final count.. A. B. C. D. E Fig. 1. Perfusion CT of rectal cancer in 68 year-old woman.. A. Contrast-enhanced CT image shows tumor region of interests within enhancing rectal cancer (arrows) and arterial input (arrowhead) in left iliac artery. B-E. Corresponding functional color maps of rectal tumor (arrow) and iliac artery (arrowhead) for each perfusion parameter [(B) blood flow, (C) blood volume, (D) mean transit time, and (E) permeability surface-area product] are displayed according to color scale.. S92. 부록-13.indd 92. Korean J Radiol 13(Suppl 1), Jan/Feb 2012. kjronline.org. 12. 4. 16. 오전 9:27.
(5) Perfusion CT in Colorectal Cancer. Slides were examined at low-power magnification (x 40) to identify the areas with the highest density of microvessels. In each case, the most vascularized area was selected and the microvessels within a high-power magnification (x 200) field of this area were counted 3 times. The mean of the three highest counts per tumor was used for analysis (Fig. 2). Statistical Analysis The correlation between the four perfusion parameters (BF, BV, MTT, and PS) and MVD, and the three histologic grades of CRC was examined using the Kruskal-Wallis test. The correlation between perfusion parameters and MVD was analyzed using Pearson’s correlation analysis. All analyses were performed using the Statistical Package for the Social Sciences (SPSS, version 17; SPSS, Chicago, IL, USA). A value of p < 0.05 was considered significant.. DISCUSSION. RESULTS All tumors were histologically proven to be non-mucinous CRCs after surgery. The mean interval between pre-operative CT scan and surgery was 23.5 days (range of 7-75 days). Of 27 CRCs, there were 8, 15, and 4 well differentiated, moderately differentiated, and poorly differentiated CRCs, respectively. The tumors were located in the rectum and sigmoid colon in 23 and 4 patients, respectively. There were 3 T2 tumors, 21 T3 tumors, and 3 T4 tumors.. Fig. 2. Increased CD34 immunostaining in moderately differentiated colorectal adenocarcinomas was observed. Microvessels were defined as single brown-staining endothelial cells with lumen (arrow) and small clusters of brown-staining endothelial cells without lumen (arrowhead) (CD34 immunostaining at x 200 magnification).. kjronline.org. 부록-13.indd 93. The correlation of perfusion parameters and tumor grade is summarized in Table 1. The mean BF was significantly higher in moderately differentiated than well differentiated and poorly differentiated CRCs (p = 0.014). The mean MTT was significantly shorter in moderately differentiated compared with well differentiated and poorly differentiated CRCs (p = 0.039). There was no significant correlation between the other perfusion parameters (BV and PS) and tumor grade (p > 0.05). The MVD was significantly greater in poorly differentiated than well differentiated and moderately differentiated CRCs (p = 0.034) (Table 1, Fig. 3). The Pearson’s correlation coefficients (r) and p values between the four perfusion parameters (BF, BV, MTT, and PS) and MVD in CRCs are summarized in Table 2. There was no significant correlation between the four perfusion parameters and MVD in CRCs (Fig. 4).. Korean J Radiol 13(Suppl 1), Jan/Feb 2012. Our study showed that the mean BF was significantly lower in poorly differentiated than well differentiated and moderately differentiated CRCs. There was no significant difference between tumor grades with respect to the other perfusion parameters. Among the four perfusion parameters (BF, BV, MTT and PS), it is well known that BF reflects the flow rate through the vasculature in the tissue region and is related to tumor vascularity and tumor grade. In general, as the tumor grade is higher, the BF value further increases. Dugdale et al. (18) demonstrated a correlation between higher tumor BF and higher grade of lymphoma based on histopathologic examination. There are some conflicting results between previous reports and our study. These observations stand in contrast to the conventional belief that high-grade tumors have increased vascularity. Contrary to current dogma, Sahani et al. (19) reported that the mean BF values were higher in well differentiated HCC than in moderately differentiated or poorly differentiated HCCs. They suggested that a relatively larger tumor diameter (mean of 9 cm) and the presence of tumor necrosis in the high-grade tumor group could account for their results. There were several problems in comparing directly HCC and CRC because HCC and CRC are different in tumor nature and behavior. We found that the vascularities of CRC were increased in moderately differentiated CRCs compared to well differentiated CRCs, and decreased in poorly differentiated CRCs compared to moderately differentiated and well differentiated CRCs. There are two hypotheses to S93. 12. 4. 16. 오전 9:27.
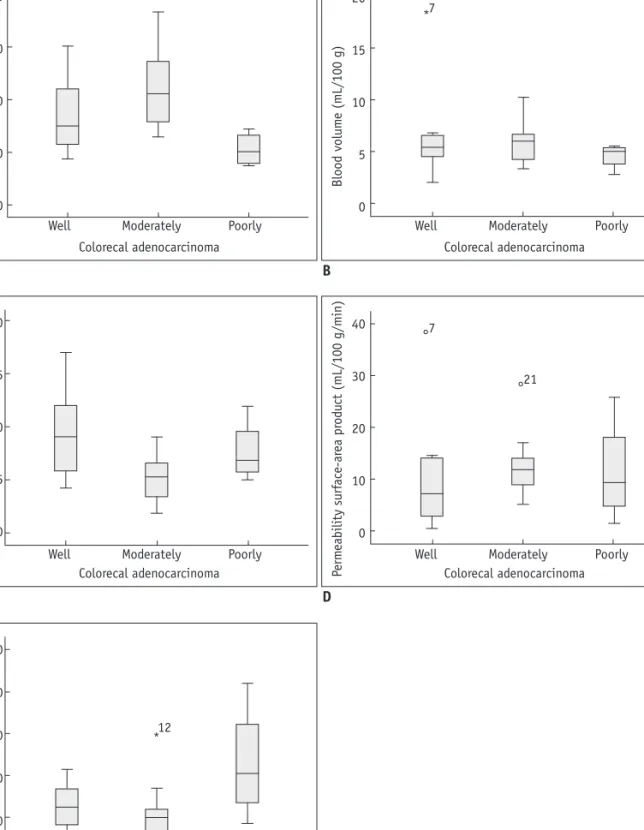
(6) Kim et al.. CRCs have larger regions in which endothelial cells have high vascular permeability, therefore the interstitial pressure will increase and can compress the capillary sprouts and. 200. 20. 150. 15. Blood volume (mL/100 g). Blood flow (mL/100 g/min). account for our results. First, the growth rate of CRCs was too rapid to develop angiogenesis of mature vessels in poorly differentiated CRCs. Second, poorly differentiated. 100. 50. 0. 7 *. 10. 5. 0 Well. Moderately. Poorly. Well. Colorecal adenocarcinoma. 20. 15 Mean transit time (sec). Poorly. B. 10. 5. 0 Well. Moderately Poorly Colorecal adenocarcinoma. C. Permeability surface-area product (mL/100 g/min). A. Moderately Colorecal adenocarcinoma. 40. 7. 30. 21. 20. 10. 0 Well. Moderately Poorly Colorecal adenocarcinoma. D. Microvessel density (no/mm2). 100 80 12 *. 60 40 20 0 Well. Moderately Poorly Colorecal adenocarcinoma. E Fig. 3. Relationship between CT perfusion parameters (A-D) and microvessel densities (E) of well differentiated, moderately differentiated, and poorly differentiated colorectal adenocarcinoma (CRC). There were significant differences in blood flow (A), mean. transit time (C), and microvessel densities (E) between well differentiated, moderately differentiated, and poorly differentiated CRC (p < 0.05).. S94. 부록-13.indd 94. Korean J Radiol 13(Suppl 1), Jan/Feb 2012. kjronline.org. 12. 4. 16. 오전 9:27.
(7) 200. 20. 150. 15. Blood volume (mL/100 g). Blood flow (mL/100 g/min). Perfusion CT in Colorectal Cancer. 100. 50. 0. 5. 0 0. 20 40 60 Microvessel density (no/mm). 80. 100. A. 0. 20 40 60 Microvessel density (no/mm). 80. 100. 0. 20 40 60 Microvessel density (no/mm). 80. 100. 15. 10. 5. 0 0. 20 40 60 Microvessel density (no/mm). 80. 100. Permeability surface-area product (mL/100 g/min). B 20. Mean transit time (sec). 10. 40. 30. 20. 10. 0. C D Fig. 4. Correlation plots of microvessel density (MVD) and CT vascular parameters. (A) blood flow, (B) blood volume, (C) mean transit time, and (D) permeability surface-area product. No perfusion parameters correlated significantly with MVD.. small capillaries more than in well differentiated and moderately differentiated CRCs. Our study showed that the mean MTT was significantly shorter in moderately differentiated than in well differentiated and poorly differentiated CRCs. It is well established that the MTT is defined as the average time required to travel from the artery to the vein; the MTT is considered to be a marker of perfusion pressure. Sahani et al. (19) reported that well differentiated HCCs had a shorter MTT and higher BF than moderately differentiated and poorly differentiated HCCs. Our study showed that moderately differentiated CRCs had a shorter MTT and higher mean BF than well differentiated and poorly differentiated CRCs, thus the results in the current study are similar to of the results of Sahani et al. (19) MVD assessment is the most commonly used technique to quantify intratumoral angiogenesis in cancer (13). Our study also showed a correlation between tumor grades and kjronline.org. 부록-13.indd 95. Korean J Radiol 13(Suppl 1), Jan/Feb 2012. MVD. Tumor vessels, irrespective of tumor size, demonstrate a zonal distribution in which vascularity decreases from the tumor edge to the center (20, 21). As the tumor grows, the central portions become relatively hypovascular and eventually necrotic. MVD is a surrogate marker of tumoral angiogenesis and has been proposed to identify patients at high risk of recurrence, since high values of MVD have been correlated with poor outcome in CRC (4, 5). This association is greatest when measurements of MVD are restricted to the peripheral angiogenesis zone (20, 22). However, other studies suggest that the relationship between MVD and CRC is controversial (6, 8, 15). Chen et al. (23) reported that the gross enhancement morphology of HCC lesions is also correlated with tumor MVD, and reflects the distributive features of tumor microvessels within HCC lesions. Jinzaki et al. (24) reported that the enhancement pattern on CT was different among the subtypes of RCCs, and correlated with either MVD or with the existence of intratumoral S95. 12. 4. 16. 오전 9:27.
(8) Kim et al.. necrosis or hemorrhage. Therefore, we hypothesized that the enhanced area of tumors without necrosis in defining tumor ROI reflects MVD for angiogenesis more than including the entire tumor with a central, poorly vascularized area in CRC. Our study used an enhanced focal area as a tumor ROI “so called hot spot analysis” rather than the entire tumoral area. Hot spot analysis is a widely performed technique that has been shown to yield results that are reflective of both tumor neovascularization and prognosis (13, 17). In poorly differentiated CRCs, MVD was significantly increased compared to well differentiated and moderately differentiated CRCs. However, there was no significant correlation between perfusion parameters and MVD. The results are similar to the findings reported by Li et al. (15). The study defined the maximally enhanced large area of the tumor as the tumor ROI and there was no clinical correlation between MVD and perfusion parameters. In contrast, Goh et al. (14) reported that the tumor PS and BV correlate positively with MVD and may reflect the microvascularity of CRCs. They defined the entire area of the tumor on selected CT images as the tumor ROI and used two counting methods of systematic field and hot spot analysis (17, 25). However, there is a paucity of CRC data using systemic field analysis with the former approach. This difference in the methods of defining tumor ROI and microvessel counting between our study and the study of Goh et al. (14) may be one of the causes accounting for the different results, and as such there is still a need for standardization of microvessel counting. Because tumor angiogenesis can be assessed with different microvessel counting methods, the issue of which method is the most effective remains controversial (26). There were several limitations to our study. First, the study sample size was small and there were few cases of poorly differentiated CRCs because the prospective consecutive selection of patients was done prior to surgery. Accordingly, a study with a larger number of patients is needed. Second, there is no precise correlation between tumor ROI in perfusion CT and pathologic specimen after surgery. Third, radiation hazards still remain a limitation in perfusion CT. Nevertheless, as CT machines and software have been developed and additional research is performed, the radiation dose of perfusion CT to patients may decrease. In conclusion, BF and MTT may be effective and clinically useful in the prediction of moderately differentiated CRCs, although the BV and PS are not effective in prediction of tumor grade in CRCs. Pre-operative perfusion CT does not reflect MVD of CRCs. S96. 부록-13.indd 96. REFERENCES 1. Parkin DM, Pisani P, Ferlay J. Estimates of the worldwide incidence of eighteen major cancers in 1985. Int J Cancer 1993;54:594-606 2. Parkin DM, Bray F, Ferlay J, Pisani P. Global cancer statistics, 2002. CA Cancer J Clin 2005;55:74-108 3. Burton S, Norman AR, Brown G, Abulafi AM, Swift RI. Predictive poor prognostic factors in colonic carcinoma. Surg Oncol 2006;15:71-78 4. Takebayashi Y, Aklyama S, Yamada K, Akiba S, Aikou T. Angiogenesis as an unfavorable prognostic factor in human colorectal carcinoma. Cancer 1996;78:226-231 5. Li C, Gardy R, Seon BK, Duff SE, Abdalla S, Renehan A, et al. Both high intratumoral microvessel density determined using CD105 antibody and elevated plasma levels of CD105 in colorectal cancer patients correlate with poor prognosis. Br J Cancer 2003;88:1424-1431 6. Hawighorst H, Knapstein PG, Knopp MV, Weikel W, Brix G, Zuna I, et al. Uterine cervical carcinoma: comparison of standard and pharmacokinetic analysis of time-intensity curves for assessment of tumor angiogenesis and patient survival. Cancer Res 1998;58:3598-3602 7. Macchiarini P, Fontanini G, Hardin MJ, Squartini F, Angeletti CA. Relation of neovascularisation to metastasis of non-smallcell lung cancer. Lancet 1992;340:145-146 8. Bossi P, Viale G, Lee AK, Alfano R, Coggi G, Bosari S. Angiogenesis in colorectal tumors: microvessel quantitation in adenomas and carcinomas with clinicopathological correlations. Cancer Res 1995;55:5049-5053 9. Weidner N, Semple JP, Welch WR, Folkman J. Tumor angiogenesis and metastasis--correlation in invasive breast carcinoma. N Engl J Med 1991;324:1-8 10. Gasparini G, Weidner N, Maluta S, Pozza F, Boracchi P, Mezzetti M, et al. Intratumoral microvessel density and p53 protein: correlation with metastasis in head-and-neck squamous-cell carcinoma. Int J Cancer 1993;55:739-744 11. Wakui S, Furusato M, Itoh T, Sasaki H, Akiyama A, Kinoshita I, et al. Tumour angiogenesis in prostatic carcinoma with and without bone marrow metastasis: a morphometric study. J Pathol 1992;168:257-262 12. Olivarez D, Ulbright T, DeRiese W, Foster R, Reister T, Einhorn L, et al. Neovascularization in clinical stage A testicular germ cell tumor: prediction of metastatic disease. Cancer Res 1994;54:2800-2802 13. Des Guetz G, Uzzan B, Nicolas P, Cucherat M, Morere JF, Benamouzig R, et al. Microvessel density and VEGF expression are prognostic factors in colorectal cancer. Meta-analysis of the literature. Br J Cancer 2006;94:1823-1832 14. Goh V, Halligan S, Daley F, Wellsted DM, Guenther T, Bartram CI. Colorectal tumor vascularity: quantitative assessment with multidetector CT--do tumor perfusion measurements reflect angiogenesis? Radiology 2008;249:510-517 15. Li ZP, Meng QF, Sun CH, Xu DS, Fan M, Yang XF, et al. Tumor. Korean J Radiol 13(Suppl 1), Jan/Feb 2012. kjronline.org. 12. 4. 16. 오전 9:27.
(9) Perfusion CT in Colorectal Cancer. angiogenesis and dynamic CT in colorectal carcinoma: radiologic-pathologic correlation. World J Gastroenterol 2005;11:1287-1291 16. Weidner N. Intratumor microvessel density as a prognostic factor in cancer. Am J Pathol 1995;147:9-19 17. Vermeulen PB, Gasparini G, Fox SB, Colpaert C, Marson LP, Gion M, et al. Second international consensus on the methodology and criteria of evaluation of angiogenesis quantification in solid human tumours. Eur J Cancer 2002;38:1564-1579 18. Dugdale PE, Miles KA, Bunce I, Kelley BB, Leggett DA. CT measurement of perfusion and permeability within lymphoma masses and its ability to assess grade, activity, and chemotherapeutic response. J Comput Assist Tomogr 1999;23:540-547 19. Sahani DV, Holalkere NS, Mueller PR, Zhu AX. Advanced hepatocellular carcinoma: CT perfusion of liver and tumor tissue--initial experience. Radiology 2007;243:736-743 20. Konerding MA, Fait E, Gaumann A. 3D microvascular architecture of pre-cancerous lesions and invasive carcinomas of the colon. Br J Cancer 2001;84:1354-1362 21. Goh V, Halligan S, Gharpuray A, Wellsted D, Sundin J, Bartram. kjronline.org. 부록-13.indd 97. Korean J Radiol 13(Suppl 1), Jan/Feb 2012. CI. Quantitative assessment of colorectal cancer tumor vascular parameters by using perfusion CT: influence of tumor region of interest. Radiology 2008;247:726-732 22. Miles KA. Tumour angiogenesis and its relation to contrast enhancement on computed tomography: a review. Eur J Radiol 1999;30:198-205 23. Chen WX, Min PQ, Song B, Xiao BL, Liu Y, Ge YH. Single-level dynamic spiral CT of hepatocellular carcinoma: correlation between imaging features and density of tumor microvessels. World J Gastroenterol 2004;10:67-72 24. Jinzaki M, Tanimoto A, Mukai M, Ikeda E, Kobayashi S, Yuasa Y, et al. Double-phase helical CT of small renal parenchymal neoplasms: correlation with pathologic findings and tumor angiogenesis. J Comput Assist Tomogr 2000;24:835-842 25. Beresford MJ, Harris AL, Ah-See M, Daley F, Padhani AR, Makris A. The relationship of the neo-angiogenic marker, endoglin, with response to neoadjuvant chemotherapy in breast cancer. Br J Cancer 2006;95:1683-1688 26. Offersen BV, Borre M, Overgaard J. Quantification of angiogenesis as a prognostic marker in human carcinomas: a critical evaluation of histopathological methods for estimation of vascular density. Eur J Cancer 2003;39:881-890. S97. 12. 4. 16. 오전 9:27.
(10)
수치

관련 문서
The purpose of this study was to compare the remineralization effect of Silver Diamine Fluoride (SDF) on demineralized enamel over time with those of fluoride varnish..
The purpose of this study was to analyze the cultural contents of English textbooks (Grade 7) according to the 2009 revised middle school curriculum and
Purpose: This study was aimed to compare the functional outcomes of the continuous and discontinuous fractures, retrospectively, in multiple thoracolumbar
Objective: The purpose of this study was to analyze recent trend in incidence of basal cell carcinoma and squamous cell carcinoma in patients from the Gwangju City
In the present study, as a preliminary study, a LACC-based Compton CT was developed to estimate the activity of the spot inside the radioactive waste drum. To
The purpose of this case study was to find comparison of sports related physical fitness and anaerobic power changes of college hockey players and
The purpose of this study was to analyze the impaction pattern of the impacted mandibular third molar and the relationship with the inferior alveolar nerve
The aim of this study was not only to compare the differences of ego-resilience between students with high experience and students with low experience in
