http://e-nrp.org
Development of a food-based index of dietary inflammatory potential for Koreans and its relationship with metabolic syndrome
Woori Na
1, Tae Yang Yu
2§and Cheongmin Sohn
1§1Department of Food and Nutrition, Wonkwang University, 460, Iksan-daero, Iksan-si, Jeonbuk, 54538, Republic of Korea
2Division of Endocrinology and Metabolism, Department of Medicine, Wonkwang University School of Medicine, Jeonbuk, Iksan, Republic of Korea
BACKGROUND/OBJECTIVES: Inflammation is known to be a risk factor for metabolic diseases. This study aimed to develop a Food-based Index of Dietary Inflammatory Potential (FBDI) and examine its association with metabolic biomarkers.
SUBJECTS/METHODS: This study analyzed the raw data from the 2012-2014 Korean Genome and Epidemiology Study data of 17,771 people. To analyze the relationship between foods consumed by Koreans and inflammation, we conducted a correlation analysis between 51 food groups and hs-CRP levels. The FBDI was developed from 17 food groups selected by multiple regression method. We examined whether FBDI was associated with metabolic markers (waist circumference, blood pressure, fasting glucose, triglyceride, and HDL-cholesterol) in the 6th Korea National Health and Nutrition Examination Survey (KNHANES). We used binary logistic regression analysis to examine the association.
RESULTS: The FBDI model included seven of the anti-inflammatory food groups and three of the pro-inflammatory food groups.
The FBDI formula was calculated by multiplying the intake of food group by β-coefficients derived from the multiple regression model based on the correlation analysis. The FBDI was significantly associated with waist circumference (P < 0.001), blood pressure (P < 0.001), triglyceride level (P < 0.001), and HDL-cholesterol (P < 0.001) level among adults aged 20-64 years in the KNHANES.
The prevalence of metabolic syndrome was 2.618 times higher in the group with the highest FBDI than in the group with the lowest one (95% confidence interval: 1.778-3.856, P for trend < 0.001).
CONCLUSIONS: This study established an FBDI reflecting food intake patterns of Koreans, which showed a significant relationship with the prevalence of metabolic syndrome.
Nutrition Research and Practice 2019;13(2):150-158; https://doi.org/10.4162/nrp.2019.13.2.150; pISSN 1976-1457 eISSN 2005-6168
Keywords: Inflammation, diet, Korea, metabolic syndrome
INTRODUCTION
*Current trends in metabolic diseases, such as metabolic syndrome, diabetes mellites, hypertension, and cerebrovascular disease, which are highly related to lifestyle [1,2], show an overall increase in prevalence. Globally, the world prevalence of diabetes among adults was 6.4% in 2010 and will increase up to 7.7% by 2030 [3]. The prevalence of metabolic syndrome in Korea was 24.9% and 29.0% in 1998 and 2013, respectively.
Therefore, there was a 16% increase in numbers of adults with metabolic syndrome [4,5]. As a result, medical expenditures rate increased by 6.8% from 2005 to 2015 in Korea [6]; thus, preventive management is emphasized nationally. The lack of physical activity, diet-related factors, and chronic inflammation has been reported as major factors related to metabolic diseases [7]. Chronic inflammation is related to both the expression and progression of metabolic diseases. High-sensitivity C-reactive protein (hs-CRP), nuclear factor kappa B (NF-κB), interleukin-6
(IL-6), and tumor necrosis factor α (TNF-α) are known to be typical inflammatory indexes. The American Heart Association and Centers for Disease Control and Prevention (AHA/CDCP) have proposed the use of hs-CRP as a risk assessment index in patients with cardiovascular disease (CVD) [8].
Several studies have been shown that chronic inflammation is also highly associated with dietary factors. The relationship between inflammation and nutrients, such as vitamins, complex carbohydrates, and dietary fiber, has been reported [9-13], and food group intake such as vegetables, fruits [14] and whole grains [15] have been found to decrease inflammation. Dietary patterns, as well as single nutrients and foods, have been reported to be associated with chronic inflammation, and the mediterranean diet has been reported to be a typical anti-inflammatory dietary pattern [16]. On the contrary, Western dietary patterns that involve the consumption of high-fat red meat, high-fat dairy products, and refined grains are related to chronic inflammation [17].
This work was supported by the National Research Foundation of Korea (NRF) grant funded by the Korea Government (MSIP) (No.NRF-2016R1A2B1014466)
§Corresponding Authors: Cheongmin Sohn, Tel. 82-63-850-6656, Fax. 82-63-850-7301, Email. [email protected] Tae Yang Yu, Tel. 82-63-859-2670, Fax. 82-63-855-2025, Email. [email protected] Received: June 26, 2018, Revised: August 14, 2018, Accepted: February 13, 2019
This is an Open Access article distributed under the terms of the Creative Commons Attribution Non-Commercial License (http://creativecommons.org/licenses/by-nc/3.0/) which permits unrestricted non-commercial use, distribution, and reproduction in any medium, provided the original work is properly cited.
(A)
(B)
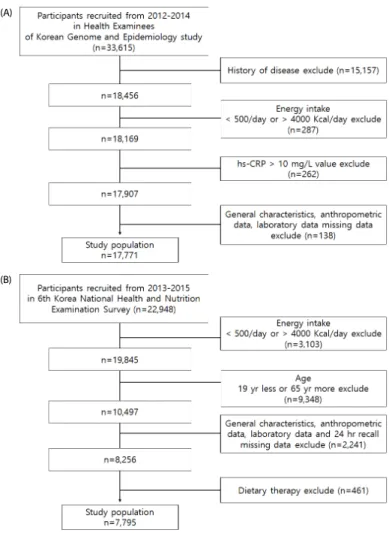
Fig. 1. Flowchart of subjects. (A) Development of Food Based Dietary Inflammatory potential (FBDI) data from KoGES HEXA. (B) Association of the FBDI and metabolic syndrome data from KNHANES.
Thus, Shivappa et al. [18] developed a noninvasive method of estimating inflammation associated with dietary intake using systematic literature review data. The results of studying US and Europe-centered dietary inflammatory index (DII) showed that the increase in DII correlates with the risk of asthma, depression, and various cancers, as well as risk of mortality owing to cancer [19]; further, it correlates with the risk of metabolic syndrome [20] and cerebrovascular disease [21-23], which are representative of metabolic diseases. The variables used in the formula for DII are the 39 nutrients and 6 food intakes data, which are derived from the nutrient analysis process after the dietary intake survey. Therefore, there is a limitation that it is difficult to directly evaluate the dietary inflammatory status in the clinical nutrition field. In addition, Tabung et al. [24] developed the empirical dietary inflammatory index (EDII) that can be assessed with only food intake calculation without nutrient analysis.
Although EDII is advantageous that it can be used immediately in the field, the food category is mainly composed with Western diet, so it is limited for use in evaluating food inflammation in Koreans. In the previous study we developed the Korean dietary inflammatory index (K-DII), reflecting Korean dietary patterns that can be used immediately in the field [25].
However, inflammation related food categories were derived
based on hs-CRP levels > 3 ml/L, which is used as an index of cardiovascular disease. In this study, we aimed to develop a dietary inflammatory evaluation tool that composed with food categories which are reflecting chronic inflammatory status rather than specific diseases.
Therefore, this study aimed 1) to develop the Food-based Index of Dietary Inflammatory Potential (FBDI) model as a food intake weight reflecting the dietary pattern for Korean people and 2) to examine whether the FBDI developed using the Korean Genome and Epidemiology Study (KoGES) data is associated with metabolic biomarkers and metabolic syndrome in the Korea National Health and Nutrition Examination Survey (KNHANES).
SUBJECTS AND METHODS
Development of the FBDI assessment tool Selection of subjects
This study used data from health examinees (HEXA) of KoGES
to obtain general information, disease history, and single-day
24-h recall assessment for the development of the FBDI. Details
related to the KoGES cohort are provided elsewhere [26]. A total
FBDI = (Mixed coffee · sweetened drinks applied value (0.029) × Mixed coffee · sweetened drinks intake (g)) + (White rice applied value (0.024)
× White rice intake (g)) + (Green vegetables applied value (-0.034) × Green vegetables intake (g)) + (Eggs applied value (-0.063) × Eggs intake (g)) + (Citrus applied value (-0.032) × Citrus intake (g)) + (Legumes applied value (-0.027) × Legumes intake (g)) + (Red fruits applied value (-0.015)
× Red fruit intake (g)) + (Beef applied value (0.040) × Beef intake (g)) + (Bread · Wheat flour applied value (-0.035) × Bread · Wheat flour intake (g)) + (Nuts · seeds applied value (-0.089) × Nuts · seeds intake (g))
Fig. 2. Food-Based Dietary Inflammatory Potential; FBDI formula
of 33,615 subjects were aged 40-72 years in the 2012-2014 KoGES HEXA. Among them, 15,157 had diseases (i.e., hyper- tension, diabetes, stroke, myocardial infarction, angina pectoris, chronic gastritis, gastric ulcer, duodenal ulcer, chronic hepatitis, cholecystitis, bronchitis, arthritis, and cancer) that could potentially affect the hs-CRP levels. Moreover, we excluded subjects with hs-CRP levels > 10 mg/L (n = 262), which reflected exposure to infectious diseases or taking medications [8].
Additionally, those with implausible calorie intake ranges (< 500 kcal/day or more 4,000 kcal/day; n = 287) were excluded. People with missing data on general characteristics, anthropometric measurements, and laboratory analysis were excluded (n = 138), which resulted in 17,771 (52.8% of original data) subjects in the final analysis (Fig. 1A). The present study was approved by the Clinical Test Deliberation Commission of the Institutional Review Board, Wonkwang University (WKIRB-201801-SB-006).
Food groups
In this study, we reclassified 18 food groups provided by the KoGES-HEXA into 51 food groups. Grains were classified into nine categories: white rice, other grains, bread · wheat flour, noodles, ramen, pizza · hamburgers, rice cakes, cereal, and cookies · confectioneries. Based on the data from International Agency for Research on Cancer, fruits were divided based on colors and classified into four kinds: orange (colored) fruits, citrus fruits, red fruits, and berries [27]. Vegetables were divided according to colors or characteristics and classified into nine kinds green vegetables, cabbage · stem vegetables, lettuce, onion, bulbs, red vegetables · tomatoes, kimchi, ginger, and ginseng. Kimchi, frequently consumed by Koreans, was categorized separately. Meat was classified based on the criteria reported in a study conducted by Linseisen et al. [28] and was finally divided into eight categories: beef, pork, bacon, poultry, intestines, the other meat, processed meat product, and fried chicken. Beverages were classified into four kinds: brewed coffee beans · leaf tea, sikhye · carbonated beverage, mixed coffee · sweetened drinks, and alcohol. Fish and seafood was classified into four kinds (fish, shellfish, processed seafood, salted seafood (including salted fish egg)) and fat and oils into animal fat and vegetable oils. The others were primarily used food groups in KoGES: potatoes, sugars, legumes, nuts · seeds, mushroom, eggs, seaweed, dairy products, seasoning, and processed food.
Biochemical profiles
Blood samples were drawn by medical technologists after an 8-h overnight fast, collected in EDTA-containing tubes, and centrifuged at 3,500 rpm for 10 min at 4°C. Serum hs-CRP levels were measured with the Modular Analytics (Hitachi, Japan) using exclusive reagents (CRPHS, Roche, USA).
Statistical analysis
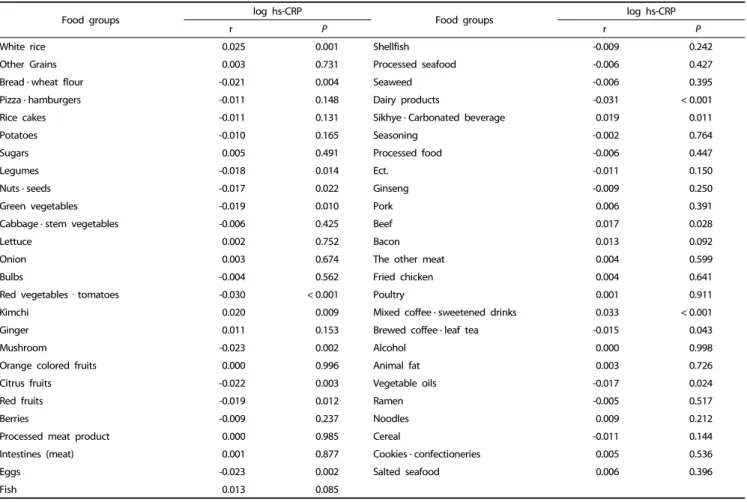
We conducted the Spearman correlation analysis and multiple regression for the selection of food groups and development of the FBDI formula. The Spearman correlation analysis between log hs-CRP and the 51 food groups was carried out to select food groups that considered a significant correlation (P < 0.05).
The selected food groups were reanalyzed using a stepwise multiple regression method with hs-CRP as a dependent variable.
We set probability-to-enter significance level at P ≤ 0.05, and probability-to-remove significance level at P ≥ 0.1 for the stepwise regression procedure. The FBDI formula was developed using the regression coefficients derived from the regression analysis (Fig. 2). All analysis results were considered significant at P < 0.05 and statistical analyses were performed with SPSS version 23.0 (IBM Corp., Armonk, NY, USA).
Association with FBDI and metabolic syndrome Selection of subjects
This study used data of 22,948 subjects from the 6th KNHANES (2013-2015). A total of 7,795 subjects were included in the final analysis for the association of FBDI with metabolic syndrome, after excluding 15,153 subjects (Fig. 1B). Exclusions were those who had calorie intakes of < 500 kcal/day or > 4,000 kcal/day and those aged < 19 years or > 65 years. Subjects who had a history of stroke, myocardial infarction, and cancer and who did not have complete information about general characteristics, anthropometric data, laboratory data, and single day 24-hour dietary recall were also excluded. Additionally, subjects who were receiving dietary therapy were excluded.
Metabolic syndrome was diagnosed according to the definition of the Modified National Cholesterol Education Program Adult Treatment Panel III proposed by the American Heart Association and National Heart, Lung, and Blood Institute (AHA/NHLBI) in 2005 [29]. HDL-cholesterol concentration of ≤ 40 mg/dL in men and ≤ 50 mg/dL in women, triglyceride levels of ≥ 150 mg/dL, systolic blood pressure of ≥ 130 mmHg or diastolic blood of
≥ 85 mmHg, or fasting blood glucose level of ≥ 100 mg/dL were characteristics of metabolic syndrome. Regarding the waist circumference, the Obesity Treatment Guidelines of the Korean Society for the Study of Obesity were used. Cut-off values of 90 cm and 85 cm were considered for men and women, respe- ctively, beyond which an individual was diagnosed with metabolic syndrome. Demographic variables such as age, sex, household income, and educational level of the subjects were obtained through questionnaires, and body mass index was calculated by dividing weight (kg) by height squared (m
2).
Statistical analysis
For calculation of FBDI in KNHANES, we matched 1,501 food
Food groups log hs-CRP
Food groups log hs-CRP
r P r P
White rice 0.025 0.001 Shellfish -0.009 0.242
Other Grains 0.003 0.731 Processed seafood -0.006 0.427
Bread · wheat flour -0.021 0.004 Seaweed -0.006 0.395
Pizza · hamburgers -0.011 0.148 Dairy products -0.031 < 0.001
Rice cakes -0.011 0.131 Sikhye · Carbonated beverage 0.019 0.011
Potatoes -0.010 0.165 Seasoning -0.002 0.764
Sugars 0.005 0.491 Processed food -0.006 0.447
Legumes -0.018 0.014 Ect. -0.011 0.150
Nuts · seeds -0.017 0.022 Ginseng -0.009 0.250
Green vegetables -0.019 0.010 Pork 0.006 0.391
Cabbage · stem vegetables -0.006 0.425 Beef 0.017 0.028
Lettuce 0.002 0.752 Bacon 0.013 0.092
Onion 0.003 0.674 The other meat 0.004 0.599
Bulbs -0.004 0.562 Fried chicken 0.004 0.641
Red vegetablesㆍtomatoes -0.030 < 0.001 Poultry 0.001 0.911
Kimchi 0.020 0.009 Mixed coffee · sweetened drinks 0.033 < 0.001
Ginger 0.011 0.153 Brewed coffee · leaf tea -0.015 0.043
Mushroom -0.023 0.002 Alcohol 0.000 0.998
Orange colored fruits 0.000 0.996 Animal fat 0.003 0.726
Citrus fruits -0.022 0.003 Vegetable oils -0.017 0.024
Red fruits -0.019 0.012 Ramen -0.005 0.517
Berries -0.009 0.237 Noodles 0.009 0.212
Processed meat product 0.000 0.985 Cereal -0.011 0.144
Intestines (meat) 0.001 0.877 Cookies · confectioneries 0.005 0.536
Eggs -0.023 0.002 Salted seafood 0.006 0.396
Fish 0.013 0.085
Table 1. Analysis of correlation between log hs-CRP and food groups
codes of KoGES with 1,075 secondary food codes of KNHANES.
To evaluate the difference in the general body measurements, biochemical indicators, and nutrient intake according to FBDI, FBDI values were divided into quartiles, and analysis of variance and crossover analyses were performed. In addition, odds ratio (OR) and confidence interval (CI) were calculated by performing binary logistic regression analysis to analyze the prevalence of metabolic syndrome associated with FBDI. All analyses were performed as composite samples, which calculated the composite weight by multiplying the survey weight by one-third for each of the years (2013-2015). Nominal variables were household income (low/moderate-low/moderate-high/high), educational level (primary school/middle school/high school graduation/college graduate or higher), present smoking status (current/past/non-smoker), and moderate physical activity practice rate (Y/N), and continuous variables were age, energy intake, and body mass index. All statistical analyses were considered significant at P < 0.05 and were performed using SPSS version 23.0 (IBM Corp., Armonk, NY, USA).
RESULTS
Development of the FBDI assessment tool model
As a result of correlation analysis with between log hs-CRP and the 51 food groups, 17 food group showed a significant correlation (P < 0.05) (Table 1 & 2). After repeating the multiple
regression analysis of 17 food groups, 10 food groups finally selected as significant formula factors (Supplement 1). The β coefficients derived from each food group intake was too small, therefore, each β coefficient was multiplied by 100. We developed the formula using applied value derived the beta (β) coefficients of the multiple regression equation for the 10 food groups with confirmed significance (Fig. 2).
Association with FBDI and metabolic syndrome Characteristics of subjects according to FBDI
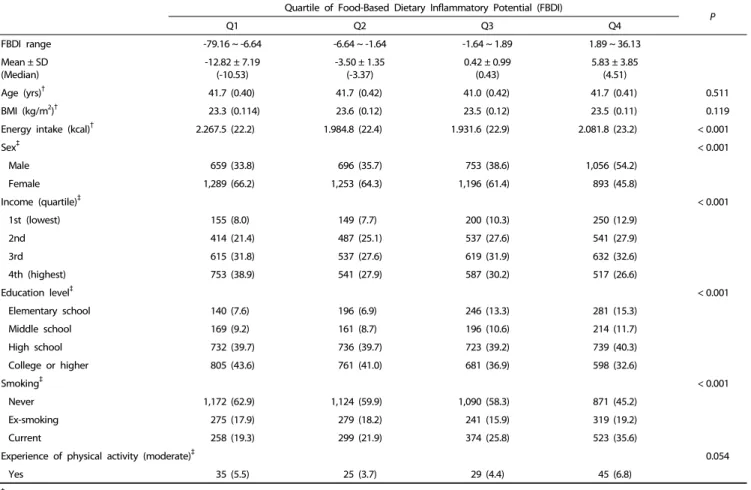
Table 3 shows the results of the analysis of the characteristics of subjects according to FBDI using the 6th KNHANES data for the association of FBDI with health indicators. The difference in sex, income, educational level, smoking and energy intake (kcal) with increasing FBDI was significant (P < 0.001); however, the difference with age, BMI and experience of physical activity was not significant.
Comparison of metabolic syndrome indicators and blood lipid concentration according to FBDI
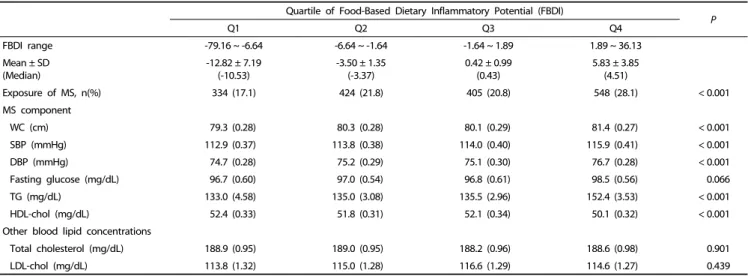
Table 4 shows the comparison of metabolic syndrome indicators and blood lipid concentration according to FBDI.
Waist circumference (WC), systolic blood pressure (SBP),
diastolic blood pressure (DBP), and triglyceride, which are
components of metabolic syndrome, were found to significantly
Quartile of Food-Based Dietary Inflammatory Potential (FBDI)
Q1 Q2 Q3 Q4 P
FBDI range -79.16 ~ -6.64 -6.64 ~ -1.64 -1.64 ~ 1.89 1.89 ~ 36.13
Mean ± SD
(Median) -12.82 ± 7.19
(-10.53) -3.50 ± 1.35
(-3.37) 0.42 ± 0.99
(0.43) 5.83 ± 3.85
(4.51)
Age (yrs)† 41.7 (0.40) 41.7 (0.42) 41.0 (0.42) 41.7 (0.41) 0.511
BMI (kg/m2)† 23.3 (0.114) 23.6 (0.12) 23.5 (0.12) 23.5 (0.11) 0.119
Energy intake (kcal)† 2.267.5 (22.2) 1.984.8 (22.4) 1.931.6 (22.9) 2.081.8 (23.2) < 0.001
Sex‡ < 0.001
Male 659 (33.8) 696 (35.7) 753 (38.6) 1,056 (54.2)
Female 1,289 (66.2) 1,253 (64.3) 1,196 (61.4) 893 (45.8)
Income (quartile)‡ < 0.001
1st (lowest) 155 (8.0) 149 (7.7) 200 (10.3) 250 (12.9)
2nd 414 (21.4) 487 (25.1) 537 (27.6) 541 (27.9)
3rd 615 (31.8) 537 (27.6) 619 (31.9) 632 (32.6)
4th (highest) 753 (38.9) 541 (27.9) 587 (30.2) 517 (26.6)
Education level‡ < 0.001
Elementary school 140 (7.6) 196 (6.9) 246 (13.3) 281 (15.3)
Middle school 169 (9.2) 161 (8.7) 196 (10.6) 214 (11.7)
High school 732 (39.7) 736 (39.7) 723 (39.2) 739 (40.3)
College or higher 805 (43.6) 761 (41.0) 681 (36.9) 598 (32.6)
Smoking‡ < 0.001
Never 1,172 (62.9) 1,124 (59.9) 1,090 (58.3) 871 (45.2)
Ex-smoking 275 (17.9) 279 (18.2) 241 (15.9) 319 (19.2)
Current 258 (19.3) 299 (21.9) 374 (25.8) 523 (35.6)
Experience of physical activity (moderate)‡ 0.054
Yes 35 (5.5) 25 (3.7) 29 (4.4) 45 (6.8)
†Mean (SD)
‡n (%)
Table 3. Characteristics of subjects according to quartile of FBDI (Q1-Q4)
Food group Reclassified food Reclassified food group
Grains 9 white rice, other grains, bread · wheat flour, noodles, ramen, pizza · hamburgers, rice cakes, cereals, and cookies · confectioneries
Potatoes 1 -
Sugars 1 -
Legumes 1 -
Nut · seeds 1 -
Vegetables 9 green vegetables, cabbage · stem vegetables, lettuce, onion, bulbs, red vegetables · tomatoes, kimchi, ginger, and ginseng
Mushroom 1 -
Fruits 4 orange (colored) fruits, citrus fruits, red fruits, berries
Meat 8 beef, pork, bacon, poultry, intestines, the other meat, processed meat products, and fried chicken
Eggs 1 -
Fish · Seafood 4 fish, shellfish, processed seafood, and salted seafood (including salted fish egg)
Seaweed 1 -
Dairy products 1 -
Fat · oil 2 animal fat, vegetable oil
Beverage · Alcohol 4 brewed coffee · leaf tea, sikhye · carbonated beverage, mixed coffee · sweetened drinks, and alcohol
Seasoning 1 -
Processed food 1 -
Etc. 1 -
18 51
Table 2. Food groups classification
Quartile of Food-Based Dietary Inflammatory Potential (FBDI)
P P for trend
Q1 Q2 Q3 Q4
Crude 1 (ref) 1.453 (1.201-1.758) 1.362 (1.122-1.652) 1.884 (1.566-2.266) < 0.001 < 0.001
Model 1† 1 1.502 (1.210-1.864) 1.450 (1.177-1.787) 1.610 (1.317-1.968) 0.001 < 0.001
Model 2‡ 1 1.470 (1.181-1.829) 1.365 (1.105-1.687) 1.488 (1.211-1.829) 0.001 0.001
Model 3§ 1 1.539 (1.187-1.996) 1.390 (1.077-1.793) 1.717 (1.362-2.164) < 0.001 < 0.001
Model 4¶ 1 1.996 (1.280-3.111) 1.757 (1.164-2.653) 2.618 (1.778-3.856) < 0.001 < 0.001
†Model 1: adjusted for sex, and age
‡Model 2: adjusted for sex, age, education, and income
§Model 3: adjusted for sex, age, education, income, BMI, and energy
¶Model 4: adjusted for sex, age, education, income, BMI, energy, smoking, and physical activity Table 5. Odd ratios of metabolic syndrome according to quartile of FBDI (Q1-Q4)
Quartile of Food-Based Dietary Inflammatory Potential (FBDI)
Q1 Q2 Q3 Q4 P
FBDI range -79.16 ~ -6.64 -6.64 ~ -1.64 -1.64 ~ 1.89 1.89 ~ 36.13
Mean ± SD
(Median) -12.82 ± 7.19
(-10.53) -3.50 ± 1.35
(-3.37) 0.42 ± 0.99
(0.43) 5.83 ± 3.85
(4.51)
Exposure of MS, n(%) 334 (17.1) 424 (21.8) 405 (20.8) 548 (28.1) < 0.001
MS component
WC (cm) 79.3 (0.28) 80.3 (0.28) 80.1 (0.29) 81.4 (0.27) < 0.001
SBP (mmHg) 112.9 (0.37) 113.8 (0.38) 114.0 (0.40) 115.9 (0.41) < 0.001
DBP (mmHg) 74.7 (0.28) 75.2 (0.29) 75.1 (0.30) 76.7 (0.28) < 0.001
Fasting glucose (mg/dL) 96.7 (0.60) 97.0 (0.54) 96.8 (0.61) 98.5 (0.56) 0.066
TG (mg/dL) 133.0 (4.58) 135.0 (3.08) 135.5 (2.96) 152.4 (3.53) < 0.001
HDL-chol (mg/dL) 52.4 (0.33) 51.8 (0.31) 52.1 (0.34) 50.1 (0.32) < 0.001
Other blood lipid concentrations
Total cholesterol (mg/dL) 188.9 (0.95) 189.0 (0.95) 188.2 (0.96) 188.6 (0.98) 0.901
LDL-chol (mg/dL) 113.8 (1.32) 115.0 (1.28) 116.6 (1.29) 114.6 (1.27) 0.439
MS, Metabolic Syndrome; WC,Waist Circumference; SBP, Systolic Blood Pressure; DBP, Diastolic Blood Pressure; TG,Triglyceride; HDL-chol, High-density lipoprotein cholesterol; LDL-chol, Low-density lipoprotein cholesterol
Table 4. Comparison of metabolic syndrome indicator and blood lipid concentration according to quartile of FBDI (Q1-Q4)
increase with increasing FBDI (P < 0.001), and the HDL- cholesterol level was found to significantly decrease with increasing FBDI (P < 0.001).
Association between FBDI and metabolic syndrome
Table 5 shows the results of the binary logistic regression analysis for the association between FBDI and metabolic syndrome. Among all subjects, the odds ratio of metabolic syndrome was found to be 1.884 times higher in the group with the highest FBDI than in the group with the lowest FBDI (95% CI: 1.566-2.266) (P < 0.001, P for trend < 0.001). Moreover, in the covariant-adjusted model (age, sex, educational level, income level, BMI, caloric intake, smoking, and physical activity), the prevalence of metabolic syndrome was 2.618 times higher in the group with the highest FBDI than in the group with the lowest FBDI (95% CI: 1.778-3.856) (P < 0.001, P for trend < 0.001).
DISCUSSION
This study aimed to develop an FBDI reflecting the actual inflammatory index and dietary intake of the Korean people and to analyze the association between FBDI and metabolic syndrome.
The composition of FBDI were included in seven anti-
inflammatory food groups (green vegetables, eggs, citrus fruits, legumes, red fruits, bread · wheat flour, nuts and seeds) and three pro-inflammatory food groups (mixed coffee · sweetened drinks, white rice, and beef). Previous studies on the relationship between food group intake and chronic inflammation showed that higher intakes of specific food or food group intake such as whole grains, fruits, vegetables, brewed coffee, and tea were associated with lower hs-CRP levels [14,15,30-32]. In our study the relationship between hs-CRP and food group showed that as the intakes of legumes, red fruits, citrus fruits, and green vegetables increases, hs-CRP decreases, showing similar results to that of the previous studies [14,30,32]. The increase in intake of citrus polyphenol, which is abundant in citrus and flavonoid that is abundant in red fruit decreases the blood levels of hs-CRP [31,33,34].
Various nutrients can be obtained by the traditional Korean
diet in a balanced way through rice, soup, and various side
dishes. Therefore, it is perceived that Korean dietary pattern
consisting of rice is as a healthy diet [38]. However, previous
studies reported that relatively high consumption of carbohy-
drates by rice intake with a few side dishes, is related to the
increase in metabolic syndrome, diabetes, and dyslipidemia
[39,40]. Similar to the results of previous studies, rice was also
analyzed as a pro-inflammatory food in our study. Therefore,
when suggesting dietary guidelines for metabolic disease patients with FBDI, balanced intake of various foods should be emphasized.
The FBDI developed in this study is worth drawing attention.
The FBDI was developed to reflect the relationship between inflammation and dietary intake using the foods showing direct correlation with the blood index of inflammation. Another significant point is that it can be calculated and assessed dietary inflammatory status directly in clinical practice field. The EDII, which was developed as an index that reflected the association between Western dietary style intake and biochemical inflammatory markers, is different with FBDI in terms of the kinds of inflammation-related foods [24]. The FBDI could be used as dietary assessment tool for measuring inflammation levels of subjects in countries with rice as a staple food.
Hs-CRP is known as an inflammatory index that can determine the individual's health status, and the AHA/CDCP presents the criteria for hs-CRP as an index for treatment and prognostic monitoring in patients with CVD [7,8]. In a previous study, we developed an inflammatory index based on the dietary patterns of Koreans (K-DII) by selecting the final 17 food groups through logistic regression analysis as a reference value of hs-CRP values using the matching sample method with the ratio of 1:2 [25].
However, the limitation of the K-DII was that it was developed based on hs-CRP values of ≥ 3 mg/L which is used as a reference of cardiovascular disease risk factor. However, FBDI is composed of food groups showed a correlation with hs-CRP values representing the chronic inflammation status instead of specific disease. Therefore, FBDI may be used for prevention and management of chronic inflammatory disease, such as metabolic syndrome, diabetes and hypertension, by estimating the inflammatory value. Regarding the association of FBDI, this study analyzed the 6th KNHANES data. Lower FBDI scores imply an anti-inflammatory diet, and higher scores reflect inflammatory meals. As a result of the analysis on the relationship between FBDI divided into quartiles and metabolic syndrome, as FBDI increases, waist circumference, systolic blood pressure, diastolic blood pressure, triglycerides, and HDL-cholesterol were signifi- cantly different among the components of metabolic syndrome and the risk of metabolic syndrome was also different. Metabolic syndrome is a disease that has been reported to correlate with various forms of inflammation, and many studies have shown its relationship with hs-CRP. Ghayour-Mobarhan et al. [41]
showed a positive correlation between CRP and triglyceride, and another study on 229 adults with metabolic syndrome in Korea showed a positive correlation between hs-CRP and waist circumference [42]. In a study by Ridker et al. [43], the number of subjects with metabolic syndrome was significantly increased according to the concentration of CRP, and in a study conducted by Santos et al. [44] on adults in the Portuguese region, all five components of metabolic syndrome were significantly higher in CRP when the criteria for metabolic syndrome are met, and as the number of constituent indicators increased, the average concentration of CRP increased. In our study, the risk of metabolic syndrome was increased in the group with higher FBDI than those with lowest FBDI. The study conducted by Indulekha et al. [45] of Asian-Indians showed that as the log hs-CRP value increases, the risk of metabolic
syndrome increases. Vu et al. [46] reported that increased incidence of peripheral vascular disease such as diabetes and CVD were associate with the increase of CRP levels. In the study by Danesh et al. [7] that analyzed the Reykjavik study, the risk of coronary artery disease was found to be 1.92 times higher in patients with CRP of > 2 mg/L, showing that CRP is closely related to vascular disease prognosis. The association of FBDI with disease was carried out for metabolic syndrome only at this time, therefore, further investigation of the association between FBDI and various chronic inflammatory related diseases is needed.
The limitation of this study is the use of 24-hour recall method to develop FBDI, which may not reflect the usual dietary intake pattern. In addition, FBDI was developed by analyzing the association between food intake and hs-CRP only, a typical inflammatory index. However, this study is significant because it developed a nutritional assessment tool that can be easily used on the clinical site reflecting the dietary inflammatory potential in Koreans.
CONFLICT OF INTEREST
The authors declare no potential conflicts of interests.
ORCID
Woori Na: https://orcid.org/0000-0002-5670-4520 Tae Yang Yu: https://orcid.org/0000-0003-0893-592X Cheongmin Sohn: https://orcid.org/0000-0003-0529-7037
REFERENCE
1. Zhu S, St-Onge MP, Heshka S, Heymsfield SB. Lifestyle behaviors associated with lower risk of having the metabolic syndrome.
Metabolism 2004;53:1503-11.
2. Hoffmann IS, Cubeddu LX. Salt and the metabolic syndrome. Nutr Metab Cardiovasc Dis 2009;19:123-8.
3. Shaw JE, Sicree RA, Zimmet PZ. Global estimates of the prevalence of diabetes for 2010 and 2030. Diabetes Res Clin Pract 2010;87:4-14.
4. Lim S, Shin H, Song JH, Kwak SH, Kang SM, Won Yoon J, Choi SH, Cho SI, Park KS, Lee HK, Jang HC, Koh KK. Increasing prevalence of metabolic syndrome in Korea: the Korean National Health and Nutrition Examination Survey for 1998-2007. Diabetes Care 2011;34:1323-8.
5. Tran BT, Jeong BY, Oh JK. The prevalence trend of metabolic syndrome and its components and risk factors in Korean adults:
results from the Korean National Health and Nutrition Examination Survey 2008-2013. BMC Public Health 2017;17:71.
6. Korea Insurance Research Institute. KIRI Research Report.
Strengthening the protection of national health insurance through efficient expenditure of medical expenses [Internet]. Seoul: Korea Insurance Research Institute; 2017 [cited 2018 April 10]. Available from: http://www.kiri.or.kr/html/reportList.asp?part=report.
7. Danesh J, Wheeler JG, Hirschfield GM, Eda S, Eiriksdottir G, Rumley A, Lowe GD, Pepys MB, Gudnason V. C-reactive protein and other circulating markers of inflammation in the prediction of coronary heart disease. N Engl J Med 2004;350:1387-97.
8. Pearson TA, Mensah GA, Alexander RW, Anderson JL, Cannon RO
3rd, Criqui M, Fadl YY, Fortmann SP, Hong Y, Myers GL, Rifai N, Smith SC Jr, Taubert K, Tracy RP, Vinicor F; Centers for Disease Control and Prevention; American Heart Association. Markers of inflammation and cardiovascular disease: application to clinical and public health practice: a statement for healthcare professionals from the Centers for Disease Control and Prevention and the American Heart Association. Circulation 2003;107:499-511.
9. Kitabchi AE, McDaniel KA, Wan JY, Tylavsky FA, Jacovino CA, Sands CW, Nyenwe EA, Stentz FB. Effects of high-protein versus high- carbohydrate diets on markers of β-cell function, oxidative stress, lipid peroxidation, proinflammatory cytokines, and adipokines in obese, premenopausal women without diabetes: a randomized controlled trial. Diabetes Care 2013;36:1919-25.
10. Ferrucci L, Cherubini A, Bandinelli S, Bartali B, Corsi A, Lauretani F, Martin A, Andres-Lacueva C, Senin U, Guralnik JM. Relationship of plasma polyunsaturated fatty acids to circulating inflammatory markers. J Clin Endocrinol Metab 2006;91:439-46.
11. Ma Y, Griffith JA, Chasan-Taber L, Olendzki BC, Jackson E, Stanek EJ 3rd, Li W, Pagoto SL, Hafner AR, Ockene IS. Association between dietary fiber and serum C-reactive protein. Am J Clin Nutr 2006;83:760-6.
12. Bertran N, Camps J, Fernandez-Ballart J, Arija V, Ferre N, Tous M, Simo D, Murphy MM, Vilella E, Joven J. Diet and lifestyle are associated with serum C-reactive protein concentrations in a population-based study. J Lab Clin Med 2005;145:41-6.
13. Wannamethee SG, Lowe GD, Rumley A, Bruckdorfer KR, Whincup PH. Associations of vitamin C status, fruit and vegetable intakes, and markers of inflammation and hemostasis. Am J Clin Nutr 2006;83:567-74.
14. Esmaillzadeh A, Kimiagar M, Mehrabi Y, Azadbakht L, Hu FB, Willett WC. Fruit and vegetable intakes, C-reactive protein, and the metabolic syndrome. Am J Clin Nutr 2006;84:1489-97.
15. Lutsey PL, Jacobs DR Jr, Kori S, Mayer-Davis E, Shea S, Steffen LM, Szklo M, Tracy R. Whole grain intake and its cross-sectional association with obesity, insulin resistance, inflammation, diabetes and subclinical CVD: the MESA study. Br J Nutr 2007;98:397-405.
16. Esposito K, Marfella R, Ciotola M, Di Palo C, Giugliano F, Giugliano G, D'Armiento M, D'Andrea F, Giugliano D. Effect of a mediterranean-style diet on endothelial dysfunction and markers of vascular inflammation in the metabolic syndrome: a randomized trial. JAMA 2004;292:1440-6.
17. Johansson-Persson A, Ulmius M, Cloetens L, Karhu T, Herzig KH, Onning G. A high intake of dietary fiber influences C-reactive protein and fibrinogen, but not glucose and lipid metabolism, in mildly hypercholesterolemic subjects. Eur J Nutr 2014;53:39-48.
18. Shivappa N, Steck SE, Hurley TG, Hussey JR, Hébert JR. Designing and developing a literature-derived, population-based dietary inflammatory index. Public Health Nutr 2014;17:1689-96.
19. Shivappa N, Steck SE, Hussey JR, Ma Y, Hebert JR. Inflammatory potential of diet and all-cause, cardiovascular, and cancer mortality in National Health and Nutrition Examination Survey III Study. Eur J Nutr 2017;56:683-92.
20. Kim M, Sohn C. Analysis of dietary inflammatory index of metabolic syndrome in Korean: data from the health examinee cohort (2012-2014). Korean J Hum Ecol 2016;25:823-34.
21. Garcia-Arellano A, Ramallal R, Ruiz-Canela M, Salas-Salvadó J, Corella D, Shivappa N, Schröder H, Hébert JR, Ros E, Gómez-Garcia E, Estruch R, Lapetra J, Arós F, Fiol M, Serra-Majem L, Pintó X, Babio
N, González JI, Fitó M, Martínez JA, Martínez-González MA;
Predimed Investigators. Dietary inflammatory index and incidence of cardiovascular disease in the PREDIMED study. Nutrients 2015;7:4124-38.
22. Ramallal R, Toledo E, Martínez-González MA, Hernández-Hernández A, García-Arellano A, Shivappa N, Hébert JR, Ruiz-Canela M. Dietary inflammatory index and incidence of cardiovascular disease in the SUN Cohort. PLoS One 2015;10:e0135221.
23. Neufcourt L, Assmann KE, Fezeu LK, Touvier M, Graffouillère L, Shivappa N, Hébert JR, Wirth MD, Hercberg S, Galan P, Julia C, Kesse-Guyot E. Prospective association between the dietary inflammatory index and cardiovascular diseases in the SUpplémen- tation en VItamines et Minéraux AntioXydants (SU.VI.MAX) cohort.
J Am Heart Assoc 2016;5:e002735.
24. Tabung FK, Smith-Warner SA, Chavarro JE, Wu K, Fuchs CS, Hu FB, Chan AT, Willett WC, Giovannucci EL. Development and validation of an empirical dietary inflammatory index. J Nutr 2016;146:1560-70.
25. Na W, Kim M, Park S, Lee M, Sohn C. Development and validation of Korean Inflammtory Index (K-DII) for metabolic disease patients:
by using the Health Examinee Cohort (2012-2014). Korean J Hum Ecol 2017;26:369-81.
26. Kim Y, Han BG; KoGES group. Cohort Profile: the Korean Genome and Epidemiology Study (KoGES) Consortium. Int J Epidemiol 2017;46:1350.
27. Vainio H, Bianchini F. IARC Handbooks of Cancer Prevention, Volume 8. Fruit and Vegetables. Lyon: IARC Press; 2003.
28. Linseisen J, Kesse E, Slimani N, Bueno-De-Mesquita HB, Ocké MC, Skeie G, Kumle M, Dorronsoro Iraeta M, Morote Gómez P, Janzon L, Stattin P, Welch AA, Spencer EA, Overvad K, Tjønneland A, Clavel-Chapelon F, Miller AB, Klipstein-Grobusch K, Lagiou P, Kalapothaki V, Masala G, Giurdanella MC, Norat T, Riboli E. Meat consumption in the European Prospective Investigation into Cancer and Nutrition (EPIC) cohorts: results from 24-hour dietary recalls.
Public Health Nutr 2002;5:1243-58.
29. Grundy SM, Cleeman JI, Daniels SR, Donato KA, Eckel RH, Franklin BA, Gordon DJ, Krauss RM, Savage PJ, Smith SC Jr, Spertus JA, Costa F; American Heart Association; National Heart, Lung, and Blood Institute. Diagnosis and management of the metabolic syndrome:
an American Heart Association/National Heart, Lung, and Blood Institute Scientific Statement. Circulation 2005;112:2735-52.
30. Oliveira A, Rodríguez-Artalejo F, Lopes C. The association of fruits, vegetables, antioxidant vitamins and fibre intake with high- sensitivity C-reactive protein: sex and body mass index interactions.
Eur J Clin Nutr 2009;63:1345-52.
31. Chun OK, Chung SJ, Claycombe KJ, Song WO. Serum C-reactive protein concentrations are inversely associated with dietary flavonoid intake in U.S. adults. J Nutr 2008;138:753-60.
32. Esmaillzadeh A, Azadbakht L. Legume consumption is inversely associated with serum concentrations of adhesion molecules and inflammatory biomarkers among Iranian women. J Nutr 2012;
142:334-9.
33. Bonaccio M, Di Castelnuovo A, De Curtis A, Costanzo S, Bracone F, Persichillo M, Donati MB, de Gaetano G, Iacoviello L; Moli-sani Project investigators. Nut consumption is inversely associated with both cancer and total mortality in a Mediterranean population:
prospective results from the Moli-sani study. Br J Nutr 2015;114:804-11.
34. Yu Z, Malik VS, Keum N, Hu FB, Giovannucci EL, Stampfer MJ, Willett
WC, Fuchs CS, Bao Y. Associations between nut consumption and inflammatory biomarkers. Am J Clin Nutr 2016;104:722-8.
35. Zuñiga YL, Rebello SA, Oi PL, Zheng H, Lee J, Tai ES, Van Dam RM. Rice and noodle consumption is associated with insulin resistance and hyperglycaemia in an Asian population. Br J Nutr 2014;111:1118-28.
36. Yamashita K, Yatsuya H, Muramatsu T, Toyoshima H, Murohara T, Tamakoshi K. Association of coffee consumption with serum adiponectin, leptin, inflammation and metabolic markers in Japanese workers: a cross-sectional study. Nutr Diabetes 2012;2:e33.
37. Je Y, Jeong S, Park T. Coffee consumption patterns in Korean adults:
the Korean National Health and Nutrition Examination Survey (2001-2011). Asia Pac J Clin Nutr 2014;23:691-702.
38. Shon JK. The effect of cognition at regional area on image, attitude
& intention of behavior - focus on Korea food consumer behavior.
J Foodserv Manag 2011;14:321-36.
39. Kim WY, Kim JE, Choi YJ, Huh KB. Nutritional risk and metabolic syndrome in Korean type 2 diabetes mellitus. Asia Pac J Clin Nutr 2008;17 Suppl 1:47-51.
40. Song SJ, Lee JE, Paik HY, Park MS, Song YJ. Dietary patterns based on carbohydrate nutrition are associated with the risk for diabetes and dyslipidemia. Nutr Res Pract 2012;6:349-56.
41. Ghayour-Mobarhan M, Yaghootkar H, Lanham-New SA, Lamb DJ, Ferns GA. Association between serum CRP concentrations with
dietary intake in healthy and dyslipidaemic patients. Asia Pac J Clin Nutr 2007;16:262-8.
42. Kim M, Kim J, Bae W, Kim S, Lee Y, Na W, Sohn C. Relationship between nutrients intakes, dietary quality, and serum concentrations of inflammatory markers in metabolic syndrome patients. Korean J Community Nutr 2011;16:51-61.
43. Ridker PM, Buring JE, Cook NR, Rifai N. C-reactive protein, the metabolic syndrome, and risk of incident cardiovascular events: an 8-year follow-up of 14 719 initially healthy American women.
Circulation 2003;107:391-7.
44. Santos AC, Lopes C, Guimarães JT, Barros H. Central obesity as a major determinant of increased high-sensitivity C-reactive protein in metabolic syndrome. Int J Obes 2005;29:1452-6.
45. Indulekha K, Surendar J, Mohan V. High sensitivity C-reactive protein, tumor necrosis factor-α, interleukin-6, and vascular cell adhesion molecule-1 levels in Asian Indians with metabolic syndrome and insulin resistance (CURES-105). J Diabetes Sci Technol 2011;
5:982-8.
46. Vu JD, Vu JB, Pio JR, Malik S, Franklin SS, Chen RS, Wong ND. Impact of C-reactive protein on the likelihood of peripheral arterial disease in United States adults with the metabolic syndrome, diabetes mellitus, and preexisting cardiovascular disease. Am J Cardiol 2005;96:655-8.