회원학술보고
약물부작용 감시정보시스템의 도입과 평가: pilot study
황수희, 김은영, 이용석, 정선영, 이영미, 손기호, 최경업*, 이숙향**, 김윤***
삼성서울병원 약제부, CJ 제약사업부
*, 숙명여자대학교 임상약학대학원
**, 서울대학교 의과대학 예방의학교실
***Implementation and Evaluation of the
Computerized Surveillance System to Identify Adverse Drug Events: pilot study
Soo Hee Hwang, Eun Young Kim, Yong Seok Lee, Seon Young Chung, Young Mi Lee, Kie Ho Sohn, Kyung Eob Choi*, Suk Hyang Lee**, and Yoon Kim***
Div. of Pharmaceutical Services, Samsung Medical Center, Pharmaceutical Division, CJ Corporation* , Graduate School of Clinical Pharmacy, Sookmyung Women's Univ.**, and College of Medicine, Seoul National Univ.***
Abstract : A computerized surveillance system is the most recent tool to monitor, identify and pre- vent ADEs, based on alerts generated by matching signals such as abnormal lab data with elec- tronic medical records (EMRs). Since this system has been proven to be simple and cost-effective in detecting ADEs, there is a growing trend towards routine application. The objectives of this study were to implement the system in Samsung Medical Center (SMC), a 1300-bed tertiary hos- pital, and evaluate its applicability and validity in terms of sensitivity, specificity, positive pre- dictive value (PPV), and negative predictive value (NPV).
The retrospective analysis was performed using 1-month EMRs in 598 discharged patients from 2 ICUs and 5 general wards. Alerts as potential indicators of ADEs were generated by this system using our modified signals. Patient charts were carefully reviewed by clinical pharmacists to detect ADEs and to verify whether these ADEs were also recognized by the signals.
A total of 718 alerts were generated by the system and 187 ADEs were detected by chart review.
One hundred forty eight alerts were found to be associated with ADEs. The sensitivity of the
modified signals for identifying ADEs was estimated to be 79.1 (95% confidence interval [CI],
73.3~85.0) percent, and the estimated specificity was 29.2 (95% CI, 26.1~32.3) percent. The PPV
and the NPV were 20.6 (95% CI, 17.7~23.6) percent and 85.8 (95% CI, 81.6~89.9) percent, respec-
Introduction
Medical therapy occasionally results in a number of adverse events which are unin- tended injuries or complications.
1, 2)The most common adverse events in hospitalized patients are those attributable to medication use,
3,4)which account for up to 20% of all adverse events.
3~5)Several studies
6,7)in the U.S. showed adverse drug events (ADEs) have contributed to the additional length of hospi- tal stay (1.7~2.2 days longer) and the increase in medical cost ($ 2,000~$ 3,200 more).
Many attempts to reduce the incidence rates and severity of these ADEs have been carried out for decades. There are three categories of ADE surveillance models, including voluntary reporting, chart review, and computerized screening.
8, 9)Voluntary reporting is the tra- ditional ADE detecting method, but it has low detection rates. Chart review produces high detection rates of ADEs, but its expense makes it impractical for ongoing quality monitoring in hospitals.
10, 11)Computerized screening has been proven to have high detection rates and low costs and there is a growing trend towards routine applica- tion.
12~14)Computerized surveillance system
(CSS), a computer-based screening method, generates alerts by matching signals such as abnormal laboratory data, drug level, and use of emergency medicine with electronic med- ical records (EMRs). Based on these signals, ADEs would be verified by trained personnel such as physician, nurse, and pharmacist.
15,16)
In Korea,
17)voluntary reporting was first initiated as an ADE surveillance method at 376 medical institutions which had been des- ignated by the Korean Food and Drug Administration in 1988 and expanded to 4,073 institutions in 1997. However, the number of reported ADEs was only 5 cases in 1988 and maximized to 79 cases per year in 1999. To encourage health professionals to report more ADE cases, ADE monitoring sys- tem linked with 17 hospitals has been in force since 1998. Although continuous efforts to monitor ADEs have been made, the expected results were not achieved. Under these cir- cumstances, a new ADE surveillance method has been desperately needed and the CSS was thought of a resolution.
In order to successfully implement the CSS in Samsung Medical Center (SMC), a retro- spective pilot study was performed with fol- lowing objectives; to evaluate its applicability tively.
Our computerized surveillance system showed that the sensitivity value was higher (79.1% vs. ca 50%) and the specificity was lower (29.2% vs. ca 70~80%) than those reported in the literature. It would be necessary to further modify the signals to improve the specificity and rate of ADE detection. More studies will be needed to confirm the usefulness and cost-effectiveness of this system.
[Keyword] adverse drug events (ADEs), computerized surveillance system, signal
and validity and to classify the identified ADEs according to the severity, causality, preventability, mechanism, etc.
Methods
1. Setting
SMC is a 1300-bed, private, tertiary care hospital and a major teaching center affiliat- ed with the Sungkyunkwan University School of Medicine. Its internally developed hospital information system, the Samsung Medical Information System (SMIS), includes many diverse types of data, such as basic patient information (e.g., name, address, and so forth), diagnostic information, physicians' orders, medication profiles, vital signs, intake/output, and physiological measure- ments, diet information, event reports, nurs- ing notes, care plans, discharge plans, etc.
2. Patients
Patients discharged from seven units over a one-month in February 2004 were eligible for study enrollment. These units included two intensive care units (one medical and one surgical) and five general care units (three medical and two surgical). In order to evalu- ate as many ADEs as possible, we selected these units in which many alerts were gener- ated by the CSS. We excluded those patients who belonged to the departments of obstet- rics, pediatrics, psychiatrics, and hemato- oncology. Patients were divided into two groups; signal group (signal-recognized patients by the CSS) and control group (sig- nal-unrecognized patients). The study was approved by the institutional review board in SMC.
3. Definition of ADE
Instead of using the adverse drug reaction (ADR) by WHO that is “noxious and unin- tended, and occurs at doses used in man for prophylaxis, diagnosis or therapy” ,
18)our study adopted the term ADE by Bates et al.
19)It defined as “an injury resulting from med- ical intervention related to a drug” . Because it includes unintended results from not only appropriate use of drugs but also error in their use, it is more comprehensive and clini- cally significant than the ADR.
19)These wide- ly accepted definitions have been used in many other studies evaluating medication safety.
4. Development of signals for the CSS and chart review
The signals used in this study were based on four different protocols developed by LDS Hospital (in Salt Lake City, affiliated with the University of Utah School of Medicine) study,
20)Brigham and Women's Hospital (in Boston, affiliated with the Harvard Medical School) study,
11,21)Veterans Health Administration (VHA) Research (2002 series),
22)and study of Raschke et al.
23)in Arizona. Signals as potential indicators of ADEs consisted of abnormal laboratory data, elevated or dropped serum drug levels, orders for antidote or emergency medicine, and diagnosis codes. Six physicians in the area of internal medicine, dermatology, and infec- tious disease were asked to modify these sig- nals to reflect korean clinical status. A total of 46 signals were used in this study and the rationales for use of each signal were shown the Appendix 1, 2.
The subjects of this study were screened by
the CSS, which generated signal-recognized
Category Signals
Laboratory test ★ ALP 350 U/L not diagnosis of gastrointestinal bleeding, peritonitis, pancreatitis, bone cancer, post transplantation
★ ALT 150 U/L not diagnosis of liver disease, hepatitis, cholecystitis, liver/pancreatic cancer
★ APTT 6×hospital's upper limits not diagnosis of sepsis, liver disease, hepatitis, antiphospholipid syndrome
★ AST 150 U/L not diagnosis of liver disease, hepatitis, cholecystitis, liver/pancreatic cancer
★ Bilirubin, total 10 mg/dL not diagnosis of liver disease, hepatitis, cholecystitis, liver cancer, pancreatic cancer
★ BUN 50 mg/dL not diagnosis of renal failure
★ Clostridium difficile (positive)
★ Creatinine clearance 50 ml/min and receiving “nephrotoxic drugs”
not diagnosis of renal failure
★ Glucose, fasting 50 mg/dL
★ Glucose, fasting 350 mg/dL and diagnosis of diabetes with ketosis or coma
★ INR 3.5 not diagnosis of sepsis, liver disease, hepatitis, antiphospholipid syndrome
★ Platelet count, blood 50×10³ /㎕ not diagnosis of anemia, Hodgkins' disease, leukemia, sepsis, thrombocytopenia
★ Serum creatinine ≥ 1.0 mg/dL over admission baseline and receiving “nephrotoxic drugs”
★ Serum potassium 6.0 mmol/L not diagnosis of gastrointestinal bleeding, renal failure, sepsis, myocardiac infarction
★ WBC count, blood 3×10³ /㎕ not diagnosis of anemia, Hodgkins' disease, leukemia, sepsis
Drug ★ Serum amikacin peak 25 mg/L or trough 10 mg/L concentration ★ Serum carbamazepine 10 mg/L
★ Serum cyclosporine 500 ㎍/L
★ Serum digoxin 2.0 ㎍/L
★ Serum gentamicin peak 10 mg/L or trough 2 mg/L
★ Serum phenobarbital 45 mg/L
★ Serum phenytoin 20 mg/L
★ Serum tacrolimus (FK506) > 30 ㎍/L
★ Serum theophylline 20 mg/L
★ Serum tobramycin peak 10 mg/L or trough 2 mg/L
★ Serum valproic acid 100 mg/L
★ Serum vancomycin peak 40 mg/L or trough 10 mg/L
Appendix 1. Signals for the ADE monitoring
cases. To determine whether an ADE was present in a specific computer-recognized or computer-unrecognized case, chart review was performed. Trained pharmacist reviewed
those cases using patient's data, including the medication profiles, laboratory values, and the notes of several days before and after the incident. Only one pharmacist was Appendix 1. Signals for the ADE monitoring (continued)
Category Signals
Medication ★ Receiving Alteplase not diagnosis of myocardiac infarction
★ Receiving Anti-emetics not biopsy, bronchoscopy, esophagogastroscopy, gastroscopy, post-operation
★ Receiving Anti-diarrheals not diagnosis of Chron's disease, intestinal infectious disease, irritable bowel syndrome
★ Receiving Anti-histamine not diagnosis of dermatitis, diseases of the respiratory system, erythema, urticaria
★ Receiving Anti-ulcer drugs and platelet count, blood has fallen to less than 50% previous value not diagnosis of ulcer
★ Receiving Atropine sulfate not in operation
★ Receiving Benztropine mesylate not diagnosis of Parkinson's disease
★ Receiving Dextrose 50% in water and glucose, fasting < 70 mg/dL
★ Receiving Epinephrine not in operation and receiving with corticosteroids
★ Receiving Flumazenil
★ Receiving Hydrocortisone not order of Hydrocortisone within last 7 days, post-transplantation, autoimmune disease
★ Receiving Methylprednisolone not order of Methylprednisolone within last 7 days, post-transplantation, autoimmune disease
★ Receiving Naloxone
★ Receiving Vancomycin (oral)
★ Receiving Polystyrene sulfonate calcium not diagnosis of renal failure
★ Receiving Protamine sulfate
★ Receiving Topical steroid not diagnosis of dermatitis, erythema, urticaria
★ Receiving Vitamin K not diagnosis of leukemia, liver disease, gastrointestinal bleeding and order of warfarin within last 14 days Diagnosis code ★ Receiving ICD-10 code in chief complain or diagnosis code : Y40-Y59, D52.1, D59.0, D59.2, D61.1, D64.2, K71.0-K71.9,
L23.3, L24.4, L25.1, L27.0, L27.1, L43.2, T36-T50.9, T78.2
Signal Rationale Laboratory test ALP, ALT, AST
Hepatotoxicity related with drugs Total bilirubin
APTT Over-anticoagulation with heparin
BUN, Creatinine
Renal dysfunction related with drugs Creatinine clearanc
Clostridium difficile Gastrointestinal toxicity related with antibiotics use Glucose, fasting Hypoglycemia related with anti-DM agent
Hyperglycemia related with drugs Platelet count, blood Thrombocytopenia related with drugs Potassium Hyperkalemia related with drugs PT (INR) Over-anticoagulation with warfarin WBC count, blood Neutropenia related with drugs
Drug concentration
Amikacin Nephrotoxicity, neuromuscular toxicity, ototoxicity Carbamazepine Ataxia, dizziness, nystagmus
Cyclosporine Hepatotoxicity, nausea, nephrotoxicity, vomiting, tremor Digoxin Arrythmia, bradycardia, nausea, vomiting
Gentamicin Nephrotoxicity, neuromuscular toxicity, ototoxicity
Phenobarbital Arrythmia, hypotension, pain or thrombotic phlebitis at IV infusion
Phenytoin Ataxia, diplopia, nystagmus
Tacrolimus (FK506) Ascites, hepatotoxicity, hyperglycemia, nephrotoxicity Theophylline Diarrhea, headache, insomnia, nausea, vomiting Tobramycin Nephrotoxicity, neuromuscular toxicity, ototoxicity Valproic acid Diarrhea, menstrual cycle change, nausea, vomiting Vancomycin Nephrotoxicity, ototoxicity
Medication
Alteplase Emergency medicine for anticoagulation by use of hemostatics Anti-emetics Nausea/emesis related with drugs
Anti-diarrheals Diarrhea related with drugs or due to Clostridium difficile Anti-histamines Counteract to allergic reactions related with drugs Anti-ulcers Gastrointestinal bleeding due to drugs
Atropine sulfate Antidote to cholinergic agents
Benztropine mesylate Counteract to extrapyramidal effects related with drugs
Dextrose 50% in water Counteract to hypoglycemia related with drugs
Appendix 2. Rationales for use of each signal
involved with chart review to leave inter- personal disagreement, and requested con- sultations to clinical pharmacy specialist and clinical pharmacologist in ambiguous cases.
Finally, verification of ADEs was determined whether there was a causal relation between events with medication. For identification of ADEs, Micromedex, Medline 1966~1997, Meyler's Side Effect of Drugs (14th edition, Elseveir, 2000),
24)and our own Drug Information database were used.
After verified by the pharmacist, the ADEs characterized in terms of severity, causality assessment, preventability, type of ADEs, drug class causing ADEs, and related clinical symptom.
The severity of identified ADEs was classi- fied according to the two different models, that were National Coordinating Council for Medication Error Reporting and Prevention (NCC MERP) Index
25)and LDS scale.
7)NCC MERP Index was divided into 9 cate- gories from A to I. We used category D to I and explanation of each category was depict-
ed in Appendix 3. Although NCC MERP Index especially included relationship between error and harm, we used these categories with a concept of weakened ` ‘error’ .
LDS scale was divided into 3 categories;
'Mild' is in no change in therapy, treatment, and length of stay (LOS), 'moderate' is in requiring change in drug therapy or treat- ment, temporary alteration in organ func- tion, and increasing LOS under 2 days, and 'severe' is in life-threatening, permanent organ damage and increasing LOS over 2 days.
We used the Naranjo algorithm
26)to assess causality probability between ADEs and spe- cific medication use. The Naranjo algorithm computes a weighted score based on answers to a short, standardized questionnaire that correlates with causality probability (Appendix 4). Based on the calculated total scores, the ADEs were categorized as doubt- ful (total score 1), 'possible' (1~4), 'probable' (5~8), and 'definite' ( 9).
Once the severity and causality were Appendix 2. Rationales for use of each signal (continued)
Signal Rationale
Epinephrine Emergency medicine for cardiac arrest or shock due to drugs Flumazenil Emergency medicine for over-sedation with benzodiazepine
Haloperidol Drug-induced psychosis
Hydrocortisone Anaphylactic shock or asthma due to drugs Methyprednisolone Anaphylactic shock or asthma due to drugs Naloxone Antidote for over-sedation related with narcotics
Polystyrene sulfonate Potassium toxicity or worsening renal function due to drugs Protamine sulfate Over-anticoagulation with heparin
Topical steroid Counteract to allergic reaction p.o. Vancomycin Counteract to Clostridium difficile Vitamin K Over-anticoagulation with warfarin
Diagnosis code
ICD-10 code Specific diagnosis code which meant ADEs
assigned, the preventability of ADEs was assessed using Shumock and Thornton's cri- teria
27)which contains 7 questions (Appendix 5). At least if one of them met the criteria, such ADEs were considered to be 'preventa- ble'. For the further evaluation of ADEs, they were characterized as 'Type A' and 'Type B' by the mechanism of action. While 'Type A' reactions are the most common of all ADEs and are related to the drug's pharmacology and/or dosage, 'Type B' reactions are idiosyn- cratic, unpredictable, and are not dose- dependent or related to the drug's pharma- cology. The patterns of ADE occurrence were determined in related to specific drugs and
symptoms.
5. Statistical analysis
Descriptive statistics was used to calculate outcome rates as frequency and percentage (incidents per 100 cases). The reliability of this system was evaluated in terms of sensi- tivity (true positive rate), specificity (true negative rate), predictive positive value (PPV), and predictive negative value (PNV).
These indices were analyzed according to the number of cases presenting a signal-positive (C+) or a signal-negative (C-) test in cases verifying (D) or not verifying (D) the ADE (Appendix 6).
28)We calculated 95% confidence Appendix 3. NCC MERP Index for categorizing medication errors
No error Error, no harm Error, harm
Error, death
intervals (CIs) using the exact binomial propor- tion for one-way frequency table. All analyses
were performed using the statistical software SAS, version 8.1 (SAS Institute, Cary, NC).
Appendix 4. The Naranjo ADR probability scale
Appendix 5. The Schumock and Thornton’ s criteria
Question Yes No Don't know
1. Are there previous conclusive reports on this reaction? 1 0 0 2. Did the adverse event appear after the suspected drug
was administered? 2 -1 0
3. Did the adverse event improve when the drug was
discontinued or a specific antagonist was administered? 1 0 0 4. Did the adverse event reappear when the drug was
re-administered? 2 -1 0
5. Are there alternative causes (other than the drug) that
could on their own have caused reaction? -1 2 0
6. Did the reaction reappear when a placebo was given? -1 1 0 7. Was the drug detected in the blood (or other fluids)
in concentration known to be toxic? 1 0 0
8. Was the drug detected in the blood (or other fluids)
increased, or less severe when the dose was decreased? 1 0 0 9. Did the patient have a similar reaction to similar drugs
in any previous exposure? 1 0 0
10. Was the adverse event confirmed by any objective
evidence? 1 0 0
Based on the calculated total scores, the ADEs were categorized as doubtful (total score 1), possible (1~4), probable (5~8), and definite ( 9).
Question
1. Was the drug involved in the ADE not considered appropriate for the patient's clinical condition?
2. Was the dose, route, and frequency of administration not appropriate for the patient's age, weight and disease state?
3. Was required therapeutic drug monitoring or other necessary lab test not performed?
4. Was there a history of allergy or previous reactions to the drug?
5. Was a drug interaction involved in the reaction?
6. Was a toxic serum drug concentration documented?
7. Was poor compliance involved in the reaction?
At least if one or more of them met the criteria, such ADEs were considered to be preventable.
Results
1. Characteristics of the patients
A total number of 3,494 patients were dis- charged from SMC during the study period and our study included 598 patients (17.1%). The number of patients of the signal group and the control group were 342 and 256, respectively.
Their patients-days were 6,578 days and mean LOS was 11 days (range 1~334 days). For the signal group, 63.7% of patients were male and the mean age was 55.1 ± 16.0 (mean ± SD) years. Of the control group, 152 (59.4%) were male and the mean age was 52.4 ± 16.7 years (Table 1). The number of patients in medical units and surgical units were 427 (71.4%) and
Total by rows
TP + FP Total criteria positive (C +)
FN +TN Total criteria negative (C -)
Total by column
True positives (TP) are ADR with positive criterion True negatives (TN) are not ADR with negative criterion False positives (FP) are not ADR with positive criterion False negatives (FN) are ADR with negative criterion
Sensitivity: Specificity:
Predictive value positive: Predictive value negative:
Appendix 6. The weightings of criteria
28)Criteria results
Disease
C + TP
C -
FP
FN TN
D D
TP + FN Total cases rated as ADR (D)
FP +TN Total cases rated as not ADR (D)
Se = TP =
TP+FN
(C+∩D)
D Sp = TN =
FP+TN
(C-∩D) D
PVP = TP =
TP+FP
(C+∩D)
(C+) PVN = TN =
(FN+TN)
(C-∩D)
(C-)
171 (28.6%), respectively.
2. Frequency of cases and ADEs
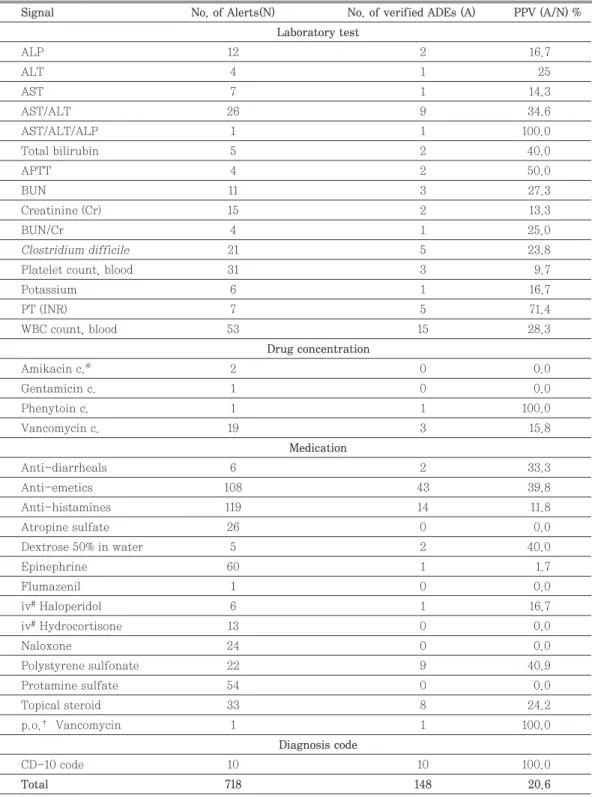
In the signal group (n=342), 718 alerts were identified by the CSS using 46 signals (Table 2). Therefore, the ratio of signal-recognized cases to patient was approximately 2.1 : 1.
Through the record review procedure by clin- ical pharmacist, 148 signal-related ADEs were detected in 99 patients (mean 1.5 cases per patient, range, 1~5 cases). And the num- ber of signal-unrelated ADEs was 18 cases(Fig. 1). Among the cases, 104 (70.3%) cases were due to medication use during hos- pitalization and the rest cases (41; admission because of ADEs, 3; admission with ADEs) were those attributable to medication used before admission. Thus, the rate of ADEs were estimated to be 24.7 cases per 100 dis- charged patients or 22.5 cases per 1,000 patient-days by the CSS.
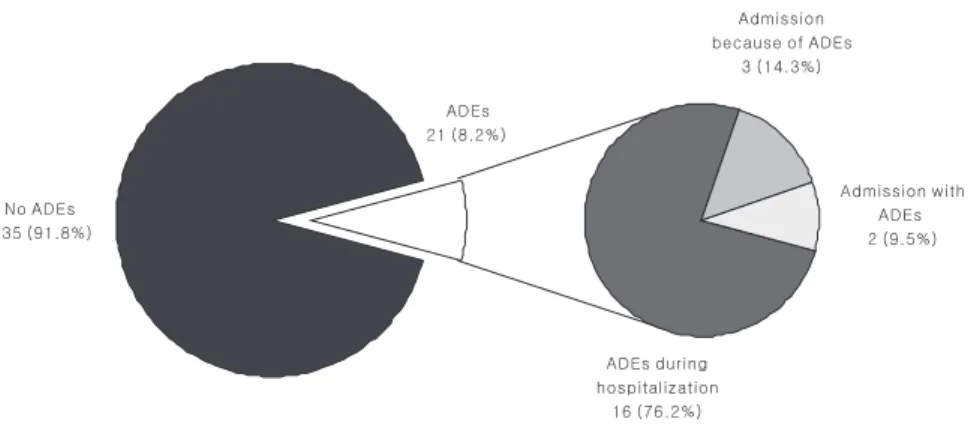
In the control group (n=256), 21 cases were
identified as ADEs by the chart review(Fig.
2). Among these cases, 16 (76.2%) cases were ADEs caused by medication during hospital- ization and the remained 5 (23.8%) cases (3;
admission because of ADEs, 2; admission with ADEs) were those attributable to med- ication used before admission.
The total crude ADE rate in the signal group and the control group was 31.3 cases per 100 discharged patients or 28.4 cases per 1,000 patients-days.
3. Assessment of performance character- istics of the CSS and the PPV of each sig- nal
As shown the Table 3, the sensitivity of the CSS for identifying ADEs was calculated to be 79.1% (95% CI, 73.3~85.0) and the speci- ficity was 29.2% (95% CI, 26.1~32.3). The PPV was computed to be 20.6% (95% CI, 17.7~23.6), and the NPV was 85.8% (95% CI, 81.6~89.6).
Signal group Control group
No.(%) No.(%)
No. of Patients 342 (57.2) 256 (42.8)
Gender Male Female Male Female
218 (63.7) 124 (36.3) 152 (59.4) 104 (40.6)
Age(yrs)* 55.1 ± 16.0 (16~91) 52.4 ± 16.7 (17~86)
21 6(1.8) 9(3.5)
21~30 19(5.6) 25(9.8)
31~40 29(8.5) 26(10.2)
41~50 71(20.8) 49(19.1)
51~60 80(23.4) 60(23.4)
61~70 89(26.0) 47(18.4)
71~80 34(9.9) 35(13.7)
80 14(4.1) 5(2.0)
* Age are expressed as mean (years) ± SD
Table 1. Demographic data
Table 2. Generation of alerts and positive predictive value of each signals
Signal No. of Alerts(N) No. of verified ADEs (A) PPV (A/N) %
Laboratory test
ALP 12 2 16.7
ALT 4 1 25
AST 7 1 14.3
AST/ALT 26 9 34.6
AST/ALT/ALP 1 1 100.0
Total bilirubin 5 2 40.0
APTT 4 2 50.0
BUN 11 3 27.3
Creatinine (Cr) 15 2 13.3
BUN/Cr 4 1 25.0
Clostridium difficile 21 5 23.8
Platelet count, blood 31 3 9.7
Potassium 6 1 16.7
PT (INR) 7 5 71.4
WBC count, blood 53 15 28.3
Drug concentration
Amikacin c.* 2 0 0.0
Gentamicin c. 1 0 0.0
Phenytoin c. 1 1 100.0
Vancomycin c. 19 3 15.8
Medication
Anti-diarrheals 6 2 33.3
Anti-emetics 108 43 39.8
Anti-histamines 119 14 11.8
Atropine sulfate 26 0 0.0
Dextrose 50% in water 5 2 40.0
Epinephrine 60 1 1.7
Flumazenil 1 0 0.0
iv
#Haloperidol 6 1 16.7
iv
#Hydrocortisone 13 0 0.0
Naloxone 24 0 0.0
Polystyrene sulfonate 22 9 40.9
Protamine sulfate 54 0 0.0
Topical steroid 33 8 24.2
p.o.
†Vancomycin 1 1 100.0
Diagnosis code
CD-10 code 10 10 100.0
Total 718 148 20.6
* c.; concentration (peak or trough),
#iv; Intravenous,
†p.o.; per os
Although the mean PPV of all the signals CSS was 20.6%, each signal had a variable PPV range of 0 to 100% (Table 3). Some sig- nals such as serum phenytoin concentration, order of oral vancomycin, diagnosis code, and AST/ALT/ALP represented the highest PPV (100%). In liver enzyme signals, the higher PPV was obtained with combined signals (e.g., AST/ALT, AST/ALT/ALP) than single one (e.g., AST, ALT, and ALP). On the other hand, signals such as order of iv atropine, iv hydrocortisone, naloxone generated 26, 13, and 24 cases, respectively, but no case was
revealed as true ADEs (PPV 0%). Signals of decrease in platelet count and order of epi- nephrine also had low PPV's (9.7% and 1.7%, respectively).
4. Characteristics of the verified ADEs by the CSS
1) The severity, causality assessment, pre- ventability and types of ADEs
Regarding the severity, no ADE caused death. Forty eight ADEs (32.4%) were in 'cat- egory F' in the application of NCC MERP Index; 90 (60.8%) were 'category E', and 10
Fig. 1 - Cases of ADE by chart review in signal group Table 3. Frequency of signals and ADEs
ADEs Total
Yes No
Signal-recognized 148
(104
*+41
#+3
†) 570 718
Signal-unrecognized 39
(34
*+2
#+3
†) 235 274
Total 187 805 992
* ADEs during hospitalization;
#Adm. because of ADEs;
†Adm. with ADEs
♧ Sensitivity = 79.1% (95% CI, 73.3 ~ 85.0) ♧ PPV = 20.6% (95% CI, 17.7 ~ 23.6)
♧ Specificity = 29.2% (95% CI, 26.1 ~ 32.3) ♧ NPV = 85.8% (95% CI, 81.6 ~ 89.9)
(6.8%) were 'category D' (Fig. 3). According to LDS scale, 5 (3.4%) were classified as 'severe', 136 (91.9%) were 'moderate', and 7 (4.7%) were 'mild'(Fig. 4).
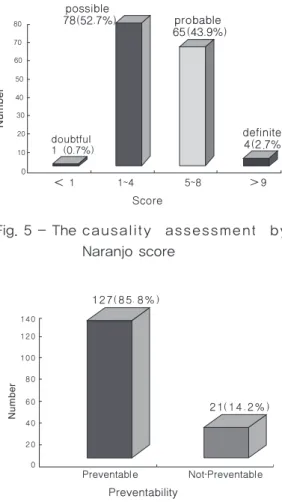
Causality assessment using the Naranjo probability algorithm showed that 4 (2.7%) cases were the ADEs established in being 'definite' causality, 65 (43.9%) were in 'proba- ble', and 78 (52.7%) were in 'possible' (Fig. 5).
Only one case was revealed that the causality between incident and use of drugs was 'doubtful'.
The preventability using Shumock and
Thornton's criteria revealed that a major portion (127/148 cases; 85.8%) was considered 'preventable'(Fig. 6).
Regarding the underlying pathomechanism of the ADEs, the number of 'Type A' and 'Type B' were 120 cases (81.1%) and 28 cases (18.9%), respectively(Fig. 7).
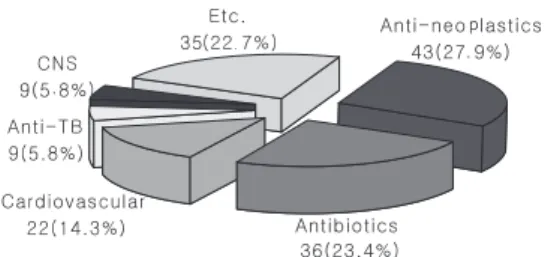
2) Drug classes causing ADEs and clinical symptoms
The drug classes implicated in the ADEs were diverse. There were about 70 different kinds of drugs involved with ADEs and they
Mild : No change in treatment, and length of stay (LOS) Moderate : Require change in drug therapy or treatment,
temporary harm, increased LOS 2 days Severe : Life-threatening , permanent organ damage,
increased LOS 2 days, death
Fig. 4 - The severity assessment in LDS scale
Fig. 2 - Cases of ADE by chart review in control group
category D : Require monitoring to confirm ADE category E : Temporary harm & require intervention category F : Temporary harm & require initial orprolonged
hospitalization
Fig. 3 - The severity assessment in NCC
MERP Index
were divided into 15 classes according to the SMC Drug Formulary classification. Some drugs causing ADEs, such as herbal medica- tion which ingredients were not known and corticosteroids which were difficult to classi- fy, were considered as the others. 43 ADEs were attributable to anti-neoplastic agents (27.9%), 36 to antibiotics (23.4%), and 22 to cardiovascular agents (14.3%)(Fig. 8). Five ADEs were caused by drug-drug interactions between two different drugs.
The clinical symptoms related with ADEs
were also variable. There were 10 symptom categories based on the ADR classification by Micromedex. Gastointestinal symptoms such as nausea and/or vomiting, diarrhea, and stomatitis were the most common manifesta- tions (48 cases; 31.8%). Hematological symp- toms including leukopenia, thrombocytope- nia, eosinophilia, and neutropenic fever were 32 cases (21.2%) and symptoms related with liver such as elevation of liver enzymes and total bilirubin were 25 cases (16.6%)(Fig. 9).
Discussion
In the present study, we implemented the CSS and retrospectively evaluated it using discharged patients from 7 units before the routine application of the CSS as a detection tool for ADEs. This study showed that the total crude ADE rate in the signal group and the control group was 31.3 cases per 100 dis- charged patients. Meanwhile the rate of ADEs by the CSS was 24.7 cases per 100 dis- Fig. 5 - The causality assessment by
Naranjo score
Type A
Extension of pharmacologic effect Often predictable and dose dependent Type B
Idiosyncratic or immunologic reactions Rare, unpredictable and dose independent