54: 71 ∼ 88, 2021 April pISSN: 1225-4614 · eISSN: 2288-890X
Published under Creative Commons license CC BY-SA 4.0 http://jkas.kas.org
E VOLUTION OF THE S PIN OF L ATE - TYPE G ALAXIES C AUSED BY
G ALAXY – GALAXY I NTERACTIONS
Jeong-Sun Hwang1,2, Changbom Park3, Soo-hyeon Nam4, and Haeun Chung5
1Department of Physics and Astronomy, Sejong University, Seoul 05006, Korea; [email protected]
2Department of Science Education, Gwangju National University of Education, Gwangju 61204, Korea
3School of Physics, Korea Institute for Advanced Study, Seoul 02455, Korea; [email protected]
4Department of Physics, Korea University, Seoul 02841, Korea; [email protected]
5University of Arizona, Steward Observatory, 933 N Cherry Ave., Tucson, AZ 85721, USA;
Received November 6, 2020; accepted March 31, 2021
Abstract: We use N -body/hydrodynamic simulations to study the evolution of the spin of a Milky Way-like galaxy through interactions. We perform a controlled experiment of co-planar galaxy-galaxy encounters and study the evolution of disk spins of interacting galaxies. Specifically, we consider cases where the late-type target galaxy encounters an equally massive companion galaxy, which has either a late or an early-type morphology, with a closest approach distance of about 50 kpc, in prograde or retrograde sense. By examining the time change of the circular velocity of the disk material of the target galaxy from each case, we find that the target galaxy tends to lose the spin through prograde collisions but hardly through retrograde collisions, regardless of the companion galaxy type. The decrease of the spin results mainly from the deflection of the orbit of the disk material by tidal disruption. Although there is some disk material which gains the circular velocity through hydrodynamic as well as gravitational interactions or by transferring material from the companion galaxy, it turns out that the amount of the material is generally insufficient to increase the overall galactic spin under the conditions we set. We find that the spin angular momentum of the target galaxy disk decreases by 15–20% after a prograde collision. We conclude that the accumulated effects of galaxy-galaxy interactions will play an important role in determining the total angular momentum of late-type galaxies.
Key words: galaxies: spiral — galaxies: kinematics and dynamics — galaxies: evolution — galaxies:
interactions — methods: numerical 1. INTRODUCTION
Understanding the spin of galaxies is important to un- derstand the evolution of galaxies over cosmic time.
Starting from the tidal torque theory (Hoyle 1949;Pee- bles 1969;White 1984), it has been proposed that galax- ies acquire angular momentum from surrounding galax- ies via tidal interactions. In the Lambda Cold Dark Matter (ΛCDM) paradigm, galaxies are first formed in dark matter (DM) halos and evolve through continu- ous merging and interacting with nearby galaxies while gaining or losing mass and angular momentum. In par- ticular, it is vital to understand how the angular mo- mentum of late-type galaxies (LTGs) evolves over cos- mic time, because the LTGs are considered the build- ing blocks in the hierarchical merging scenario. For example, the existence of a relatively new population of rotation-supported early-type galaxies (ETGs) can- not be fully explained without understanding the role of LTG spin evolution (Emsellem et al. 2011;Cappellari 2016;Graham et al. 2018).
Previous studies have shown that the spin of galax- ies is also correlated with environmental properties such as distance to the neighbor, axes of large-scale struc-
Corresponding author: J.-S. Hwang
ture, 2D correlation, and clustering (Porciani et al.
2002;Davis & Natarajan 2009;Tempel et al. 2013;Ca- suso & Beckman 2015; Codis et al. 2015; Lee et al.
2018b). More recent studies have demonstrated how the angular momentum acquired through merging can affect the galaxy evolution (Brook et al. 2012; Cloet- Osselaer et al. 2014;Rodriguez-Gomez et al. 2017).
Efforts have been made to detect correlations be- tween the spins in pairs of spiral galaxies. For example, Cervantes-Sodi et al.(2010) estimated the spin parame- ter for 3624 LTGs (target galaxies) at low redshift, iden- tified using the Sloan Digital Sky Survey (SDSS). They discovered a statistically significant correlation between the spin magnitudes of neighboring galaxies. Specifi- cally, they found that the values of the spin parameter of the late-type target galaxies decrease as a compan- ion galaxy (the nearest neighbor of a comparable size) approaches, regardless of the companion morphology, although the decrease of the spin parameter appeared more clearly when the companion is a late-type rather than an early-type (refer to their Figures 3 and 4). Par- ticularly noteworthy is that the decrease of the spin pa- rameter begins to operate as soon as the (projected) separation between the pair becomes smaller than the virial radius of the companion, implying interactions 71
Figure 1. Top two rows: Initial distributions of the disk particles of model L. The disk star and gas particles are dis- played separately in the left and right columns, respectively.
The upper and lower rows show the distribution projected on to the x–y and x–z plane, respectively. The gray scale represents the column densities of the star and gas disks.
The inner and outer dotted circles (magenta) drawn in the upper panels indicate R14and R25, respectively. Bottom two rows: Initial profiles of the circular and the radial velocities (vcand vR, respectively) of the disk particles of model L. In the upper panel, the solid and dashed curves represent the mass weighted, azimuthally averaged azimuthal velocities of the disk stars and gas particles, respectively, as function of cylindrical radius R. In the lower panel, the solid curve shows the mass weighted, azimuthally averaged radial ve- locities of the stellar particles; the upper and lower dotted curves represent the average values of vR+ and vR− of the star particles, respectively. For the gas, the radial velocity profile is not shown as it is zero initially. In each panel, the two vertical dotted lines (black) indicate R14 and R25, re- spectively. (The vertical velocity profile of the disk material is not shown, as it is not relevant for our work.)
could have caused the decrease.
More recently, using the data of Mapping Nearby Galaxies at APO (MaNGA), Lee et al. (2018a) esti- mated the spin parameter for 1830 low-redshift galax- ies from the analysis of two-dimensional stellar spectra.
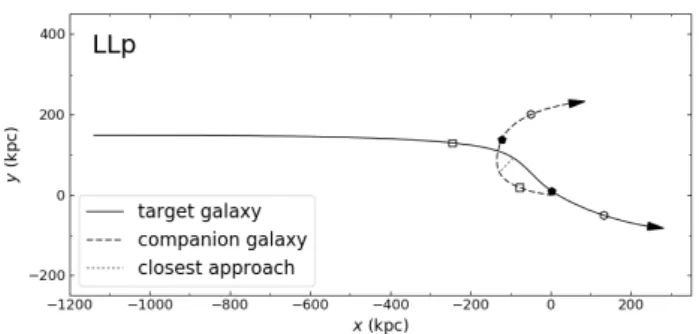
runs LLr, LEHp, and LEHr are only slightly different from those shown here.) The target galaxy starts from (x0, y0, z0) = (−1140 kpc, 150 kpc, 0) with an initial veloc- ity of (vx0, vy0, vz0) = (200 km s−1, 0, 0) and the companion galaxy from the origin with zero initial velocity. The target and companion galaxies meet most closely at t = 4.5 Gyr at the distance of about 50 kpc (red dotted line). The positions of the two galaxies at t = 4, 5, and 6 Gyr are marked on their orbits with open squares, filled pentagons, and open hexagons, respectively.
They divided the galaxies into four groups according to morphological type of the target and the companion (the nearest influential neighbor). As shown in their Figure 7, in the case of late-type targets having an early-type companion (“L-e”), the spin parameter of the target galaxies has been found to be decrease when the pair separation becomes less than the virial radius of the companion. (In the case of late-type targets hav- ing a late-type companion, “L-l”, such a decrease has not been found clearly in the spin of the targets. How- ever, it should be noted that the number of close pairs in this case is smaller than in the L-e case.)
The aforementioned observational studies that have shown some interesting correlations between the spins in pair of galaxies (Cervantes-Sodi et al. 2010;
Lee et al. 2018a) motivated us to explore the evolution of the spin of galaxies by using numerical simulations.
With the aim of finding a physical mechanism for chang- ing the angular momentum of galaxies, we performed a series of N -body/hydrodynamic simulations of inter- actions between galaxies in a variety of environments.
(We generally refer to “angular momentum” as “spin angular momentum”, if not specified.)
In this paper, we present the results of our first set of simulations studying the evolution of the spin of a Milky Way-like LTG (target galaxy) that ex- periences an interaction with a neighbor (companion galaxy). Specifically, we simulated co-planar galaxy- galaxy interactions, where the target galaxy encoun- ters an equally massive companion galaxy, which has either a late- or an early-type morphology, in prograde or retrograde sense. We also simulated the target galaxy evolving in isolation for comparison. The simple con- figuration selected for this work is intended to focus on examining the effects that the different companion mor-
Table 1 Model parameters
Model Mtota Rbvir Mds Mdg Mb Mhd Mhg fdg fhg Nds Ndg Nb Nhd Nhg
L 127.0 214.0 5.2 0.8 1.0 120.0 ... 0.13 ... 122 880 32 768 24 567 655 360 ...
EH 127.0 250.0 ... ... 7.0 118.8 1.2 ... 0.01 ... ... 172 032 655 360 49 152 Masses are in units of 1010M and the virial radius is in units of kpc.
aMtotis the sum of the masses of all particles.
bWe use the virial radius Rviras R200, which is defined as the radius within which the average density is 200 times the critical density.
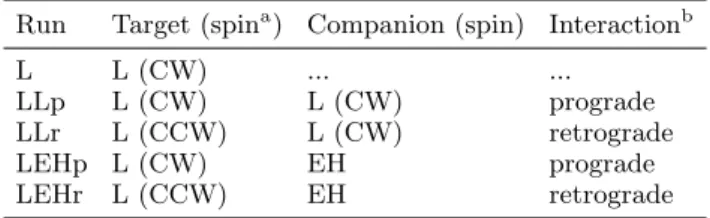
Table 2 Simulations
Run Target (spina) Companion (spin) Interactionb
L L (CW) ... ...
LLp L (CW) L (CW) prograde
LLr L (CCW) L (CW) retrograde
LEHp L (CW) EH prograde
LEHr L (CCW) EH retrograde
aThe direction of the spin of the disk of a LTG, when viewed from the positive z-axis. “CW” and “CCW” stand for clockwise and counterclockwise, respectively.
bWhether a target galaxy experiences a collision with a compan- ion galaxy as prograde or retrograde (see text for details).
phologies (late-type vs. early-type) and the encounter geometry (prograde vs. retrograde) might have on the spin evolution of the target galaxy, in comparison with that of the isolated target galaxy. As motivated by ob- servations, this work aims at examining what happened to the spin of the target galaxy. We expect the results of this first set of simulations to serve as a basis for our more extended follow-up studies and also for other related works.
The outline of this paper is as follows. We begin in Section2with an overview of the galaxy models and the simulation code used for this work. We then describe the initial conditions of our simulations. In Section 3, we present the results of our simulations focusing on the structural and the kinematic evolution of the target galaxy from each of our runs. Finally in Section 4, we summarize and discuss our findings. We also highlight the limitations and the implications of our results.
2. MODELDESCRIPTION
2.1. Galaxy Models
For this numerical study, we use two galaxy models: a LTG model “L” and an ETG model “EH”. Model L has been used in previous work of ours (Hwang et al. 2018;
hereafter Paper I). Model EH in this work is similar to model EH in Paper I but has half the mass of the model in Paper I. Thus models L and EH in this work have the same mass. Both models, L and EH, are generated by using the ZENO1 software package (Barnes 2011; see also Hwang et al. 2013 for the generation procedure).
Since a detailed description of the models is presented in Paper I (see alsoHwang et al. 2013), we here briefly outline their key properties.
1http://www.ifa.hawaii.edu/~barnes/software.html
Model L resembles the Milky Way Galaxy in size and mass, with a total mass of Mtot= 1.27 × 10¹²M and a virial radius of Rvir = 214 kpc (Table 1). The model consists of four components: a stellar disk, a gas disk, a stellar bulge, and a DM halo. The star and gas disks have masses of Mds = 5.2 × 10¹⁰M and Mdg = 0.8 × 10¹⁰M , respectively (McMillan 2011; Kubryk et al. 2015). The disk gas fraction in mass, fdg = Mdg/(Mds + Mdg), is thus about 0.13.
Both disks follow an exponential surface density pro- file and a sech2 vertical profile (Equation (1) in pa- per I). The radial scale lengths of the stellar and gaseous disks are rds = 3.5 kpc and rdg = 8.75 kpc, respec- tively, and the vertical scale length of both disks is zds = zdg = 0.35 kpc (cf. Hwang et al. 2013 for a justification of the choice of parameter values). The number of particles distributed within the star and gas disks are Nds= 122 880 and Ndg= 32 768, respectively.
Both disks are initialized with either clockwise or coun- terclockwise directional spin, as necessary. The disk gas particles are set to rotate with the local circular veloc- ities. The disk star particles have radial and vertical dispersions in addition to the local circular velocities as described in Barnes & Hibbard(2009). In Figure1, we show the initial distributions of the disk star and gas particles of model L and the circular and radial velocity (vc and vR, respectively) profiles of the disk star and gas particles. (Hereafter, we refer to the az- imuthal and the radial velocities in the cylindrical coor- dinate system as the circular and the radial velocities, vc and vR, respectively. The positive directions of vc
and vR are set to the direction of the initial disk rota- tion and the radially outward direction, respectively.) The temperature of the disk gas particles is set uni- formly to T = 10 000 K. The bulge component has a total mass of Mb = 1.0 × 10¹⁰M . It follows a Hern- quist profile (Hernquist 1990) with truncation at large radii as presented in Paper I (Equation (2)). The num- ber of particles of the bulge component is Nb= 24 567.
The DM halo component follows aNavarro et al.(1996) model with an exponential taper at large radii (Equa- tion (3) in Paper I). The total mass of the DM halo is Mhd = 120 × 1010M and the number of particles is Nhd = 655 360. The DM halo and the bulge com- ponents are dispersion-supported with no appreciable rotation (Barnes & Hibbard 2009;von Neumann 1951).
The ETG model EH has a total mass of Mtot = 1.27 × 10¹²M (which is equal to that of model L, as intended) and a virial radius of Rvir = 250 kpc. The
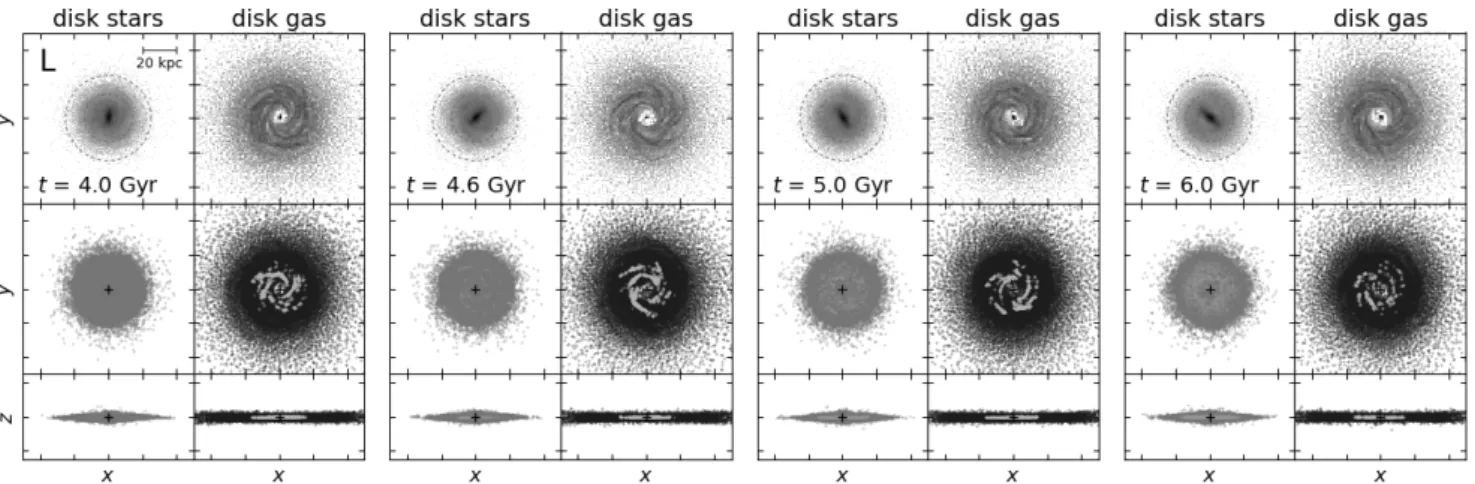
Figure 3. Four snapshots from run L of the disk particles of the target galaxy at t = 4, 4.6, 5, and 6 Gyr (from leftmost two columns to rightmost two columns in order, respectively; refer to Figure1for the initial particle distribution). The star and gas particles at each epoch are displayed separately (left and right columns, respectively). The top row shows the column densities of the disks projected on to the x–y plane, with adaptive gray scales. The inner and outer dotted (magenta) circles drawn in each panel of the top row indicate R14 and R25, respectively. The middle and bottom rows display the individual disk particles seen in the x–y and x–z planes, respectively, indicating the “status” of the particles with different colors:
Orange points represent “old” disk stars (the stars originally set as the disk stars and the stars formed out of the disk gas before t = 4.5 Gyr) and green points denote “young” disk stars (the stars formed out of the disk gas at t ≥ 4.5 Gyr). Blue and cyan points represent the non-star-forming (gas with zero star formation rate at that epoch) and star-forming disk gas particles (gas with a positive star formation rate at that epoch), respectively. In each panel of the middle and bottom rows, the center of the target galaxy is marked with a plus sign.
model possesses three components, a stellar bulge, a DM halo, and a gaseous halo, with masses of Mb = 7.0 × 10¹⁰M , Mhd = 118.8 × 10¹⁰M , and Mhg = 1.2 × 10¹⁰M (Anderson & Bregman 2010), respec- tively. The gas fraction in the halo is fhg= Mhg/(Mhd+ Mhg) = 0.01. The bulge and the DM halo compo- nents follow a Hernquist model (Hernquist 1990) and a Navarro et al. (1996) model, respectively, and are dispersion-supported as in model L. The gas halo fol- lows a non-singular isothermal profile with a taper (Equation (4) in paper I). The temperature of the halo gas particles is determined by the hydrostatic equilib- rium (refer to Figure 2 of Paper I). The initial velocity of the halo gas is set to zero. The numbers of parti- cles distributed in each component are Nb = 172 032, Nhd = 655 360, and Nhg= 49 152, respectively.
2.2. Simulation Code
To perform the numerical simulations, we make use of an early version of the GADGET-3 N -body/smoothed particle hydrodynamics (SPH) code (originally de- scribed in Springel 2005). Here we briefly describe the simulation code and refer interested readers toSpringel
& Hernquist (2003) and our previous papers for more details (Paper I; Hwang & Park 2015).
The code computes the gravitational force using a tree algorithm (Barnes & Hut 1986) and the hydrody- namic force by adopting a SPH method in the entropy conservative formulation (Springel & Hernquist 2002;
Gingold & Monaghan 1977). Radiative cooling and heating are modeled considering the primordial mixture of hydrogen and helium by photoionization (Katz et al.
1996). Star formation and the associated supernova
feedback in the interstellar medium (ISM) are imple- mented adopting the sub-resolution multiphase model of Springel & Hernquist(2003). A thermal instability operates for gas exceeding a threshold density and the ISM is treated as a statistical mixture of cold clouds and ambient hot medium. Stars form in dense regions con- suming the cold clouds, and the consumption timescale is chosen to match the observations (Kennicutt 1998).
Among the newly formed stars, massive stars (with the mass greater than 8 M ) die instantly as supernovae and release energy in the form of heat to the ambient diffuse gas. Some cold clouds evaporate inside the su- pernova bubbles, thus returning material to the ambient medium.
We set the code parameters governing star forma- tion and feedback to the standard values of the multi- phase model (Springel & Hernquist 2003). Some of the key values are as follows. The star formation time-scale and the mass fraction of massive stars among the newly formed stars are t?0 = 2.14 Gyr and β = 0.1, respec- tively. The “supernova temperature” is TSN = 108and the temperature of cold clouds are Tc= 1000 K. The pa- rameter value for supernova evaporation is A0= 1000.
The gravitational softening lengths for the parti- cles of the star and gas disks, bulge, and DM and gas halos are set to 0.14, 0.11, 0.14, 0.30, and 0.11 kpc, respectively. These gravitational softening lengths are determined by considering the equivalence of the max- imum acceleration experienced by a single particle in each component.
2.3. Initial Conditions for Our Simulations In order to study the spin evolution of a Milky Way-like LTG in different situations, we perform five numerical
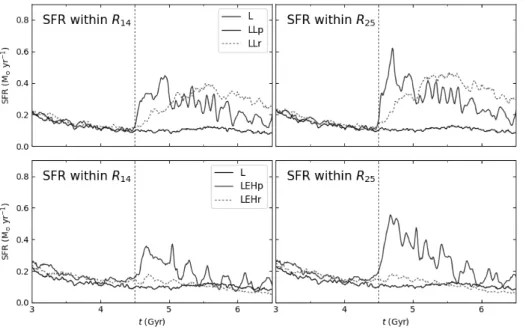
Figure 4. Evolution of the star formation rate (SFR) of the tar- get galaxy from runs L, LLp, and LLr (top row) and from runs L, LEHp, and LEHr (bottom row).
The left column shows the sum of the SFRs of the star-forming gas particles enclosed in a cylin- drical region of radius R14(with
|z| ≤ 20 kpc), including the cap- tured particles from the compan- ion (if any). The right column displays those enclosed in a cylin- drical region of radius R25(with
|z| ≤ 20 kpc) from each run. The vertical dotted line in each panel indicates the time of closest ap- proach (t = 4.5 Gyr) of the tar- get and the companion galaxies in the galaxy-galaxy encounter runs.
simulations (Table2):2 Run L is the simplest one where the LTG model L (target galaxy) evolves in isolation.
In runs LLp and LLr, model L (target) encounters an- other model L (companion) in prograde and retrograde sense, respectively. Similarly, in runs LEHp and LEHr, model L (target) encounters the ETG model EH (com- panion) in prograde and retrograde sense, respectively.
We construct the initial conditions of our simulations as below.
First, for the isolated case of run L, model L is initialized in the x–y plane (i.e., the midplane of the disk lies on the x–y plane), with the center of the model being placed at the origin as shown in Figure1(top two rows). (We generally refer to “disk” as the total disk consisting of both stars and gas, unless specified as “star disk” or “gas disk”.) The disk of model L in this run is set with a clockwise directional spin as viewed from the positive z-axis, and with zero (systemic) velocity.
Next, for runs LLp and LLr, the two LTG-LTG encounter simulations, model L as the target galaxy is initially placed at (x0, y0, z0) = (−1140 kpc, 150 kpc, 0) and another model L as the companion galaxy is posi- tioned at the origin as presented in Figure2. The initial velocity (vx0, vy0, vz0) of the target and the companion galaxies are set to (200 km s−1, 0, 0) and (0, 0, 0), re- spectively. These initial positions and velocities of the models are chosen such that the two galaxies have their closest encounter at t = 4.5 Gyr since the start of each run, with the distance being about 50 kpc. The dis- tance of closest approach of 50 kpc is chosen to see some encounters that are not too weak or not too strong.
For galaxies at low redshift and not in high-density re- gions like galaxy clusters, which are relevant to this study, distant encounters occur more frequently than
2Additionally, we performed “run LLr2”. In this run, the late- type target galaxy encounters the late-type companion galaxy in retrograde sense, while both galaxies spin in counterclockwise direction. We present the results of this run in AppendixA.
very close encounters do. Although distant encounters are frequent, the effects of a single distant encounter on the evolution of a target galaxy would be weak. On the other hand, the effects of a single very close en- counter would be significant, but such an encounter is rare. (Once it happens, the galaxies involved would merge quickly.) Thus, considering both frequency and effects of galaxy-galaxy interactions, choosing encoun- ters at an “intermediate” strength would be reasonable for our work. In runs LLp and LLr, the midplanes of the disks of both target and companion galaxies are located on the x–y plane initially. The only difference between the two initial conditions is the direction of the spin of the target galaxy: For run LLp, the disk of the target galaxy is set with a clockwise directional spin; whereas, for run LLr, it is set with a counterclockwise directional spin. In both runs, the disk of the companion galaxy is set with a clockwise directional spin.
Finally, for runs LEHp and LEHr, the two LTG- ETG encounter runs, the initial positions and velocities of the target and the companion galaxies are set to the same values as in runs LLp and LLr. The direction of the spin of the target galaxy in run LEHp (LEHr) is also set to clockwise (counterclockwise), as in run LLp (LLr). The only difference between the initial condi- tions of run LEHp (LEHr) and run LLp (LLr) is the morphological type of the companion galaxy, which is of early type in runs LEHp and LEHr but of late type in runs LLp and LLr.
3. SIMULATIONRESULTS
With the initial conditions described in Section2.3, we performed five numerical simulations for t = 7 Gyr since the start of each run (Table 2). Here we present the results of our simulations. In the first subsection, we describe the general evolution of each run, focusing on the change in structure and star formation activity in the target galaxy. Then we examine the kinematics and
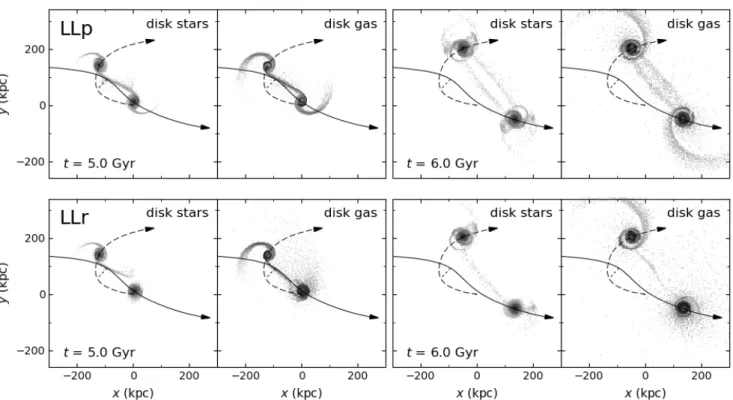
Figure 5. Large-scale snapshots from runs LLp (top row) and LLr (bottom row) at t = 5 (left two columns) and 6 Gyr (right two columns). In the snapshots from each run at each epoch, disk star and gas particles from both target and companion galaxies are presented separately (left and right panels, respectively). In each panel, the orbital trajectories of the target and companion galaxies, and the minimum distance between the two galaxies are drawn (cf. Figure2).
the spin angular momentum of the target galaxy in the following subsections.
3.1. General Evolution 3.1.1. Run L
Figure 3 presents the distribution of the disk particles of the target galaxy from run L at four epochs. The tar- get galaxy in this run evolves in isolation. As seen in the top row, a central bar and multiple spiral patterns develop in the star and gas disks as time passes. In the bottom two rows, star-forming gas particles are dis- tinguished from non-star-forming gas particles by cyan and blue points, respectively. Most of star-forming gas appears in the inner region of the disk within a galacto- centric (cylindrical) radius of R = 14 kpc (R14), marked with the inner magenta dotted circle. R14 is the ra- dius within which ∼90% of the disk stars were initially distributed in the model; it also equals four times the initial radial scale length of the stellar disk. We use R14as a reference radius throughout this paper, for the purpose of indicating the region where most initial disk stars were located. We also use the reference radius R = 25 kpc (R25; the outer dotted circle in the figure) which is half of the distance of closest approach in the galaxy-galaxy encounter runs.
As star-forming gas gradually turns into stars, the gaseous disk dissipates and the stellar disk grows in mass. Among those stars formed out of the star- forming gas, the stars formed after t = 4.5 Gyr are displayed with green points (hereafter,“young” (disk)
stars), whereas those stars added to the disk before t = 4.5 Gyr as well as the stars initially set as disk stars are plotted with orange points (hereafter, “old”
(disk) stars). We place the division of young and old stars specifically at t = 4.5 Gyr in order to compare the distribution of the young stars in the isolated tar- get galaxy with those in the target galaxies from the galaxy-galaxy encounter runs in the following subsec- tions. We present in Figure 4 the sum of the SFRs of the individual star-forming gas particles within R14and R25. The SFR within R25 (and also that within R14) does not change substantially but slowly decreases as time passes due to the accumulated effects of cold gas consumption by star formation.
3.1.2. Run LLp
Figure 5 (top row) shows the large-scale configuration of the disks of both target and companion galaxies from run LLp, with their orbital trajectories overlaid.
The closest approach between the two LTGs occurs at t = 4.5 Gyr with the distance of about 50 kpc. When the target galaxy collides with the companion galaxy, it experiences the encounter as prograde, since the or- bit of the companion is prograde with respect to the clockwise directional spin of the target. (Likewise, the companion galaxy, which is spinning in clockwise direc- tion, experiences the encounter with the target as pro- grade.) Thus, as seen in the large-scale snapshots taken after the collision, substantial bridges and counter-tails are pulled out of the stellar and gas disks of the target
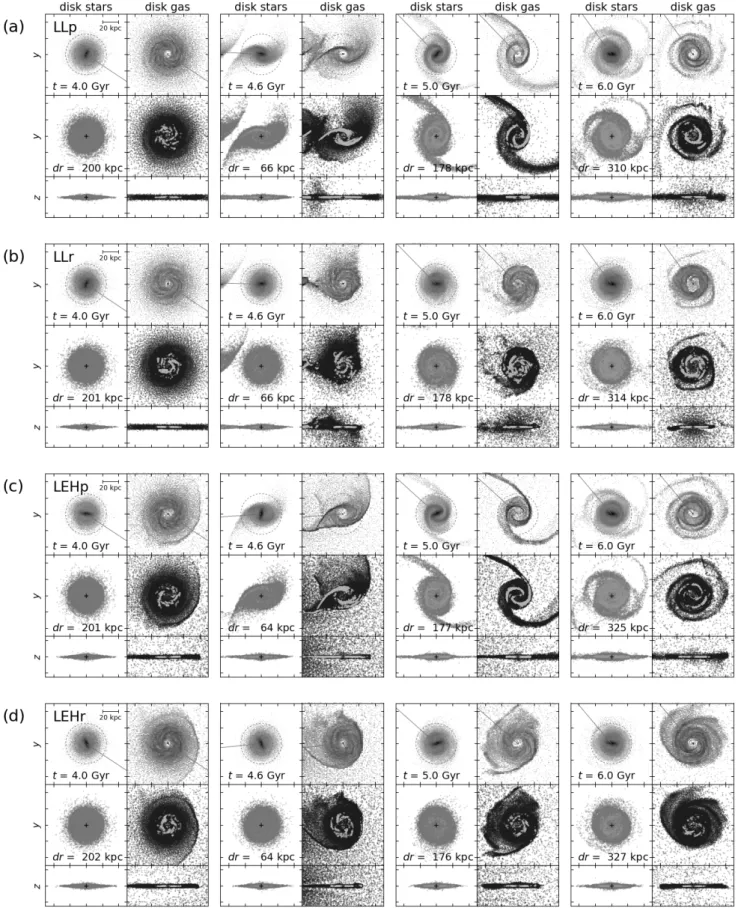
Figure 6. Same as Figure3, but for runs LLp (a), LLr (b), LEHp (c), and LEHr (d). The snapshots presented here include disk particles captured by the target galaxy from the companion galaxy, if any. In each panel of the top rows of (a)–(d), a solid (magenta) line is drawn from the center of the target to the center of the companion. The distance between the two galaxies (dr) at each epoch is shown in the middle rows of (a)–(d).
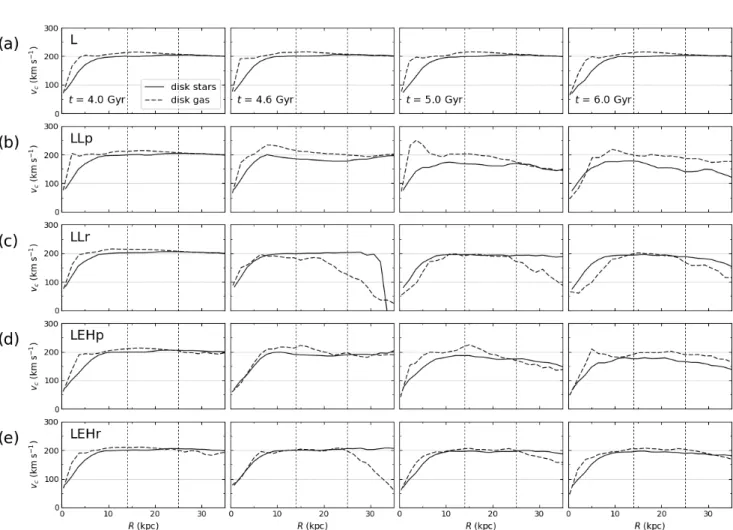
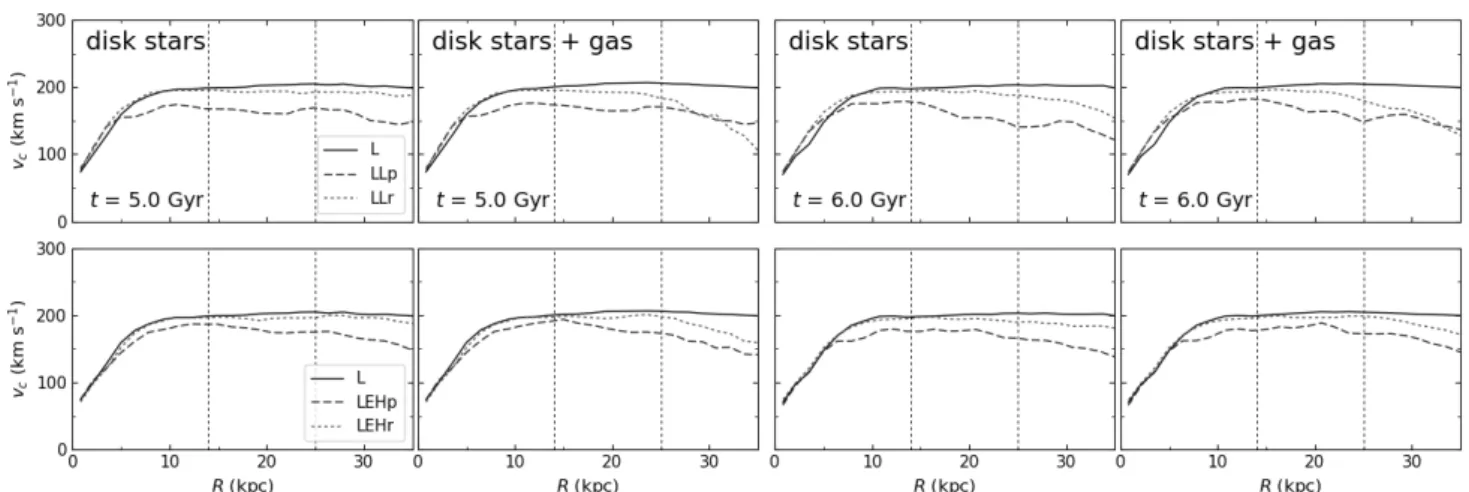
Figure 7. Mass weighted, azimuthally averaged circular velocity vc of the disk particles of the target galaxy as function of radius R from runs L (a), LLp (b), LLr (c), LEHp (d), and LEHr (e). The leftmost through rightmost columns show the circular velocity profiles at t = 4, 4.6, 5, and 6 Gyr, respectively. In each panel, the solid curve represents the profile of the disk star particles (i.e., both old and young disk stars, if there are any young stars formed by the time) and the dashed curve marks that of the disk gas particles (i.e., both non-star-forming and star-forming gas). The two vertical dotted lines mark R14 and R25. In (b) through (e), the velocity profiles are estimated including the captured particles (i.e., those originally set as the disk stars or gas particles of the companion but transferred to the target), if there are any.
(companion) galaxy due to the tidal forces imposed by the companion (target) galaxy. There is some mass ex- change between the galaxies: Some disk star and gas particles, among those initially set as the disk particles of the companion, transfer to the target through the stellar and gas bridges formed out of the companion, and vice versa.
Focusing on the evolution of the target galaxy, Fig- ure6(a) provides more close-up views of the star and gas disks. The snapshots at t = 4 Gyr (i.e., 0.5 Gyr before the collision) appear to be similar to those from run L (without a collision) at the same epoch. However, the snapshots taken after the collision show big differences compared with those from run L at the corresponding epochs: At the onset of the collision, the star and gas disks of the target galaxy start to be pulled radially outward due to the tidal force. Here the tidal force not only stretches the target along the line connecting the target and the companion, but also compresses the tar- get along the perpendicular direction. Besides, since gas interacts not only gravitationally but also hydrody-
namically, the leading side of the gas disk of the target galaxy is shock-compressed by the collision with the gas disk of the companion galaxy. As seen in the snapshots at t = 4.6 Gyr (shortly after the collision), a lot of star-forming gas turns up along the interaction-induced arms through the prograde collision. By t = 5 Gyr, substantial bridges and tails have developed out of both stellar and gas disks of the target galaxy. The higher gas density at the leading side of the gas disk and of the gas bridge results from the shock generated through the collision. Until t = 6 Gyr since the time of the col- lision, a lot more young stars have been added onto the disk, than in the isolated target galaxy from run L.
As shown in Figure 4, the SFR in the target galaxy increases abruptly right after the collision, indicating that the strong star formation activity is triggered by the prograde collision. The SFR within R25(consider- ing the wider region) reaches its maximum after a few hundreds Myr since the collision and then starts to drop (but still remains much higher than that in run L un- til t = 6 Gyr) as gas is consumed by the burst of star
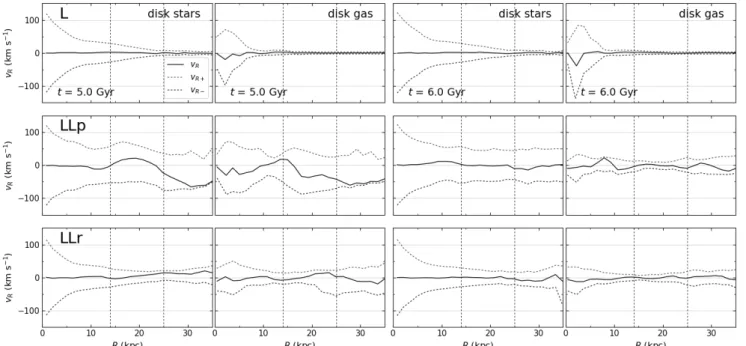
Figure 8. Mass weighted, azimuthally averaged radial velocity vR of the disk particles of the target galaxy as function of radius R from runs L (top row), LLp (middle row), and LLr (bottom row). The left two columns present the velocity profiles of the stars and gas, respectively, at t = 5 Gyr; similarly, the right two columns show those of the stars and gas at t = 6 Gyr.
In each panel, the black solid curve represents the profile of vR; the red and blue dotted curves show those of vR+ and vR−
separately. The two vertical dotted lines indicate R14 and R25. In the middle and bottom rows, the velocity profiles are estimated including the captured particles from the companion galaxy, if there are any.
formation.
3.1.3. Run LLr
The results from run LLr are presented in Figures 5 (bottom row) and 6(b). When the collision occurs at t = 4.5 Gyr, the target galaxy, spinning in counterclock- wise direction, experiences the collision as retrograde.
(The companion galaxy, spinning in clockwise direction, experiences it as prograde.) Due to the retrograde pas- sage of the companion in this run (with respect to the spin of the target), tidal perturbations on the target by the companion act for a shorter time than in the case of the prograde collision (run LLp). Accordingly, the target galaxy does not develop strong bridges and tails, as can seen in the large-scale snapshots. During the collision, some disk material which initially belonged to the companion is captured by the target galaxy.
Looking at the target galaxy more closely (Fig- ure 6(b)), the amount of star-forming gas increases shortly after the collision (at t = 4.6 Gyr), more than in the isolated target galaxy from run L, but not as much as in the target galaxy from run LLp. This can also be seen from the SFR presented in Figure4. The SFR (within R25) of the target galaxy in run LLr in- creases after the collision, but less drastically than that in run LLp. Because of the less drastic increase of the star formation activity, cold gas in the target galaxy is consumed slower than in run LLp. This helps the target galaxy to maintain a relatively high level of star formation until later times; the gas particles captured by the target galaxy during the collision also contribute
to it. (The amount of gas captured by the target galaxy in run LLr is larger than that in run LLp, because in this particular case of run LLp the shock boundary gen- erated between the two gas disks by the prograde col- lision hinders the flow of gas for a while. In general, the amount and the orbit of the material captured by one galaxy from the other are very sensitive to various factors such as the relative orbit of the pair, the phys- ical properties of each galaxy, and so on. A detailed discussion on this subject is beyond the scope of this paper.)
3.1.4. Runs LEHp and LEHr
Snapshots of runs LEHp and LEHr are presented in Fig- ure6(c) and (d), respectively. In run LEHp(LEHr), the target galaxy spinning in clockwise (counterclockwise) direction experiences the collision with the early-type companion as prograde (retrograde). As shown in the snapshots, the distribution of the old disk stars (which are mainly affected by the gravitational force) in the target galaxy from run LEHp(LEHr) at each epoch is similar to that from run LLp(LLr) at the corresponding epochs, as expected. However, the distributions of the disk gas (which is influenced by both gravitational and hydrodynamic forces) and of the young stars (which are formed after the collision) are somewhat different from those in run LLp(LLr). The different hydrodynamic interactions between the disk gas of the target and ei- ther the halo gas of the companion (in runs LEHp and LEHr) or the disk gas of the companion (in runs LLp and LLr) may have caused different distributions.
Figure 9. Top row: comparison of the circular velocity profiles of the disk material of the target galaxy from runs L, LLp, and LLr (black solid, blue dashed, and red dotted curves, respectively). The left two columns show the profiles of the disk star particles and of all disk (stars + gas) particles, respectively, at t = 5 Gyr. The right two columns represent those of the stars and of star plus gas, respectively, at t = 6 Gyr. In each panel, the two vertical dotted lines mark R14 and R25. Bottom row: same as the top row, but for runs L, LEHp, and LEHr.
In run LEHp (Figure6(c)), at t = 4 Gyr (0.5 Gyr before the closest approach), the gas disk of the tar- get galaxy already starts to form a bow-like front as it comes under the influence of the extended gas halo of the companion galaxy. At t = 4.6 Gyr, shortly after the closest approach, the gas at the leading side of the disk is shock-compressed by the collision (c.f. run EH-L in Hwang & Park 2015). In addition, some disk gas is stripped by ram pressure (as seen at the rear side of the disk) or ionized and then scattered, as it moves against the diffuse hot halo gas of the companion. As displayed in Figure4, the SFR (within R25) of the target galaxy in run LEHp increases by a large amount due to the prograde collision and then slows down afterwards due the cold gas consumption.
In the case of the retrograde collision (Figure6(d)), the target galaxy in run LEHr does not develop bridges and tails out of the star and gas disks after the collision.
The SFR of the target galaxy (Figure4) increases dur- ing the collision but only slightly, compared with that of the target galaxy without a collision (run L). At later times (t & 5.5 Gyr), the SFR in this run is even lower than that of the isolated target galaxy. This is because some cold gas is removed not only by star formation but also by ram pressure and/or ionization in run LEHr.
3.2. Kinematics
Here we discuss the kinematics of the disk star and gas particles of the target galaxy in our five runs. First we examine the time change of the circular and radial velocities of the disk particles in the following four sub- sections. Then we look into the evolution of the spin angular momentum of the disk material in the last sub- section.
3.2.1. Run L
Figures7(a) and8(top row) present the profiles of the circular and radial velocities (vc and vR, respectively) of the disk particles of the target galaxy while evolving
in isolation. The profiles of the stars and gas deviate somewhat from the initial ones via secular evolution (see Figure1for the initial profiles) – i.e., as a bar and spiral arms develop on the disk and star formation with the associated feedback comes into play. Although some changes appear in the velocity profiles as time passes, more so for the gas than for the stars, in the inner region of the disk (where star and structure formation occur more actively), the deviations are generally not significant throughout the run. (In general, the circular velocity profile of young disk stars could be different from that of (old) disk stars. For example, when they have just been formed, the profile may follow that of gas rather than that of stars. We do not display the profile of young stars separately in the figure, because their contribution to the overall (mass weighted) stellar velocity profile is not significant in our runs. It should also be noted that their contribution in luminosity could be more significant than in mass.)
In Figure9, we compare the circular velocity profile of the disk stars and that of the entire disk material (stars plus gas) at t = 5 and 6 Gyr (black solid curves).
They appear to be quite similar – as expected, since stars in the target galaxy make up a large portion of the mass of the total disk.
Examining the values of vc of the individual disk particles (top rows of (a)–(g) in Figure10), stellar par- ticles having relatively high values of vc (out of the six bins as indicated by the color bar) appear predomi- nantly in the inner region of the disk around the bar and the arms where the density of stars is high as well.
Stars having lower values of vc are spread more widely throughout the disk. Many stars whose values of vcfall into different bins overlap spatially. (E.g., stars in the innermost region of the disk have diverse values of vc spanning across all six bins.) Gas particles with lower values of vc are found in the inner region of the disk and particles with different values of vc hardly overlap spatially. Unlike stars, dynamically cold gas responds
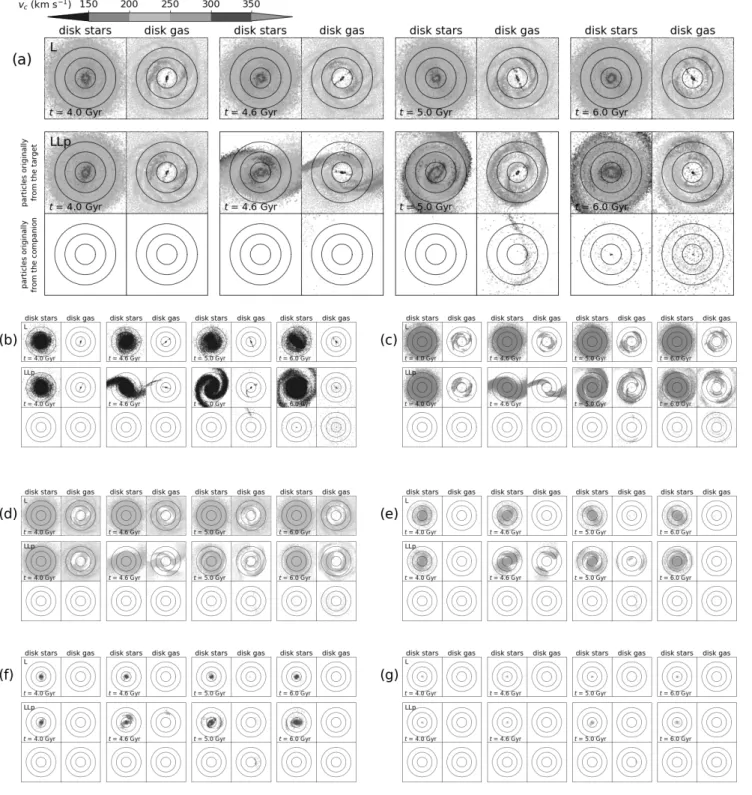
Figure 10. (a) Disk star and gas particles of the target galaxy from runs L and LLp at t = 4, 4.6, 5, and 6 Gyr (from leftmost two columns to rightmost two columns in order, respectively). The disk particles of the target galaxy from run L are shown in the top row; for run LLp, the disk particles originally set as the target galaxy and those initially set as the companion galaxy but transferred to the target galaxy are displayed separately in the middle and bottom rows, respectively.
Particles are colored according to their circular velocities vc as indicated by the color bar. (For simplicity, the particles having negative values of vc are not distinguished, as they are not significant in runs L and LLp, for the purpose of this figure.) The particles having the lowest values of vcare plotted first, those having higher values of vc are overlaid on top in order. Each panel spans 40 kpc on each side. Concentric solid circles in each panel mark R = 5, 10, and 15 kpc from the center of the target galaxy. (b)–(g): Same as (a) but displaying the particles separately depending on the values of their circular velocities: 0 ≤ vc < 150 km s−1 (b), 150 km s−1≤ vc< 200 km s−1 (c), 200 km s−1≤ vc< 250 km s−1 (d), 250 km s−1≤ vc< 300 km s−1(e), 300 km s−1≤ vc< 350 km s−1 (f), and vc≥ 350 km s−1(g).
Figure 11. Comparison of the profiles of vc and vc+(black solid and red dotted curves, respectively) for the disk particles of the target galaxy from runs LLp (top row) and LLr (bottom row). The left two columns show the profiles of the disk star particles and of all disk particles, respectively, at t = 5 Gyr; the right two columns shows those at t = 6 Gyr. In each panel, the two vertical dotted lines mark R14and R25.
very quickly to potential perturbations caused by galac- tic structures such as bars and spiral arms (Roberts 1969;Oh et al. 2008). Thus, shocks can occur easily in the gas disk, causing the gas to lose angular momen- tum (Kim & Kim 2014;Kim et al. 2014). For instance, the shocks driven by the asymmetric bar-potential can generate torques through which gas loses angular mo- mentum and moves inward radially; the spiral shocks can also work to remove the angular momentum of the gas which “piles up”.
3.2.2. Run LLp
Figures7(b) and8(middle row) show the profiles of vc
and vR, respectively, of the disk particles of the target galaxy experiencing a prograde collision with a late- type companion. First, examining the profiles of the disk stars in the region within R253 (half the distance of closest approach), there is a trend for stars to lose vc
but gain both vR+and vR−after the prograde collision.
The decrease in stellar circular speed is mainly due to the deflection of orbits by tidal disruption. (Although some particles are transferred from the companion to the target, we found that their contribution does not significantly influence the overall velocity profiles.) As shown in Figure10(bottom two rows of (a)–(g)), when the stellar disk of the target galaxy is pulled out by tidal forces and creates a bridge on the near side (toward the companion) and a counter-tail on the far side, stars lo- cated in the outermost part of the disk are pulled radi- ally outward first and stars from more inward regions follow later, while the disk rotates and moves. This may be the cause for the phase coherence of the stel- lar orbits along the arms, creating the vc distribution shown in the figure. (Note that many stars with differ-
3We consider/compare the profile of vcin each of our runs only in the region within R25 throughout this paper – i.e., up to half the distance of closest approach in the galaxy-galaxy en- counter runs. This is because in some of our runs (particularly in runs LLp and LEHp) the outer part of the disk, beyond R25, of the target galaxy is severely disturbed by the interaction.
ent values of vcoverlap spatially, as in run L.) Since the stellar disk is strongly disturbed by the prograde colli- sion and generates a substantial bridge and tail lasting several Gyr, the weakening of circular motion and am- plification of both radially inward and outward motions for stars (compared with those of before or without the collision) continue until t = 6 Gyr.
The circular and radial velocity profiles for the disk gas particles of the target galaxy appear to vary in a more complicated fashion after the collision than those of stars: The amplitude of the circular velocity profile does not simply globally decrease after the collision but rather fluctuates, sometimes showing inner peak(s) – e.
g., at t = 5 Gyr near R = 3 kpc (which will be discussed below). The amplitudes of the profiles of both vR+and vR− increase at t = 5 Gyr, until shortly after the col- lision, and then slow down at t = 6 Gyr. During the collision, as shown in Figure 10(see also Figure 6(a)), the disk gas of the target galaxy is pulled out by grav- itational tides starting from the outskirt of the disk.
The gas disk is shock-compressed by the collision with the gas disk of the companion, starting from the lead- ing side of the disk, while it rotates and moves. As stated previously, since dynamically cold gas responds very quickly to density perturbations generated in the disk, gas particles having different values of vc hardly overlap spatially, in contrast to stars. Locally, the circu- lar velocities of some disk gas particles increase through the collision under the influence of the collisional com- pression and the shocks generated in the disk in addi- tion to the influence of gravity. For example, the circu- lar velocities of the gas particles of the target galaxy at t = 5 Gyr lying along the asymmetric inner arm around R = 3 kpc (those shown in pink in the middle row of the sixth panel from the left in Figure 10(a)) increase, resulting in the peak around that radius in the profile of vc. Interestingly, at t = 5 Gyr, the gas particles trans- ferring to the target galaxy through the bridge (which formed out of the gas disk of the companion) reaching
Figure 12. Spin angular momentum of the disk of the target galaxy with respect to time from runs L, LLp and LLr (left column) and runs L, LEHp, and LEHr (right column). The top through bottom rows show the angular momentum of the disk, considering the disk stars (top row), gas (middle row), and stars plus gas (bottom row) particles enclosed in a cylindrical region of radius R (S(R), with |z| ≤ 20 kpc). In each panel, the upper and lower three curves display S(R25) and S(R14), respectively. (The particles captured by the target, if any, from the companion are included.) The vertical dotted line indicates the time of closest approach, t = 4.5 Gyr, of the target and the companion galaxies in the galaxy-galaxy encounter runs.
the region near R = 5 kpc (measured from the center of the target; shown in green and red in the bottom row of the sixth panel from the left in Figure10(a)) have par- ticularly high circular velocities. This is because the direction of progress of the gas bridge happens to be aligned with the direction of the local circular velocity in the target galaxy. In this particular case, however, the amount of transferred gas is found to be insufficient to make a significant contribution to the vc profile.
We compare in Figure9 (top row) the circular ve- locity profiles of the disk star particles and of all disk particles of the target galaxy at t = 5 and 6 Gyr (blue dashed curves). The profile for all disk particles glob- ally follows that for the stars, as in run L, because stars dominate the disk mass and the encounter is not strong enough to bring the system out of equilibrium. Both profiles, for stars and stars plus gas, from this run have amplitudes lower than those from run L after the colli- sion, except in the central region. In addition, we exam- ine how the circular velocity profile changes when ex- cluding counter-rotating disk particles. Figure11shows that the profiles of vc+ of the stars and of stars plus gas (excluding counter-rotating ones) are quite similar to the profiles of vc after the prograde collision, except in the central region. (The profiles of vc and vc+ also dif- fer in the central region of the isolated target galaxy,
similar to those in run LLr (bottom row)).
3.2.3. Run LLr
When the target galaxy experiences a retrograde col- lision with a late-type companion, the vc profile (Fig- ure7(c)) of the disk stars within R25remains relatively unchanged after the collision. Likewise, the amplitudes of both the vR+ and vR− profiles of the stars (bottom row of Figure 8) do not change much through the ret- rograde collision. The profiles of vc, vR+, and vR− for the disk gas within R25 change somewhat after the col- lision (except during or shortly after the collision), but not as much as in run LLp. Figure 9 (top row) also shows that the circular velocity profiles of stars and of star plus gas do not differ much from those in run L at t = 5 and 6 Gyr. Figure 11(bottom row) presents the profiles of vcand vc+ of the disk particles. The two pro- files within R25are similar overall, except in the central region of the disk.
It appears that the retrograde collision considered here has not been able to drive significant dynamical response in the target galaxy, in contrast to the case of the prograde collision, despite of the equally close encounter. Therefore, we can infer that in close pairs of galaxies the effects of the interaction with its neighbor on the kinematics of a system might be too weak to be
Figure 13. Same as Figure12, but for the specific angular momentum of the disk of the target galaxy.
measured, depending on the geometry of the encounter.
3.2.4. Runs LEHp and LEHr
We first consider run LEHp in which the target galaxy interacts with an early-type companion in prograde sense. As shown in Figures 7(d) and 9 (bottom row), the vc profile for the disk stars of the target galaxy evolves similarly to that from run LLp after the collision – i. e., stars generally lose vc after the collision. Since the gravitational pull exerted upon the target galaxy depends on the mass of the companion, which is the same in runs LEHp and LLp, the stellar orbits in the target galaxy in both runs are influenced in a similar fashion by the prograde collision.
The vc profile for the disk gas of the target galaxy from run LEHp becomes somewhat bumpy, without a notable decrease, after the collision. This trend also ap- pears in the profile for the gas in run LLp. However, the specific shape of the profile in this run evolves dif- ferently from that in run LLp after the collision. This may have been caused by the different hydrodynamic interactions in these runs.
In run LEHr (Figures7(e) and9), where the target galaxy experiences a retrograde collision with an early- type companion, the vc profile for the disk stars of the target galaxy remains almost unchanged after the col- lision, similar to that in run LLr. The velocity profile of the gas varies only slightly after the collision. As pointed out in Section 3.2.3, it means that the dynam- ics of the target galaxy in this run, as well as in run LLr, is not affected significantly by the retrograde collision, except for the outskirts of the disk.
3.2.5. Angular Momentum
We calculate the spin angular momentum S of the tar- get galaxy disk in all of our runs. For estimating S(R) we consider the disk particles of the target galaxy en- closed within a cylindrical region of radius R (with
|z| ≤ 20 kpc). In Figure12we present the evolutions of S(R25) and S(R14). The S of the star disk and of the star plus gas disk of the target galaxy decrease drasti- cally after the prograde collision (runs LLp and LEHp), but not after the retrograde collision (runs LLr and LEHr). The value of S(R25) of the star plus gas disk at t = 5.5 Gyr (i.e., 1 Gyr after the collision) is about 20 % (15 %) smaller in run LLp (LEHp) than that at t = 3.5 Gyr (1 Gyr before the collision). In Figure13, we also present the specific angular momentum of the disk of the target galaxy, by dividing S by the total mass of the enclosed particles in each case. The spe- cific angular momentum of the disk likewise decreases strongly after the prograde collision, similarly to the angular momentum. This phenomenon can be inter- preted as follows: Initially, in the center-of-mass (CM) frame, the two galaxies are far apart and approach each other linearly. After the encounter, the galaxies rotate about the CM with the orbital angular momentum L, and the total angular momentum of this system is given by the vector sum of ~S and ~L. The sum is additive in magnitude in the prograde case but subtractive in the retrograde case. This results in the decrease of S of the target galaxy disk in the prograde case but the in- crease of that in the retrograde case. This justified our result showing the different behavior of S in the pro-
Figure 14. Same as Figure5, but for run LLr2.
Figure 15. Same as Figures3and6, but for run LLr2.
grade case against the retrograde case. Contributions by tidal effects on the target galaxy disk discussed in the previous sections decrease S further, in such a way that the decrease of S in the prograde case is enhanced and the increase of S in the retrograde case is reduced.
The change in L is biggest right after the encounter, and one can see a drastic change of S as shown in Figure12.
There could also be tidal effects due to the bulge and the DM halo reducing S of the galaxy disks in both the prograde and retrograde cases, but those contributions are not significant. We will discuss such subdominant effects briefly in Appendix B.
4. SUMMARY ANDDISCUSSION
Influenced by observational studies that found correla- tions between the spin magnitudes in pairs of galaxies (Cervantes-Sodi et al. 2010;Lee et al. 2018a), we carried out a numerical study examining how the spin of LTGs is affected by interactions in a more direct way. As the first in a series of (planned) work, we constructed four simulations of co-planar encounters between a late-type target galaxy (model L) and an equally massive com- panion galaxy, whose morphology is either of late or early type (model L or EH, respectively), in prograde or retrograde sense; these are our runs LLp, LLr, LEHp, and LEHr, respectively. We also set up one simulation of the evolution of the target galaxy in isolation, run L, for comparison.
By analyzing the circular velocities of the disk par- ticles of the target galaxy (up to R25) over time in each of our five runs, we obtained the following results:
1. The circular velocities of disk stars of the late- type target galaxy tend to decrease (and both positive and negative radial velocities tend to increase) through the prograde collision in runs LLp and LEHp, regardless of the type of the companion. This is mainly due to the deflection of orbits caused by the tidal disruption. Since the masses of the late- and the early-type companions (having identical DM halo components) are the same, the individual disk stars (which are mainly affected by the gravitational force) of the target galaxy in these runs dynamically evolve in a similar way through the collision.
2. Disk gas of the target galaxy dose not generally lose the circular velocity through the prograde collision in runs LLp and LEHp. The circular velocity of the gas vary in a more complicated fashion, than those of the stars, due to the combined effects of the gravitational and the hydrodynamic interactions.
3. In case of a retrograde collision (runs LLr and LEHr), the circular velocities of the disk stars of the tar- get galaxy remain almost unchanged after the collision, similar to those in the isolated target galaxy (run L).
The circular velocity of the gas changes after the ret- rograde collision, but not as much as in runs LLp and LEHp, except during/near the collision. This indicates
Since stars in our target galaxy make up a large portion of the mass of the total disk as observed in many LTGs, the circular velocity profile of the entire disk material (stars plus gas) generally follows that of the stars in all of our runs. This is also because the encounters considered here are not strong enough to bring the systems out of equilibrium. Taken together, our simulation results indicate that the overall spin of a LTG can decrease through a prograde collision, but hardly through a retrograde collision, regardless of the morphology of the companion. This was also demon- strated in the change of the spin angular momentum of the disk of the target galaxy with time. We found a clear decrease of the angular momentum after the pro- grade collision, but not after the retrograde collision.
This is due to the combined contributions by the tidal effects on the target disk and the spin-orbit interactions (followed by total angular momentum conservation) of the two galaxies. Specifically, the spin angular momen- tum (within R25) decreased by ∼20% and ∼15% after the prograde collision in runs LLp and LEHp, respec- tively. We can thus infer that, for a sample of LTGs which are observed to have a close neighbor of compa- rable mass, the decrease of the spin of the LTGs (as the separation distance decreases) becomes more obvi- ous when the sample includes many LTGs that expe- rience and/or have experienced one or more prograde collisions.
The results from this work may not be generalized to different cases. For example, in cases where a late- type target galaxy interacts with a companion galaxy of very different mass, a significant net amount of material can transfer from one galaxy to the other. Let us recall that, in run LLp at t = 5 Gyr, gas particles trans- ferred from the companion to the target through the narrow bridge, having much higher circular velocities than surrounding particles. The high circular velocities occurred because the direction of progress of the bridge happened to be aligned with the direction of the local circular velocity. The amount of transferred material in run LLp was not sufficient to have a significant im- pact on the circular velocity profile for the entire disk material. However, in different situations such as inter- actions between galaxies of unequal mass, a sufficient amount of material might be able to transfer to the target galaxy with high circular velocities, resulting in
late-type target galaxy interacts strongly with another gas-rich galaxy, meaning that hydrodynamic effects may play a much more influential role than in our sim- ulations. In this case, the amplitude of the circular ve- locity profile for the overall disk material of the target galaxy might not decrease after the collision, unlike in our runs LLp and LEHp (where tidal disruption plays a bigger role for decreasing the amplitude), but changes in a complex fashion depending on the particular cir- cumstances in each case.
We end this work by emphasizing the significance of interactions with neighboring galaxies in determining the spin of LTGs, as demonstrated by our runs LLp and LEHp. Since most galaxies experience multiple interac- tions over the course of their lifetime, the accumulated effects of galaxy-galaxy interactions at later stages, af- ter the acquisition of the internal angular momentum, will play a crucial role in the evolution of the total angu- lar momentum of galaxies. We will continue studying this subject in our future work, considering more di- verse interactions including the cases stated above and also major and minor mergers for a more in-depth un- derstanding of the evolution of galactic spin in various environments.
ACKNOWLEDGMENTS
We thank the referee Santi Roca-F`abrega and the anonymous referee for insightful comments and help- ful suggestions which improved this paper significantly.
J.-S. H. is grateful to Juhan Kim and Yonghwi Kim for helpful discussions. We appreciate Joshua E. Barnes making the ZENO code available and Volker Springel for providing us with GADGET-3. We thank the Korea Institute for Advanced Study for providing computing resources (Higgs Server and KIAS Center for Advanced Computation Linux Cluster System) for this study.
This work was supported by the Basic Science Research Program through the National Research Foundation of Korea (NRF) funded by the Ministry of Education under the Grant Nos. NRF-2018R1D1A1B07048156 (J.-S. Hwang) and NRF-2018R1D1A1B07050701 (J.- S. Hwang), and NRF-2020R1I1A1A01072816 (S.-h.
Nam), and also funded by the Ministry of Science and ICT under the Grant No. 2020R1A2C3009918 (S.-h.
Nam).
Figure 17. Spin angular momentum S(R25) of the stellar bulge (top row), the dark matter halo (middle row), and the disk (bottom row) of the target galaxy as function of time from runs L, LLp and LLr. In the calculation of S(R25), only the mass within R25and |z| ≤ 20 kpc from the center of the target is considered. The left and right columns show the change of S(R25), when all particles are used or when only the particles originally belonging to the target galaxy are used, respectively.
In each panel the vertical dotted line indicates the time of closed approach, t = 4.5 Gyr, of target and companion galaxies in the encounter runs.
APPENDIXA. RUNLLR2
We performed one more simulation, “run LLr2”. The only difference between the initial conditions of this run and run LLr is the direction of the initial spin of the companion galaxy which is counterclockwise in run LLr2. Therefore, when the target and the compan- ion approach each other closely, both galaxies experi- ence the encounter as retrograde.
We present the snapshots (Figures14, and15) and the circular velocity profiles (Figure16) from run LLr2.
Both target and companion galaxies do not develop sub- stantial bridges and tails, as expected. The overall cir- cular velocity of the disk material of the target galaxy does not decrease much after the collision as shown in Figure 16. The total spin angular momentum doubles in this case so that the change of the spin angular mo- mentum is milder than that of run LLr (where the spin sum is subtractive due to the opposite spin directions).
APPENDIXB.
ANGULARMOMENTUM OFVARIOUSCOMPONENTS
In Figure 17 we present the spin angular momentum S(R25) of the various components of the target galaxy from runs L, LLp, and LLr. Most of the spin angular momentum of the target galaxy’s disk is not transferred to different components of the target galaxy; it is likely
to be transferred to the orbital angular momentum of the two interacting galaxies. In order to have full access to the mechanism of angular momentum transfer of in- teracting galaxies, a more extensive analysis is needed.
REFERENCES
Anderson, M. E., & Bregman, J. N. 2010, Do Hot Halos Around Galaxies Contain the Missing Baryons?, ApJ, 714, 320
Barnes, J. E. 2011, ZENO: N -body and SPH Sim- ulation Codes, Astrophysics Source Code Library, ascl:1102.027
Barnes, J. E., & Hibbard, J. E. 2009, Identikit 1: A Model- ing Tool for Interacting Disk Galaxies, AJ, 137, 3071 Barnes, J., & Hut, P. 1986, A Hierarchical O(N log N )
Force-calculation Algorithm, Nature, 324, 446
Brook, C. B., Stinson, G., Gibson, B. K., et al. 2012, Hi- erarchical Formation of Bulgeless Galaxies – II. Redis- tribution of Angular Momentum via Galactic Fountains, MNRAS, 419, 771
Cappellari, M. 2016, Structure and Kinematics of Early- type Galaxies from Integral Field Spectroscopy, ARA&A, 54, 597
Casuso, E., & Beckman, J. E. 2015, On the Origin of the Angular Momentum of Galaxies: Cosmological Tidal Torques Supplemented by the Coriolis Force, MNRAS, 449, 2910
Cervantes-Sodi, B., Hernandez, X., & Park, C. 2010, Clues
Slow Rotators, MNRAS, 414, 888
Gingold R. A., & Monaghan J. J. 1977, Smoothed Par- ticle Hydrodynamics: Theory and Application to Non- spherical Stars, MNRAS, 181, 375
Graham, M. T., Cappellari, M., Li, H., et al. 2018, SDSS- IV MaNGA: Stellar Angular Momentum of about 2300 Galaxies: Unveiling the Bimodality of Massive Galaxy Properties, MNRAS, 477, 4711
Hernquist, L. 1990, An Analytical Model for Spherical Galaxies and Bulges, ApJ, 356, 359
Hoyle, F. 1949, On the Cosmological Problem, MNRAS, 109, 365
Hwang, J.-S., Park, C., & Choi, J.-H. 2013, The Initial Con- ditions and Evolution of Isolated Galaxy Models: Effects of the Hot Gas Halo, JKAS, 46, 1
Hwang, J.-S., & Park, C. 2015, Effects of Hot Halo Gas on Star Formation and Mass Transfer During Distant Galaxy-Galaxy Encounters, ApJ, 805, 131
Hwang, J.-S., Park, C., Banerjee, A., & Hwang, H. S. 2018, Evolution of Late-type Galaxies in a Cluster Environ- ment: Effects of High-speed Multiple Encounters with Early-type Galaxies, ApJ, 856, 160
Katz, N., Weinberg, D. H., & Hernquist, L. 1996, Cosmo- logical Simulations with TreeSPH, ApJS, 105, 19 Kennicutt, R. C. Jr. 1998, The Global Schmidt Law in Star-
forming Galaxies, ApJ, 498, 541
Kim, W.-T., Kim, Y., & Kim, J.-G. 2014, Nature of the Wiggle Instability of Galactic Spiral Shocks, ApJ, 789, 68
Kim, Y., & Kim, W.-T. 2014, Gaseous Spiral Structure and Mass Drift in Spiral Galaxies, MNRAS, 440, 208
ties of Tidal Features in Interacting Disk Galaxies, ApJ, 683, 94
Peebles, P. J. E. 1969, Origin of the Angular Momentum of Galaxies, ApJ, 155, 393
Porciani, C., Dekel, A., & Hoffman, Y. 2002, Testing Tidal- Torque Theory – I. Spin Amplitude and Direction, MN- RAS, 332, 325
Roberts, W. W. 1969, Large-Scale Shock Formation in Spi- ral Galaxies and its Implications on Star Formation ApJ, 158, 123
Rodriguez-Gomez, V., Sales, L. V., Genel, S., et al. 2017, The Role of Mergers and Halo Spin in Shaping Galaxy Morphology, MNRAS, 467, 3083
Springel, V. 2005, The Cosmological Simulation Code GADGET-2, MNRAS, 364, 1105
Springel, V., & Hernquist, L. 2002, Cosmological Smoothed Particle Hydrodynamics Simulations: The Entropy Equa- tion, MNRAS, 333, 649
Springel, V., & Hernquist, L. 2003, Cosmological Smoothed Particle Hydrodynamics Simulations: A Hybrid Multi- phase Model for Star Formation, MNRAS, 339, 289 Tempel, E., Stoica, R. S., & Saar, E. 2013, Evidence for
Spin Alignment of Spiral and Elliptical/S0 Galaxies in Filaments, MNRAS, 428, 1827
von Neumann, J. 1951, in Monte Carlo Method. National Bureau of Standards Appl. Math. Ser. 12 (Washington, DC: US Government Printing Office), 36
White, S. D. M. 1990, Angular Momentum Growth in Pro- togalaxies, ApJ, 286, 38