www.cmj.ac.kr
Growth Hormone Responses to Provocative Tests in Children with Short Stature
Noorisaem Rhee, Ka Young Oh, Eun Mi Yang and Chan Jong Kim*
Department of Pediatrics, Chonnam National University Medical School and Hospital, Gwangju, Korea
Growth hormone deficiency (GHD) is defined as a serum peak GH concentration <10 ng/mL with provocation as tested by a combination of at least two separate tests. The aim of this study was to compare two standard tests, insulin and levodopa (L-dopa), with a primary focus on specificity and accuracy. Clinical data were collected retro- spectively from a review of 120 children who visited the pediatric endocrine clinic at Chonnam National University Hospital for the evaluation of short stature between January 2006 and April 2014. Subjects underwent GH provocation tests with insulin and L-dopa. Blood samples were obtained at 0, 15, 30, 45, 60, 90, and 120 min after administration, and GH levels were measured. In the insulin test, serial glucose levels were also checked, closely monitoring hypoglycemia. A total of 83 children (69.2%) were diagnosed with GHD and 37 children (30.8%) were diagnosed with idiopathic short stat- ure (ISS). Peak GH levels were achieved an average of 45 min after the administration of insulin and L-dopa for both groups. The specificity and accuracy were 78.4% and 93.6%
for the insulin test and 29.7% and 79.2% for L-dopa test, respectively. In the ISS group, the cumulative frequency of a GH cutoff value of >10 ng/mL at 120 min was 75.6% after insulin stimulation compared with 35.1% after L-dopa stimulation. Considering these results, we recommend performing the insulin test first to exclude ISS and then the L-dopa test for the diagnosis of GHD. This way, ISS patients are diagnosed after a single test, thus reducing hospital days and the burden of undergoing two serial tests.
Key Words: Growth hormone; Dwarfism; Child
This is an Open Access article distributed under the terms of the Creative Commons Attribution Non-Commercial License (http://creativecommons.org/licenses/by-nc/3.0) which permits unrestricted non-commercial use, distribution, and reproduction in any medium, provided the original work is properly cited.
Article History:
received 6 March, 2015 revised 31 March, 2015 accepted 3 April, 2015
Corresponding Author:
Chan Jong Kim
Department of Pediatrics, Chonnam National University Medical School and Hospital, 42 Jebong-ro, Dong-gu, Gwangju 501-757, Korea TEL: +82-62-220-6645
FAX: +82-62-222-6103 E-mail: [email protected]
INTRODUCTION
The diagnosis of growth hormone deficiency (GHD) in children with short stature is based on clinical features.
Children with GHD usually present with short stature and a low growth velocity for age and pubertal stage.1,2 Alterna- tive causes of poor growth need to be considered and ex- cluded. One of the normal variants is idiopathic short stat- ure, a group of short children with no definitely recogniz- able underlying disease. It is important to distinguish be- tween the child with GH deficiency and the short normal child.
GH secretion is regulated by multiple physiologic fac- tors, including age, onset of puberty, nutritional status, and body weight.3-6 GH secretion is pulsatile and serum concentrations are low during the daytime. Thus, provoca-
tive tests of GH release, rather than a single basal GH esti- mation, are used to determine GH status. Immunoradio- metric assays (IRMAs) are commonly used to determine the level of GH.7
The standard method for the diagnosis of GH deficiency is to confirm insufficient responses to GH provocation tests. GH deficiency is defined as a serum peak GH concen- tration <10 ng/mL on provocation with a combination of at least two separate stimulation tests.8,9 GH stimulation tests are performed with various stimuli, such as insulin, L-dopa, arginine, and growth hormone releasing hormone (GHRH).10 The test using insulin as a stimulus is classi- cally recommended, but this test has potential risks such as hypoglycemia. In this study, we compared two standard provocation tests, insulin and L-dopa, with a primary focus on specificity, accuracy, and safety.
TABLE 1. Clinical and biochemical parameters of patients with GHD or ISS
GHD group (N=83) ISS group (N=37) p value
Gestational age (wk) Birth weight (kg) Chronological age (yr) Bone age (yr)
CA-BA (yr) Height age (yr) Height SDS MPH (cm) Body weight SDS BMI SDS IGF-1 (ng/mL) IGFBP-3 (ng/mL) Peak GH-L (ng/mL) Peak GH-I (ng/mL)
39.44±2.00 2.98±0.46 9.99±2.60 9.05±2.63 0.69±0.57 7.13±2.29
−2.60±0.08 164.59±6.94
−1.59±0.11
−0.25±0.13 171.86±96.95 2431.40±656.96
5.17±2.63 4.03±2.60
39.56±0.89 3.05±0.48 9.64±2.78 8.61±2.60 0.69±0.81 6.66±2.11
−2.69±0.10 164.73±6.80
−2.31±0.14
−0.98±0.16 170.75±98.60 2677.87±889.49
10.62±8.37 14.71±8.78
0.646 0.473 0.521 0.392 0.998 0.276 0.499 0.920
<0.001 0.001 0.954 0.136
<0.001
<0.001
Values are presented as mean±standard deviation (SD). GHD: growth hormone deficiency, ISS: idiopathic short stature, CA: chrono- logical age, BA: bone age, SDS: standard deviation score, MPH: midparental height, BMI: body mass index, IGF-1: insulin-like growth factor-1, IGFBP-3: IGF binding protein-3, Peak GH-L: L-dopa, Peak GH-I: insulin.
MATERIALS AND METHODS 1. Subjects
This retrospective study was done by reviewing the med- ical records of children who visited the pediatric endocrine clinic at Chonnam National University Hospital. A total of 120 children with short stature who completed a GH stim- ulation test from January 2006 to April 2014 were enrolled in this study. All patients had a height less than the third percentile. Children with central nervous system neo- plasms, multiple pituitary hormone deficiencies, and hy- pothyroidism were excluded. Children who had been tak- ing drugs that may affect endogenous GH secretion, such as antipsychotic drugs and corticosteroids, and children with congenial disorder (e.g., Russel-Silver syndrome) were also excluded.
GH deficiency was defined as a serum peak GH concen- tration <10 ng/mL on provocation with a combination of at least two separate stimulation tests. Idiopathic short stature (ISS) was classified as a height less than the third percentile with a serum peak GH concentration ≥10 ng/mL with provocation.
Data for height, weight, pubertal status, insulin-like growth factor (IGF-1), insulin-like growth factor binding protein (IGFBP)-3, thyroid function, and peak GH levels after stimulation were collected. Pubertal status was as- sessed by Tanner stage of breast development for females and genital development for males. Bone age was eval- uated by the method of Greulich and Pyle.11 All GHD sub- jects had normal magnetic resonance imaging findings of the hypothalamic-pituitary region. This study was ap- proved by the Institutional Review Board of our hospital (CNUH-2014-295).
2. GH stimulation test
After an overnight fast, an intravenous cannula was
inserted. All provocation tests were performed in the morn- ing hours with a 1-day interval between the two stimulation tests. To assess GH secretion, dopamine (SinemetⓇ, MSD, Whitehouse Station, NJ, USA; body weight more than 30 kg, 500 mg; body weight 15 to 30 kg, 250 mg; body weight less than 15 kg, 125 mg of L-dopa) was administered orally.
Blood samples were drawn immediately before the medi- cation and 30, 45, 60, 90, and 120 minutes later to obtain the serum GH concentration for each time point. Insulin (0.1 IU/kg) was administered as an intravenous bolus at time 0 to induce a fall in the blood glucose level to 50 mg/dL or less (or one-half of the baseline glucose level). Blood sam- ples were obtained immediately before injection and at 15, 30, 45, 60, 90, and 120 minutes after injection. No patients were primed with sex steroids before the provocation tests.
3. Hormone assays
GH levels were measured by IRMA with the detection limit of 0.03 IU/mL. The intra-assay coefficients of varia- tion (CVs) were 1.3% to 2.1%, and the inter-assay CVs were 3.8% to 5.0% (Cisbio Bioassays, France). Serum IGF-1 lev- els were measured by using an IRMA with an analytical sensitivity of 2 ng/mL, intra-assay CV of 2.4% to 6.3%, and inter-assay CV of 5.3% to 6.8% (IRMA IGF-1, Immunotech, Czech Republic). Serum IGFBP-3 levels were measured by using an IRMA with an analytical sensitivity of 50 ng/mL, intra-assay CV of 4.6% to 10.2%, and inter-assay CV of 6.3%
to 12.4% (IDS S.A, Belgium).
4. Analysis
Categorical data were described as number (percentage) and continuous data were presented as the mean±standard deviation (SD). Comparisons between groups were per- formed by using independent-sample t-tests. Statistical significance was defined as p<0.05. Statistical analysis was performed by using SPSS (version 22.0; SAS Institute,
FIG. 1. Comparison of peak GH concentrations following L-dopa (A) and insulin (B) stimulation tests between the GHD patients (n=83) and the ISS patients (n=37). Box-plots show the median, interquartile range, outliers, and extreme cases. GH: growth hormone, GHD:
growth hormone deficiency, ISS: idiopathic short stature.
FIG. 2. Comparison of GH concentrations at each time point after L-dopa (A) and insulin (B) stimulation tests between the GHD and ISS patients. Data are presented as median and 95% confidence interval (CI). GH: growth hormone, GHD: growth hormone deficiency, ISS: idiopathic short stature.
Chicago, IL, USA) and GraphPad Prism (version 5;
GraphPad Software Inc, La Jolla, CA, USA). Specificity was defined as the number of true negative results divided by the total number of results. Accuracy was defined as the number of correct results divided by the total number of tests.
RESULTS
1. Subjects’ characteristics
The clinical and laboratory data are summarized in Table 1. Of the 120 children who underwent the GH stim- ulation test, 83 children (69.2%) were diagnosed with GHD and 37 children (30.8%) were diagnosed with ISS. A total of 83 children (69.2%) were boys and 37 (30.8%) were girls.
The mean age of the children was 9.99±2.60 years in the GHD group and 9.64±2.78 years in the ISS group. A total of 92 children (76.7%) were prepubertal (Tanner stage 1) and 28 children (23.3%) were pubertal (Tanner stage 2 or 3). The IGF-1 and IGFBP-3 level of the patients at the time
of the stimulation test showed no significant difference in either group. In the GHD group, the mean IGF-1 level was 171.86±96.95 ng/mL, similar to that in the ISS group (170.75±98.60 ng/mL, p=0.954).
The mean body weight standard deviation score (SDS) of the GHD group was −1.59±0.11, which was higher than that of the ISS group of −2.31±0.14, which was a statisti- cally significant difference (p<0.001). Also, the mean body mass index (BMI) SDS of the GHD group was higher (−
0.25±0.13) than the mean BMI SDS of the ISS group (−
0.98±0.16, p=0.001; Table 1).
2. Comparison of peak GH levels
Peak GH levels were achieved on average 45 min after the administration of insulin and L-dopa in both groups.
In the test with insulin (peak GH-I), the mean peak GH lev- el of the ISS group (14.71±8.78 ng/mL) was significantly higher than that of the GHD group (4.03±2.60 ng/mL, p
<0.001). Also, in the test with L-dopa (peak GH-L), the mean peak GH level of the ISS group (10.62±8.37 ng/mL)
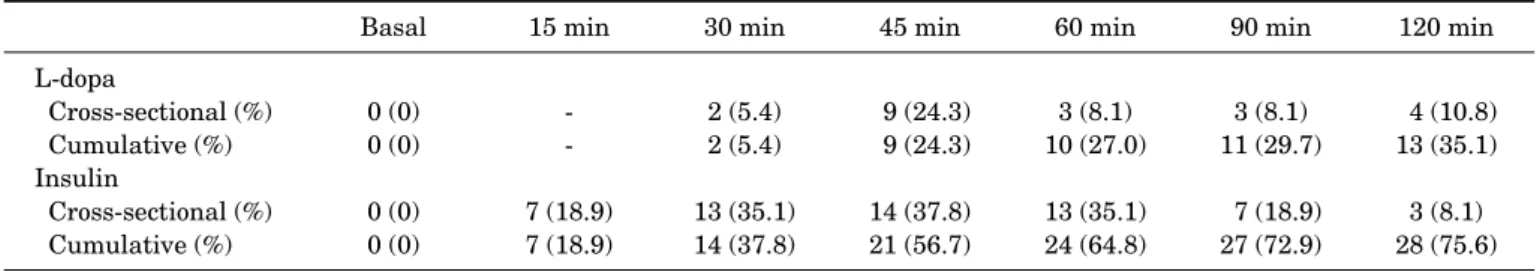
TABLE 2. Frequency (%) of a growth hormone cutoff value of >10 ng/mL at each time point during the L-dopa and insulin stimulation test in patients with idiopathic short stature
Basal 15 min 30 min 45 min 60 min 90 min 120 min
L-dopa
Cross-sectional (%) Cumulative (%) Insulin
Cross-sectional (%) Cumulative (%)
0 (0) 0 (0) 0 (0) 0 (0)
- - 7 (18.9) 7 (18.9)
2 (5.4) 2 (5.4) 13 (35.1) 14 (37.8)
9 (24.3) 9 (24.3) 14 (37.8) 21 (56.7)
3 (8.1) 10 (27.0) 13 (35.1) 24 (64.8)
3 (8.1) 11 (29.7) 7 (18.9) 27 (72.9)
4 (10.8) 13 (35.1) 3 (8.1) 28 (75.6)
TABLE 3. Comparison of specificity and accuracy of insulin and L-dopa stimulation test
Specificity (%) Accuracy (%) Insulin
L-Dopa
78.4 29.7
93.6 79.2
was significantly higher than that of the GHD group (5.17±
2.63 ng/mL, p<0.001; Fig. 1).
The mean peak time was on average 45 min for both groups for both tests. We also compared the peak GH con- centrations versus time after the L-dopa and insulin stim- ulation tests between the GHD and ISS patients (Fig. 2).
In both tests, the peak GH concentration was much higher in the ISS group.
Table 2 shows the differences between the cross-sectional and cumulative frequency of a GH cutoff value of >10 ng/mL at each time point during the insulin and L-dopa stimulation tests in ISS patients. The cumulative fre- quency at 120 min was 75.6% after insulin stimulation compared with 35.1% after L-dopa.
Also, we compared the specificity and accuracy of the two tests. In the case of insulin, the specificity was 78.4% and the accuracy was 93.6%. On the other hand, the specificity for the L-dopa stimulation test was 29.7% and the accuracy was 79.2% (Table 3).
DISCUSSION
Children with short stature visit the outpatient depart- ment for the evaluation of short stature and reduced growth velocity. The diagnosis of GHD is classically based on clinical features, but can only be confirmed by a GH stim- ulation test using different stimuli.12 Because GH secretion is regulated by multiple physiologic factors, including age, onset of puberty, nutritional status, and body weight, the reliability of the pharmacological tests used for the evalua- tion of GH secretion has been repeatedly questioned.13,14 However, the GH stimulation test is still considered to be the gold standard when diagnosing GHD. It is defined as a serum peak GH concentration <10 ng/mL on provocation with the combination of at least two separate stimulation tests.15-17
Classically, a child whose height is below the third per-
centile will undergo a GH stimulation test using L-dopa and insulin. A diagnosis is made by assessing the peak GH level.18 If the peak GH level is higher than 10 ng/mL, at any time point on a single test, the child is diagnosed as having ISS.19,20 In both tests with L-dopa and insulin, the mean peak GH level of ISS children was significantly higher than that of the children with GHD.
A relationship exists between body weight, BMI, and GHD. The mean body weight SDS of the GHD group was
−1.59±0.11, which was higher than that of the ISS group of −2.31±0.14 (p<0.001), and the mean BMI SDS of the GHD group was higher (−0.25±0.13) than that of the ISS group (−0.98±0.16, p=0.001). According to a recent study, BMI is one of the predictors of peak GH.21 Stanley et al. dem- onstrated that the peak GH response to a provocative test decreases with increasing BMI SDS in healthy children with short stature.22 A higher BMI is associated with lower GH secretion.23-25
The peak GH concentration was higher in the ISS group but the time to the peak GH level was similar in both groups (mean peak time of 45 min). There were differences be- tween the cross-sectional and cumulative frequency of the GH cutoff value of >10 ng/mL at each time point during the insulin and L-dopa stimulation tests in ISS patients.
As shown in Tables 2 and 3, the cumulative frequency at 120 min was 75.6% after insulin stimulation compared with 35.1% after L-dopa stimulation. Thus, we suppose that the stimulation test with insulin is better for diagnos- ing ISS than the test with L-dopa.
One of the most important results of this study was the difference in specificity and accuracy between the two prov- ocation tests (Table 3). Also, the frequency (%) of a GH con- centration >10 ng/mL in the ISS group was higher with the insulin test (75.6%) than with the L-dopa test (35.1%).
This result suggests that it would be beneficial to perform the ISS test first before the L-dopa test. In this way, ISS patients who show a peak GH >10 ng/mL can be ruled out by use of a single test.
The provocation tests have some side effects because of the drugs used as stimuli.26 L-Dopa can cause adverse re- actions, commonly gastrointestinal problems (e.g., nau- sea, vomiting), and insulin has the potential to induce seri- ous hypoglycemia. Thus, close monitoring for adverse re- actions, especially for hypoglycemia during a provocation test using insulin, is needed.27,28 In our study, among the
120 patients who underwent the insulin stimulation test, the lowest serum glucose level was less than 40 mg/dL in 58 patients, and 119 patients showed a glucose concen- tration under 50 mg/dL. The mean glucose level was 38.5 mg/dL. In a total of 71 patients (59.1%), the lowest glucose level was recorded at 20 min after insulin administration (mean, 21.6 min). The most common hypoglycemic symp- tom was dizziness, and these patients recovered soon after drinking juice or eating candy. However, one patient with serious hypoglycemia (serum glucose, 21 mg/dL) showed mental change (drowsy mental status) and recovered after intravenous administration of 10% dextrose water.
Considering the outcomes, although the insulin test has the potential to evoke hypoglycemia, we suggest perform- ing the insulin stimulation test first to rule out ISS (with close monitoring for hypoglycemic symptoms) and then the L-dopa test for the remaining patients to confirm the GHD.
This is cost-effective because the diagnosis of ISS can be made shortly after a single test. Also, the burden of doing two serial tests is reduced.
CONFLICT OF INTEREST STATEMENT None declared.
REFERENCES
1. Carel JC, Tresca JP, Letrait M, Chaussain JL, Lebouc Y, Job JC, et al. Growth hormone testing for the diagnosis of growth hor- mone deficiency in childhood: a population register-based study.
J Clin Endocrinol Metab 1997;82:2117-21.
2. Cacciari E, Tassoni P, Cicognani A, Pirazzoli P, Salardi S, Balsamo A, et al. Value and limits of pharmacological and physiological tests to diagnose growth hormone (GH) deficiency and predict therapy response: first and second retesting during replacement therapy of patients defined as GH deficient. J Clin Endocrinol Metab 1994;79:1663-9.
3. Maghnie M, Strigazzi C, Tinelli C, Autelli M, Cisternino M, Loche S, et al. Growth hormone (GH) deficiency (GHD) of childhood on- set: reassessment of GH status and evaluation of the predictive criteria for permanent GHD in young adults. J Clin Endocrinol Metab 1999;84:1324-8.
4. Rose SR, Municchi G, Barnes KM, Kamp GA, Uriarte MM, Ross JL, et al. Spontaneous growth hormone secretion increases dur- ing puberty in normal girls and boys. J Clin Endocrinol Metab 1991;73:428-35.
5. Volta C, Bernasconi S, Iughetti L, Ghizzoni L, Rossi M, Costa M, et al. Growth hormone response to growth hormone-releasing hor- mone (GHRH), insulin, clonidine and arginine after GHRH pre- treatment in obese children: evidence of somatostatin increase?
Eur J Endocrinol 1995;132:716-21.
6. Corneli G, Di Somma C, Baldelli R, Rovere S, Gasco V, Croce CG, et al. The cut-off limits of the GH response to GH-releasing hor- mone-arginine test related to body mass index. Eur J Endocrinol 2005;153:257-64.
7. Ghigo E, Bellone J, Aimaretti G, Bellone S, Loche S, Cappa M, et al. Reliability of provocative tests to assess growth hormone se-
cretory status. Study in 472 normally growing children. J Clin Endocrinol Metab 1996;81:3323-7.
8. Hanew K, Utsumi A. The role of endogenous GHRH in arginine-, insulin-, clonidine- and l-dopa-induced GH release in normal subjects. Eur J Endocrinol 2002;146:197-202.
9. Hilczer M, Smyczynska J, Lewinski A. Limitations of clinical util- ity of growth hormone stimulating tests in diagnosing children with short stature. Endocr Regul 2006;40:69-75.
10. Martha PM Jr, Gorman KM, Blizzard RM, Rogol AD, Veldhuis JD. Endogenous growth hormone secretion and clearance rates in normal boys, as determined by deconvolution analysis: rela- tionship to age, pubertal status, and body mass. J Clin Endocrinol Metab 1992;74:336-44.
11. Greulich WW, Pyle SI. Radiographic atlas of skeletal develop- ment of the hand and wrist. 2nd ed. Stanford:Stanford University Press,1959.
12. Garcia-Mayor RV, Andrade MA, Rios M, Lage M, Dieguez C, Casanueva FF. Serum leptin levels in normal children: relation- ship to age, gender, body mass index, pituitary-gonadal hormones, and pubertal stage. J Clin Endocrinol Metab 1997;82:2849-55.
13. Albertsson-Wikland K, Rosberg S, Karlberg J, Groth T. Analysis of 24-hour growth hormone profiles in healthy boys and girls of normal stature: relation to puberty. J Clin Endocrinol Metab 1994;78:1195-201.
14. Mazzola A, Meazza C, Travaglino P, Pagani S, Frattini D, Bozzola E, et al. Unreliability of classic provocative tests for the diagnosis of growth hormone deficiency. J Endocrinol Invest 2008;31:159-62.
15. Zadik Z, Chalew SA, Gilula Z, Kowarski AA. Reproducibility of growth hormone testing procedures: a comparison between 24-hour integrated concentration and pharmacological stimulation. J Clin Endocrinol Metab 1990;71:1127-30.
16. Growth Hormone Research Society. Consensus guidelines for the diagnosis and treatment of growth hormone (GH) deficiency in childhood and adolescence: summary statement of the GH Research Society. GH Research Society. J Clin Endocrinol Metab 2000;85:3990-3.
17. Song AK, Kim HJ, Suk HJ, Hwang JS, Hong CH. Serum IGF-I and IGFBP-3 in 919 healthy Korean children and adolescents: normal values and correlations with age, sex, height, body mass index and bone age. J Korean Soc Pediatr Endocrinol 2005;10:35-41.
18. Maghnie M, Valtorta A, Moretta A, Larizza D, Preti P, Palladini G, et al. Diagnosing growth hormone deficiency: the value of short- term hypocaloric diet. J Clin Endocrinol Metab 1993;77:1372-8.
19. Loche S, Guzzetti C, Pilia S, Ibba A, Civolani P, Porcu M, et al.
Effect of body mass index on the growth hormone response to clo- nidine stimulation testing in children with short stature. Clin Endocrinol (Oxf) 2011;74:726-31.
20. Lee HS, Hwang JS. Influence of body mass index on growth hor- mone responses to classic provocative tests in children with short stature. Neuroendocrinology 2011;93:259-64.
21. Lee J, Yoon J, Kang MJ, Lee YA, Lee SY, Shin CH, et al. Influence of body mass index on the growth hormone response to provocative testing in short children without growth hormone deficiency. J Korean Med Sci 2013;28:1351-5.
22. Stanley TL, Levitsky LL, Grinspoon SK, Misra M. Effect of body mass index on peak growth hormone response to provocative test- ing in children with short stature. J Clin Endocrinol Metab
2009;94:4875-81.
23. Loche S, Guzzetti C, Pilia S, Ibba A, Civolani P, Porcu M, et al.
Effect of body mass index on the growth hormone response to clo- nidine stimulation testing in children with short stature. Clin Endocrinol (Oxf) 2011;74:726-31.
24. Qu XD, Gaw Gonzalo IT, Al Sayed MY, Cohan P, Christenson PD, Swerdloff RS, et al. Influence of body mass index and gender on growth hormone (GH) responses to GH-releasing hormone plus arginine and insulin tolerance tests. J Clin Endocrinol Metab 2005;90:1563-9.
25. Colao A, Di Somma C, Savastano S, Rota F, Savanelli MC, Aimaretti G, et al. A reappraisal of diagnosing GH deficiency in
adults: role of gender, age, waist circumference, and body mass index. J Clin Endocrinol Metab 2009;94:4414-22.
26. Moon JS, Lee SY, Nam CM, Choi JM, Choe BK, Seo JW, et al. 2007 Korean National Growth Charts: review of developmental proc- ess and an outlook. Korean J Pediatr 2008;51:1-25.
27. Biller BM, Samuels MH, Zagar A, Cook DM, Arafah BM, Bonert V, et al. Sensitivity and specificity of six tests for the diagnosis of adult GH deficiency. J Clin Endocrinol Metab 2002;87:2067-79.
28. Shalet SM, Toogood A, Rahim A, Brennan BM. The diagnosis of growth hormone deficiency in children and adults. Endocr Rev 1998;19:203-23.