Introduction
Radiopacity is a prerequisite of dental materials, specifi- cally for the restorative composite resins.1Indeed, contrast- ing with the adjacent recurrent caries and other applied dental materials, over hangs, and voids would be more feasible when a dental material with adequate radiopacity is used.2-4 By the most recent recommendation of ISO 40490:2009, a 1-mm thick sample of dental material should have a radiopacity equal to or greater than a 1-mm-thick
sample of aluminum.1
Various researchers have attempted to describe and com- pare the radiopacity of dental materials in terms of their type (e.g., prosthetic crown, implant cement, composites, endodontic sealers, endodontic core material, dowel core, and core build-ups),5-10processing (e.g., digital, digitalized, and conventional film),11-14device setup parameters (e.g., exposure time, voltage, and target-tube distance),2,6,11and environmental effects (e.g., radiotherapy).15
Briefly, there have been different methods for assessing the radiopacity of dental materials including densitometer, digital or digitalized radiography by means of an aluminum stepwedge or the attenuation coefficient method.2,11Accord- ing to ISO 4049:2009, a monochromatic X-ray source per- forming within the range of 65±5 kVp using a D-speed
Assessment of radiopacity of restorative composite resins with various target distances and exposure times and a modified aluminum step wedge
Arash Poorsattar Bejeh Mir, Morvarid Poorsattar Bejeh Mir*
Dentistry Student Research Committee (DSRC), Dental Materials Research Center, Dentistry School, Babol University of Medical Sciences, Babol, Iran
*Private Practice of Orthodontics, Montreal, Quebec, Canada ABSTRACT
Purpose: ANSI/ADA has established standards for adequate radiopacity. This study was aimed to assess the changes in radiopacity of composite resins according to various tube-target distances and exposure times.
Materials and Methods: Five 1-mm thick samples of Filtek P60 and Clearfil composite resins were prepared and exposed with six tube-target distance/exposure time setups (i.e., 40 cm, 0.2 seconds; 30 cm, 0.2 seconds; 30 cm, 0.16 seconds, 30 cm, 0.12 seconds; 15 cm, 0.2 seconds; 15 cm, 0.12 seconds) performing at 70 kVp and 7 mA along with a 12-step aluminum stepwedge (1 mm incremental steps) using a PSP digital sensor. Thereafter, the radiopacities measured with Digora for Windows software 2.5 were converted to absorbencies (i.e., A==-log (1-G/255)), where A is the absorbency and G is the measured gray scale). Furthermore, the linear regression model of aluminum thick- ness and absorbency was developed and used to convert the radiopacity of dental materials to the equivalent aluminum thickness. In addition, all calculations were compared with those obtained from a modified 3-step stepwedge (i.e., using data for the 2nd, 5th, and 8th steps).
Results: The radiopacities of the composite resins differed significantly with various setups (p⁄0.001) and between the materials (p⁄0.001). The best predicted model was obtained for the 30 cm 0.2 seconds setup (R2==0.999). Data from the reduced modified stepwedge was remarkable and comparable with the 12-step stepwedge.
Conclusion: Within the limits of the present study, our findings support that various setups might influence the radiopacity of dental materials on digital radiographs. (Imaging Sci Dent 2012; 42 : 163-7)
KEY WORDS: Composite Resins; Radiography, Dental, Digital; Dental Materials; Linear Models
Received April 12, 2012; Revised June 15, 2012; Accepted July 23, 2012 Correspondence to : Dr. Arash Poorsattar Bejeh Mir
Dentistry Student Research Committee (DSRC), Dental Materials Research Center, Babol University of Medical Sciences, Ganj Afrooz Ave., Babol, Mazandaran Province, Iran
Tel) 98-151-321-6383, Fax) 98-151-321-6383, E-mail) [email protected]
Copyright ⓒ 2012 by Korean Academy of Oral and Maxillofacial Radiology
This is an Open Access article distributed under the terms of the Creative Commons Attribution Non-Commercial License (http://creativecommons.org/licenses/by-nc/3.0) which permits unrestricted non-commercial use, distribution, and reproduction in any medium, provided the original work is properly cited.
Imaging Science in Dentistry∙pISSN 2233-7822 eISSN 2233-7830
and #4 sized film should be applied. Moreover, the step- wedge should have a purity of at least 98% aluminum, not consisting of more than 0.1% copper or 1% iron.1
Nearly all of the existing investigations have devoted most of their attention to adopting the minimum radiopacity requirement; meanwhile, there was only a very small group of studies that has critically evaluated the consequent changes in composite resins’ radiopacity in the case of violation of other ISO 40490:2009 assumptions.2,6,11 The aim of the present study was to evaluate the effect of setup changes in terms of exposure time and tube-target distance on digital radiopacity of composite resins applying a pho- tostimulable phosphor (PSP) plate.
Materials and Methods
Sample preparation
One-millimeter-thick samples of Filtek P60 (3M/ESPE, St. Paul, MN, USA) and Clearfil (Kuraray, Tokyo, Japan) composite resins were prepared (i.e., five samples of each composite resin with A2shade). Samples were made using a 15×15×1 mm brass mold. Five samples of each com- posite resin were created in order to reduce the sampling bias. Thereafter, each sample was light cured with a quartz- tungsten-halogen (QTH) device and a continuous 400 mW/
cm2intensity was applied. In addition, a 12-step wedge (1 mm incremental steps) was made from a 93%-pure alu- mina alloy ingot (Radravesh Shomal Co., Babolsar, Iran).
Deficient samples with large apparent voids in radiography were replaced by sound ones. An attempt was made to keep the sensor perpendicular to the tube direction in order to reduce the heel effect.
Digital radiopacity calculation
Various sets (each composed from a random selection of three samples) were exposed along with the 12-step aluminum step wedge and six different target exposure time/target distance setups (i.e., setup 1: 40 cm, 0.2 seconds;
setup 2: 30 cm, 0.2 seconds; setup 3: 30 cm, 0.16 seconds, setup 4: 30 cm, 0.12 seconds; setup 5: 15 cm, 0.2 seconds;
setup 6: 15 cm, 0.12 seconds). All of the digital radiographs were taken using a dental X-ray device (Minray, Soredex, Tuusula, Finland) performing at 70 kVp, 7 mA with total filtration of 2 mm aluminum. An occlusal PSP digital sen- sor (Soredex, Tuusula Finland) was applied. The captured images were processed by a Digora PCT device (Soredex, Tuusula, Finland) with 40-85μm pixel size, 4-6 lp/mm
and 16 bit color depth. The pictures were saved as bitmap images and viewed on a monitor with 15 inch, 32 bit color depth and 1024×768 screen resolution (Syncmaster Dfx 1793, Samsung, Seoul Korea). Digital radiopacities were measured and read in Digora for Windows 2.5 software (Soredex, Tuusula, Finland) at the program default status with no enhancement or further manipulation of contrast.
The radiopacities were measured from five different areas (i.e., four corner poles plus the central area), each with a 40×40 pixel area, in order to reduce the measurement bias.
Then, the average calculated radiopacity of each sample was taken into account. Thereafter, the obtained radiopaci- ties were transformed to the final digital radiopacity (absor- bance) using the following equation: A==-log (T)==-log (1-G/255); where A was the absorbance, T was the trans- mission, and G was the gray scale (0-255).11For each set of exposure time/tube-target distance, the radiopacity of aluminum alloy was plotted against the corresponding thickness and a specific linear model was calculated. Brie- fly, the Y==a++bX equation was obtained from plotting the radiopacity of aluminum steps against their thickness, where
“Y” was the radiopacity, “a” was the constant of regres- sion, “b” was the coefficient of the line and “X” was the thickness. Equivalent aluminum thickness of each compo- site resin sample (X) specific for each setup was calculated by the transformed equation of [(Y-a)/b]. The reliability of the aforementioned software was measured by retesting the random specimens and comparison to the previous measures after two weeks. Also, the reliability of the device and method had been previously investigated.16
Statistics
Equivalent aluminum thicknesses were expressed as mean (±standard deviation). Comparison of equivalent aluminum thickness by different setups and dental materials was performed by means of a general linear model (GLM) and univariate ANOVA. The homogeneity of variances was tested with further multiple comparisons by Games- Howell. A linear regression model was built for each spe- cific setup. The model descriptive was reported as “a” and
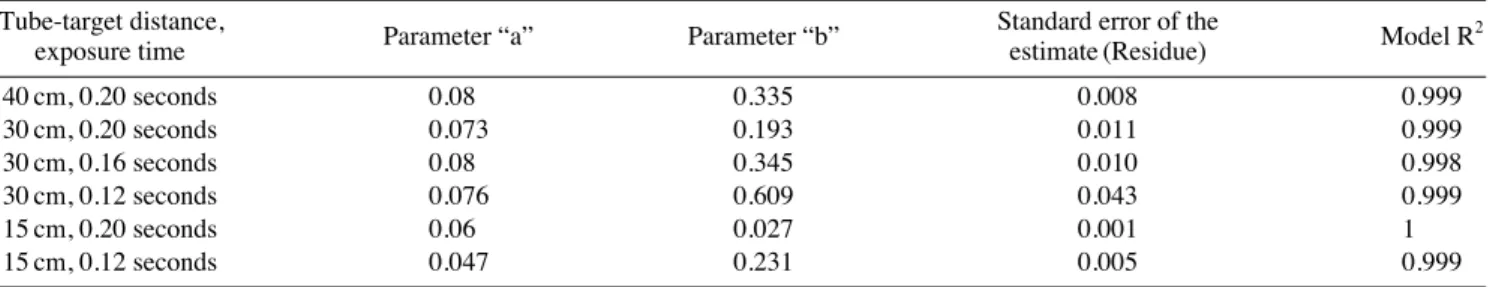
“b” parameter and model fit determined to be R2and the standard error of the estimate. For the assessment of the relationship between the steps and corresponding model errors, various thicknesses of the aluminum step wedge were plotted against studentized residues. Furthermore, to evaluate the hypothesis of accuracy of the reduced step wedge, all analyses were again performed using the infor- mation of only the 2nd, 5th, and 8th steps.
Results
The measured equivalent thicknesses of Filtek P60 and Clearfil samples exposed with various setups are displayed in Table 1. There were significant differences (R2==0.905) in equivalent thickness observed for various setups (F (5, 11)==64.093, p⁄0.001) and between the materials (F (1, 11)==86,449, p⁄0.001). Also, a significant interaction of the material with the setup existed (F (5, 11)==9.58, p⁄
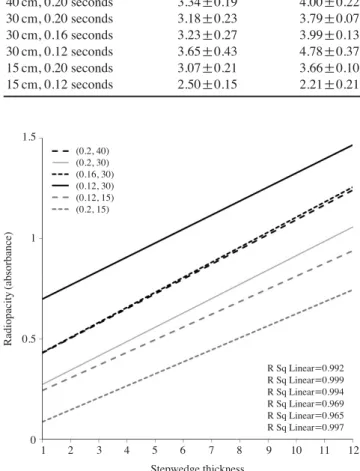
0.001). The post-hoc analyses revealed that the equivalent thicknesses of dental materials were significantly lower at an exposure time of 0.12 second and a distance of 15 cm than at the other setups (p⁄0.001). Linear regression mod- els from plotting of incremental steps of the aluminum stepwedge thicknesses against the relevant digital radio- pacities are shown in Figure 1 and Table 2. Regression analyses for the reduced stepwedge are demonstrated in
Table 3. Moreover, the distribution of the average magni- tude of the errors over the different thicknesses of the stepwedge with an acquired R2==0 is plotted in Figure 2.
All measures were performed by a single researcher and the calculated intra-observer R2==0.56 was observed.
Discussion
The present study investigated the changes in the digital radiopacities of a composite resin according to the expo- sure time and/or tube-target distance. Our findings revealed that manipulation of these parameters could remarkably alter the obtained radiopacity. Considerable regression models obtained from the various setups confirmed that linear regression of aluminum thickness and equivalent radiopacity/absorbance was a reliable method. Gu et al similarly clarified this conclusion.11The obtained equation from a 4th degree polynomial curve was slightly better
Table 1.Equivalent thickness of FiltekP60 and Clearfil measured at various exposure time and target distance designs
(unit: mm, mean±SD) Tube-target distance,
FiltekP60 Clearfil
exposure time
40 cm, 0.20 seconds 3.34±0.19 4.00±0.22
30 cm, 0.20 seconds 3.18±0.23 3.79±0.07
30 cm, 0.16 seconds 3.23±0.27 3.99±0.13
30 cm, 0.12 seconds 3.65±0.43 4.78±0.37
15 cm, 0.20 seconds 3.07±0.21 3.66±0.10
15 cm, 0.12 seconds 2.50±0.15 2.21±0.21
Table 2.Descriptive equations calculated for various distance/ex- posure time setups for aluminum step wedge
Tube-target distance, Parameter Parameter Standard error of the estimate
exposure time “a” “b” (Residue)
40 cm, 0.20 seconds 0.074 0.356 0.025
30 cm, 0.20 seconds 0.072 0.2 0.009
30 cm, 0.16 seconds 0.075 0.357 0.022
30 cm, 0.12 seconds 0.07 0.628 0.047
15 cm, 0.20 seconds 0.06 0.026 0.012
15 cm, 0.12 seconds 0.063 0.178 0.045
a: model coefficient, b: model constant
Radiopacity(absorbance)
1.5
1
0.5
01 2 3 4 5 6 7 8 9 10 11 12
Stepwedge thickness
R Sq Linear==0.992 R Sq Linear==0.999 R Sq Linear==0.994 R Sq Linear==0.969 R Sq Linear==0.965 R Sq Linear==0.997 (0.2, 40)
(0.2, 30) (0.16, 30) (0.12, 30) (0.12, 15) (0.2, 15)
Fig. 1.Linear models with corresponding R2obtained from various distance/exposure time setups for aluminum step wedge.
Standardized residual
2
1
0
-1
-2 1 2 3 4 5 6 7 8 9 10 11 12
Stepwedge thickness
Fig. 2.Magnitude of residue for corresponding thickness of alu- minum stepwedge.
R Sq Linear==0
than that of the linear regression model. This is probably due to the bresmsstrahlaung phenomenon that inevitably induces some polychromatic bands, which may explain the small superiority of non-linear models over the linear model.11 Moreover, even with a standard (¤98% purity) stepwedge, such small differences were previously reported and expected.11In addition, when the whole area was uni- formly irradiated with almost parallel beams, it lowered the error of the 30 cm and 0.2 seconds setup when com- pared with the same exposure time with a target-tube dis- tance of 15 cm. This might be explained by the fact that the sensor was more uniformly irradiated over the whole surface when more parallel beams reached its surface with d==30 cm; meanwhile, a distance of 15 cm was not far enough for the exiting rays to change from divergent to a more parallel form.11Our study had some limitations. In- consonant with ISO4049 specifications, the aluminum stepwedge that we used was only 93% pure. However, previously, Watts and McCabe disputed that the results of stepwedge were heavily related to its purity, and non-stan- dard stepwedges have been widely applied in research.17 Also, Nomoto et al claimed that this method was not sui- table for materials with low radiopacity.18 According to the negligible residue of 0.047, the results from our low purity aluminum stepwedges may be satisfactorily reliable.
The main reason for using such a low purity stepwedge in the present study was the lack of access to a high-purity one.
In addition to the low-purity stepwedge, another violation of ISO4049 specifications was that we used a digital sys- tem instead of conventional films. Based on the confir- matory results of previous studies, we opted to apply a digital system.2,11,19The current specifications did not include any parts specified for a digital sensor, which is recommended to be improved, as digital systems have been becoming more popular for reduced patient dose, convenient film processing, and options for manipulating
films for better visualizing the area of interest.2,11
Based on ISO4049, the aluminum stepwedge should be made from a single block, or alternatively several 1-mm thick strips of aluminum could be attached together to decrease the processing cost.1,11More feasibly, a modified stepwedge with reduced steps might be applicable, first proposed by Gu et al.11We recalculated our models based on data of 2nd, 5th, and 8th steps of the stepwedge. Sur- prisingly, the model errors were reduced when compared to that obtained from the 12-step aluminum stepwedge.
Some processing deficits within higher steps might be responsible for such contrasting data.
Unlike Gu et al11and Sur et al,2we determined that the setup changes had influenced the effect on the radiopaci- ties of dental materials. Applying a charge-coupled device (CCD), Gu et al11concluded that altering the exposure time and tube-target distance would not significantly change the radiopacity.11Moreover, using D, E, and F speed films and by means of the attenuation coefficient method, Sur et al reported that the different exposure times would not remarkably modify the radiopacity of dental materials.2 Notably, they did not consider target-tube distance as ano- ther confounder. Hence, their findings were limited by a fixed distance for various exposure times.
The latitude of the CCD and complementary metal oxide semiconductor sensor (CMOS) receptors, similar to con- ventional films, are limited, and they cover 0.5-2.5 on the scale of optical density. PSP devices, however, provide a wider range and higher latitude in addition to the linear correlation between the exposure and the gray scale (0-5 on the scale of optical density).20 This major difference may provide a rationale for the significant differences in radiopacities assessed with different setups as compared to the insignificant changes using a CCD receptor and conventional films applied by Gu et al11and Sur et al.2
The present study supported the reliability of a PSP device to detect the radiopacity of dental materials equi-
Table 3. Descriptive equations calculated for various distance/exposure time setups for using data from 2nd, 5th, and 8th steps of the aluminum stepwedge
Tube-target distance,
Parameter “a” Parameter “b” Standard error of the
Model R2
exposure time estimate (Residue)
40 cm, 0.20 seconds 0.08 0.335 0.008 0.999
30 cm, 0.20 seconds 0.073 0.193 0.011 0.999
30 cm, 0.16 seconds 0.08 0.345 0.010 0.998
30 cm, 0.12 seconds 0.076 0.609 0.043 0.999
15 cm, 0.20 seconds 0.06 0.027 0.001 1
15 cm, 0.12 seconds 0.047 0.231 0.005 0.999
a: model coefficient, b: model constant
valent to a maximum 12th step radiopacity (absorbance of 1.5, data not shown). The mean residual error exhibited that these measures were widely reliable, accounting for all steps (Fig. 2). Nevertheless, ongoing production of highly opaque materials (e.g., endodontic sealer with 11 mm aluminum equivalent radiopacity) should be taken into account when a digital system with limited gray scale range of 0-255 was considered for the assessment of radio- pacity.11
Further, triple modification of kVp, exposure time, and tube-target distance would better determine how a practi- tioner should modify other parameters in the case of altera- tions of the rest. As another suggestion, simultaneous inves- tigation of all digital systems including CCD, CMOS, and PSP with conventional films compared to a radiodensito- meter might improve our understanding of how these var- ious devices could be differentiated from each other to quantify the radiopacity of dental materials.
In conclusion, based on our findings, we were able to determine that the tube-target distance and exposure time might considerably change the calculated digital radiopacity of dental materials, when a PSP sensor was used. In addi- tion, a modified aluminum stepwedge with reduced steps could be reliably used to calculate the radiopacity more economically than a standard step wedge.
Acknowledgements
Our special thanks to Dr. Sina Haghanifar and Dr. Farida Abesi, assistant professors in the Dentomaxillofacial Radio- logy Department for their support. We want to express our appreciation to Dr. Homayoon Alaghemand, Dean of the Dental Materials Research Center, for providing com- posite resins. Also, we would like to acknowledge Mr.
Akbarein (CEO, Radravesh Shomal Co., Babolsar, Iran) for his kindness in preparing the stepwedge.
References
1. International Organization for Standardization. ISO 4049:
2009. Dentistry-Polymer based restorative materials, 4th ed.
Geneva: ISO; 2009.
2. Sur J, Endo A, Matsuda Y, Itoh K, Katoh T, Araki K, et al. A measure for quantifying the radiopacity of restorative resins.
Oral Radiol 2011; 27 : 22-7.
3. Wenzel A, Hintze H, Hørsted-Bindslev P. Discrimination between restorative dental materials by their radiopacity mea- sured in film radiographs and digital images. J Forensic Odon- tostomatol 1998; 16 : 8-13.
4. Pedrosa RF, Brasileiro IV, dos Anjos Pontual ML, dos Anjos Pontual A, da Silveira MM. Influence of materials radiopacity in the radiographic diagnosis of secondary caries: evaluation in film and two digital systems. Dentomaxillofac Radiol 2011;
40 : 344-50.
5. Martinez-Rus F, Garcia AM, de Aza AH, Pradies G. Radiopa- city of zirconia-based all-ceramic crown systems. Int J Pros- thodont 2011; 24 : 144-6.
6. Wadhwani C, Hess T, Faber T, Piñeyro A, Chen CS. A descrip- tive study of the radiographic density of implant restorative cements. J Prosthet Dent 2010; 103 : 295-302.
7. Ergücü Z, Türkün LS, Onem E, Güneri P. Comparative radio- pacity of six flowable resin composites. Oper Dent 2010; 35 : 436-40.
8. Yesilyurt C, Yildirim T, Er K. Evaluation of the radiopacity of new root canal paste/sealers by digital radio- graphy. J Endod 2008; 34 : 1388-90.
9. Bodrumlu E, Gungor K. Radiopacity of an endodontic core material. Am J Dent 2009; 22 : 157-9.
10. Rasimick BJ, Gu S, Deutsch AS, Musikant BL. Measuring the radiopacity of luting cements, dowels, and core build-up materials with a digital radiography system using a CCD sen- sor. J Prosthodont 2007; 16 : 357-64.
11. Gu S, Rasimick BJ, Deutsch AS, Musikant BL. Radiopacity of dental materials using a digital X-ray system. Dent Mater 2006; 22 : 765-70.
12. Tanomaru-Filho M, da Silva GF, Duarte MA, Gonçalves M, Tanomaru JM. Radiopacity evaluation of root-end filling mate- rials by digitization of images. J Appl Oral Sci 2008; 16 : 376- 9.
13. Rasimick BJ, Shah RP, Musikant BL, Deutsch AS. Radiopacity of endodontic materials on film and a digital sensor. J Endod 2007; 33 : 1098-101.
14. Baksi BG, Ermis RB. Comparison of conventional and digital radiography for radiometric differentiation of dental cements.
Quintessence Int 2007; 38 : e532-6.
15. Catelan A, Padilha AC, Salzedas LM, Coclete GA, dos Santos PH. Effect of radiotherapy on the radiopacity and flexural strength of a composite resin. Acta Odontol Latinoam 2008;
21 : 159-62.
16. Poorsattar Bejeh Mir A, Poorsattar Bejeh Mir M. How does duration of curing affect radiopacity of dental materials? Imag- ing Sci Dent 2012; 42 : 89-93.
17. Watts DC, McCabe JF. Aluminium radiopacity standards for dentistry: an international survey. J Dent 1999; 27 : 73-8.
18. Nomoto R, Mishima A, Kobayashi K, McCabe JF, Darvell BW, Watts DC, et al. Quantitative determination of radio- opacity: equivalence of digital and film X-ray systems. Dent Mater 2008; 24 : 141-7.
19. Vivan RR, Ordinola-Zapata R, Bramante CM, Bernardineli N, Garcia RB, Hungaro Duarte MA, et al. Evaluation of the radiopacity of some commercial and experimental root-end filling materials. Oral Surg Oral Med Oral Pathol Oral Radiol Endod 2009; 108 : e35-8.
20. White SC, Pharoah MJ. Oral radiology: principles and inter- pretation. 6th ed. St. Louis: Mosby-Elsevier; 2009. p. 84.