INTRODUCTION
Robotics may be one of the most rapidly propagating technologies in urologic surgery, with robot-assisted radical
Comparative analysis of oncologic outcomes for open vs. robot-assisted radical prostatectomy in high-risk prostate cancer
Donghyun Lee, Seung-Kwon Choi1, Jinsung Park2, Myungsun Shim, Aram Kim, Sangmi Lee, Cheryn Song, Hanjong Ahn
Department of Urology, Asan Medical Center, University of Ulsan College of Medicine, Seoul, 1Department of Urology, Kyung Hee University School of Medicine, Seoul,
2Department of Urology, Eulji University Hospital, Eulji University School of Medicine, Daejeon, Korea
Purpose: To evaluate the oncologic outcomes of robot-assisted radical prostatectomy (RARP) in high-risk prostate cancer (PCa), we compared the surgical margin status and biochemical recurrence-free survival (BCRFS) rates between retropubic radical prostatec- tomy (RRP) and RARP.
Materials and Methods: A comparative analysis was conducted of high-risk PCa patients who underwent RRP or RARP by a single surgeon from 2007 to 2013. High-risk PCa was defined as clinical stage≥T3a, biopsy Gleason score 8–10, or prostate-specific anti- gen>20 ng/mL. Propensity score matching was performed to minimize selection bias, and all possible preoperative and postop- erative confounders were matched. A Kaplan-Meier analysis was performed to assess the 5-year BCRFS, and Cox regression models were used to evaluate the effect of the surgical approach on biochemical recurrence.
Results: A total of 356 high-risk PCa patients (106 [29.8%] RRP and 250 [70.2%] RARP) were included in the final cohort analyzed.
Before adjustment, the mean percentage of positive cores on biopsy and pathologic stage were poorer for RRP versus RARP (p=0.036 vs. p=0.054, respectively). The unadjusted 5-year BCRFS rates were better for RARP than for RRP (RRP vs. RARP: 48.1% vs. 64.4%, p=0.021). After adjustment for preoperative variables, the 5-year BCRFS rates were similar between RRP and RARP patients (48.5%
vs. 59.6%, p=0.131). The surgical approach did not predict biochemical recurrence in multivariate analysis.
Conclusions: Five-year BCRFS rates of RARP are comparable to RRP in high-risk PCa. RARP is a feasible treatment option for high- risk PCa.
Keywords: Prostatic neoplasms; Prostatectomy; Treatment outcome
This is an Open Access article distributed under the terms of the Creative Commons Attribution Non-Commercial License (http://creativecommons.org/licenses/by-nc/4.0) which permits unrestricted non-commercial use, distribution, and reproduction in any medium, provided the original work is properly cited.
Korean J Urol 2015;56:572-579.
http://dx.doi.org/10.4111/kju.2015.56.8.572 pISSN 2005-6737 • eISSN 2005-6745
Received: 27 May, 2015 • Accepted: 7 July, 2015 Corresponding Author: Hanjong Ahn
Department of Urology, Asan Medical Center, University of Ulsan College of Medicine, 88 Olympic-ro 43-gil, Songpa-gu, Seoul 138-736, Korea TEL: +82-2-3010-3733, FAX: +82-2-477-8928, E-mail: [email protected]
ⓒ The Korean Urological Association, 2015
prostatectomy (RARP) comprising 67% of all radical prostatectomies performed in the United States in 2010 [1].
Recent studies have demonstrated favorable functional outcomes including urinary continence and erectile function
www.kjurology.org
in patients undergoing RARP compared to retropubic radical prostatectomy (RRP) [2-4]. Furthermore, RARP offers advantages, including reduced blood loss, lower transfusion rates, and faster convalescence [3,4]. However, debate still exists with respect to the oncologic outcome of RARP. Because only a limited number of institutes have performed RARP for more than 10 years, long-term data regarding oncologic outcome are still lacking. A few centers have reported biochemical recurrence-free survival (BCRFS) rates after RARP, which were comparable to an open series [5-8]. A few studies have also reported comparable oncologic outcomes of RARP to those of RRP in high-risk prostate cancer (PCa). However, these results appear to require further validation due to the limitations of earlier studies such as selection bias or very short-term follow-up periods [9- 11].
In our current study, we compared oncologic outcomes with respect to positive surgical margin (PSM) and 5-year BCRFS rates before and after propensity score matching in high-risk PCa patients who underwent RRP or RARP to demonstrate the efficacy of RARP in high-risk PCa.
MATERIALS AND METHODS
1. Study population
From our Institutional Review Board-approved database, patients with high-risk PCa, who were treated from 2007 to 2013 at Asan Medical Center with radical prostatectomy by either RRP or RARP, were selected for our current analyses.
All procedures were performed by a single experienced surgeon (H.A.). Men with metastatic disease at presentation or who received adjuvant or neoadjuvant therapy of any kind were excluded. High-risk PCa was defined as clinical stage≥T3a, biopsy Gleason score (GS) 8–10, or prostate- specific antigen (PSA)>20 ng/mL based on the National Comprehensive Cancer Network (NCCN) risk classification [12].
The choice of surgical method was determined jointly between the patient and the surgeon. Key RP procedures have been described in our previous report [4]. Neurovascular bundle preservation was determined according to the extent of disease, GS, and preoperative erectile function. Principally, RP was attempted in all patients who had organ-confined disease on preoperative magnetic resonance imaging (MRI).
Standard pelvic lymph node dissections (external iliac and obturator lymph nodes) were performed on all patients.
Supersensitive PSA levels were measured at 3, 6, and 12 months after surgery, then every 6 months up to 3 years, and then annually thereafter. The median overall follow-up
interval was 47.9 months (mean, 51.0 months; interquartile range, 33.6–68.6 months). Biochemical recurrence (BCR) was defined as two consecutive postoperative PSA values ≥0.2 ng/mL.
2. Pathological analysis
All pathology slides were reviewed by a single uropathologist. The entire prostatectomy specimen was fixed and cut into 3-mm slices on the axis perpendicular to the major axis for examination. Pathological stage was evaluated according to the 2002 TNM classification [13]. Percent tumor volume was determined by the sum of all visually estimated tumor foci in relation to the prostate on each section, as described in our previous report [14]. PSM was defined as the tumor extending to the inked surface of the specimen, and in areas without a definite identifiable capsule, followed by the definition previously described by Rosen et al. [15].
3. Statistical analyses
Given that RARP began in 2007 at Asan Medical Center and surgical experience of RARP could affect the oncological outcomes, consecutive RARP series were divided into four subgroups (1st, 1–250 cases; 2nd, 251–500 cases; 3rd, 501–750 cases; 4th, 751–1,000 cases). Categorical and continuous variables were compared using the chi-square and Student t-tests, respectively. Kaplan-Meier analyses were used to determine the 5-year BCRFS rates and compared with log- rank tests. Multivariate Cox proportional hazard models were used to determine the predictive factors for BCRFS.
To avoid potential confounding by discrepancies in various parameters between the two surgical modalities, we performed propensity score matching analysis after estimating propensity scores with multiple logistic-regression analysis and adjusting all possible preoperative confounders between the two treatments [16]. Thus, PSM and BCRFS rates were adjusted for preoperative variables including age, prostate size on preoperative MRI, preoperative PSA, clinical stage, biopsy GS, percentage of cores positive on biopsy, and the surgeon’s experience. All analyses were performed using PASW Statistics ver. 18.0 (SPSS Inc., Chicago, IL, USA) with p-values <0.05 defined as statistically significant.
RESULTS
1. Baseline characteristics
During the study period, 1,388 radical prostatectomies were performed by a single surgeon at Asan Medical Center. Of these cases, 443 patients were classified as high- risk PCa. After the exclusion of patients with metastatic
disease at presentation or who received neoadjuvant or adjuvant therapy, 356 patients comprised the final study cohort. Among the cases in this cohort, 106 patients (29.8%) were treated with RRP, whilst the remaining 250 patients (70.2%) were treated with RARP. After propensity score 1:1 matching, 99 patients remained for each surgical modality.
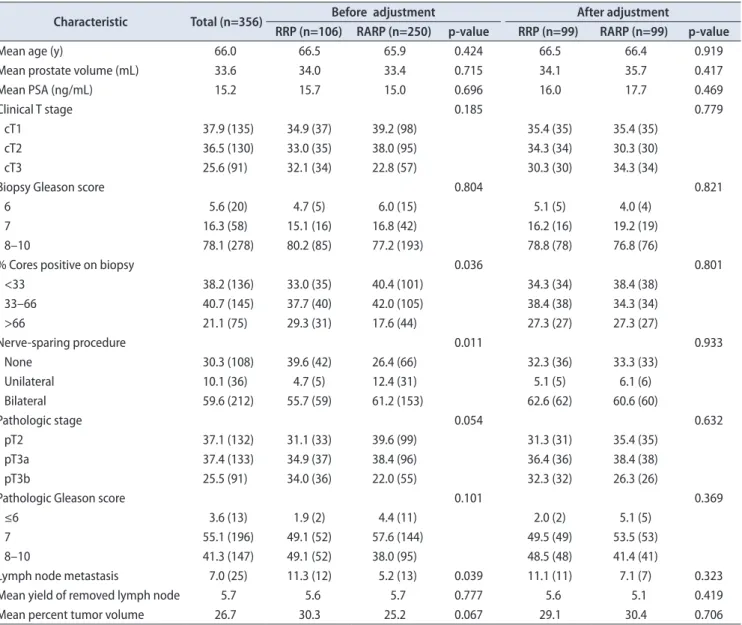
The clinical and pathologic characteristics of the patients are summarized in Table 1. Before adjustment, variables including age, prostate volume, PSA, clinical stage, biopsy GS, pathologic GS, and tumor volume were found to be similar between RRP and RARP. The mean percentage of positive or GS 8–10 cores on biopsy and the number of high-risk factors were greater in the RRP cohort than the RARP cohort. Nerve-sparing procedures were less frequently performed in the RRP cohort. Pathologic stage was more
aggressive in the RRP cohort compared to the RARP cohort. However, no differences between the RRP and RARP cohorts were observed in any of the variables after propensity score matching for these variables (Table 1).
2. Unadjusted oncologic outcomes
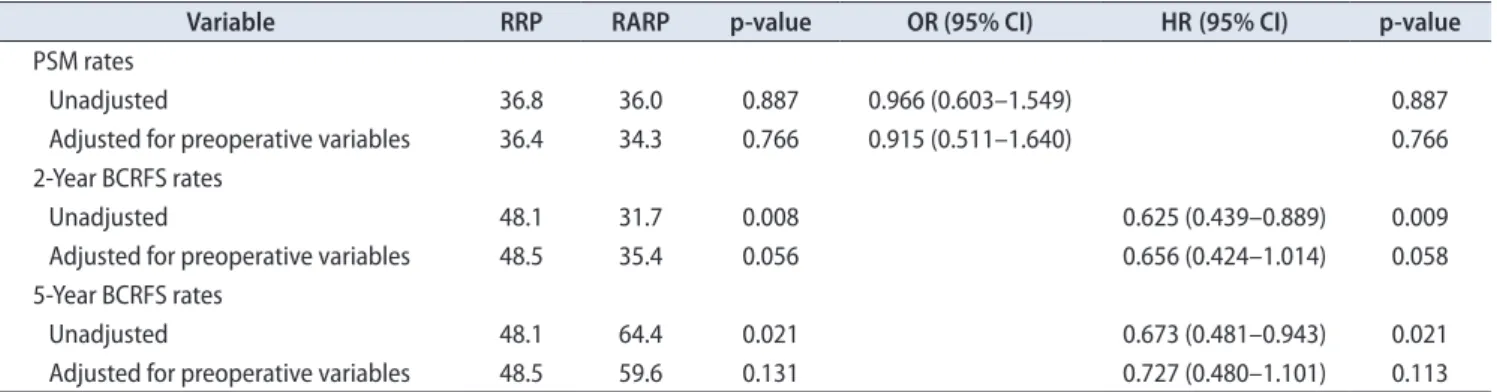
The overall PSM rates were similar between the RRP and RARP cohorts (36.8% vs. 36.0%, p=0.887) (Table 2). The median time to BCR was 16.3 months (interquartile range, 6.9–33.8 months) for RRP and 16.2 months (interquartile range, 8.7–27.9 months) for RARP. Overall 5-year BCRFS rates in the RRP cohort were poorer compared to the RARP cohort (48.1% vs. 64.4%, p=0.021) (Fig. 1, Table 2). Five-year BCRFS rates in RRP and RARP patients with pT2 diseases were similar (84.8% vs. 84.7%, p=0.978). However, those of
Table 1. Clinical and pathological characteristics of high-risk prostate cancer patients before and after adjustment
Characteristic Total (n=356) Before adjustment After adjustment
RRP (n=106) RARP (n=250) p-value RRP (n=99) RARP (n=99) p-value
Mean age (y) 66.0 66.5 65.9 0.424 66.5 66.4 0.919
Mean prostate volume (mL) 33.6 34.0 33.4 0.715 34.1 35.7 0.417
Mean PSA (ng/mL) 15.2 15.7 15.0 0.696 16.0 17.7 0.469
Clinical T stage 0.185 0.779
cT1 37.9 (135) 34.9 (37) 39.2 (98) 35.4 (35) 35.4 (35)
cT2 36.5 (130) 33.0 (35) 38.0 (95) 34.3 (34) 30.3 (30)
cT3 25.6 (91) 32.1 (34) 22.8 (57) 30.3 (30) 34.3 (34)
Biopsy Gleason score 0.804 0.821
6 5.6 (20) 4.7 (5) 6.0 (15) 5.1 (5) 4.0 (4)
7 16.3 (58) 15.1 (16) 16.8 (42) 16.2 (16) 19.2 (19)
8–10 78.1 (278) 80.2 (85) 77.2 (193) 78.8 (78) 76.8 (76)
% Cores positive on biopsy 0.036 0.801
<33 38.2 (136) 33.0 (35) 40.4 (101) 34.3 (34) 38.4 (38)
33–66 40.7 (145) 37.7 (40) 42.0 (105) 38.4 (38) 34.3 (34)
>66 21.1 (75) 29.3 (31) 17.6 (44) 27.3 (27) 27.3 (27)
Nerve-sparing procedure 0.011 0.933
None 30.3 (108) 39.6 (42) 26.4 (66) 32.3 (36) 33.3 (33)
Unilateral 10.1 (36) 4.7 (5) 12.4 (31) 5.1 (5) 6.1 (6)
Bilateral 59.6 (212) 55.7 (59) 61.2 (153) 62.6 (62) 60.6 (60)
Pathologic stage 0.054 0.632
pT2 37.1 (132) 31.1 (33) 39.6 (99) 31.3 (31) 35.4 (35)
pT3a 37.4 (133) 34.9 (37) 38.4 (96) 36.4 (36) 38.4 (38)
pT3b 25.5 (91) 34.0 (36) 22.0 (55) 32.3 (32) 26.3 (26)
Pathologic Gleason score 0.101 0.369
≤6 3.6 (13) 1.9 (2) 4.4 (11) 2.0 (2) 5.1 (5)
7 55.1 (196) 49.1 (52) 57.6 (144) 49.5 (49) 53.5 (53)
8–10 41.3 (147) 49.1 (52) 38.0 (95) 48.5 (48) 41.4 (41)
Lymph node metastasis 7.0 (25) 11.3 (12) 5.2 (13) 0.039 11.1 (11) 7.1 (7) 0.323
Mean yield of removed lymph node 5.7 5.6 5.7 0.777 5.6 5.1 0.419
Mean percent tumor volume 26.7 30.3 25.2 0.067 29.1 30.4 0.706
Values are presented as percentage (number).
RRP, retropubic radical prostatectomy; RAR, robot-assisted radical prostatectomy; PSA, prostate-specific antigen.
pT3 patients were better in the RARP cases (31.5% vs. 51.0%, p=0.085) (Fig. 2), especially for pT3a patients (pT3a: 37.8% vs.
61.5%, p=0.015; pT3b: 25.0% vs. 32.7%, p=0.279). Cancer-specific
(95.3% vs. 98.0%, p=0.340) and overall survival rates (91.5% vs.
96.8%, p=0.122) at 5 years after surgery were similar between the RRP and RARP groups.
Table 2. Comparison of positive surgical margin and 5-year biochemical recurrence free survival rates according to surgical modality
Variable RRP RARP p-value OR (95% CI) HR (95% CI) p-value
PSM rates
Unadjusted 36.8 36.0 0.887 0.966 (0.603–1.549) 0.887
Adjusted for preoperative variables 36.4 34.3 0.766 0.915 (0.511–1.640) 0.766
2-Year BCRFS rates
Unadjusted 48.1 31.7 0.008 0.625 (0.439–0.889) 0.009
Adjusted for preoperative variables 48.5 35.4 0.056 0.656 (0.424–1.014) 0.058
5-Year BCRFS rates
Unadjusted 48.1 64.4 0.021 0.673 (0.481–0.943) 0.021
Adjusted for preoperative variables 48.5 59.6 0.131 0.727 (0.480–1.101) 0.113
RRP, retropubic radical prostatectomy; RARP, robot-assisted radical prostatectomy; OR, odds ratio; HR, hazard ratio; CI, confidence interval; PSM, positive surgical margin; BCRFS, biochemical recurrence-free survival.
0.8
0.6
0.4
probabilitySurvival 0.2
0 0
Time to BCR (mo)
20 40
p=0.021
1.0 RARP
RRP
RARP-censored RRP-censored
A B
60 80 100
BCR-free survival
0.8
0.6
0.4
probabilitySurvival 0.2
0 0
Time to BCR (mo)
20 40
p=0.131
1.0 RARP
RRP
RARP-censored RRP-censored
60 80 100
BCR-free survival
Fig. 1. Kaplan-Meier survival curves for unadjusted (A) and adjusted cohorts (B). BCR, biochemical recurrence; RARP, robot-assisted radical prostatectomy;
RRP, retropubic radical prostatectomy.
0.8
0.6
0.4
probabilitySurvival 0.2
0 0
Time to BCR (mo)
20 40
p=0.085
1.0 RARP
RRP
RARP-censored RRP-censored
A B
60 80 100
BCR-free survival
0.8
0.6
0.4
probabilitySurvival 0.2
0 0
Time to BCR (mo)
20 40
p=0.208
1.0 RARP
RRP
RARP-censored RRP-censored
60 80 100
BCR-free survival
Fig. 2. Kaplan-Meier survival curves for unadjusted (A) and adjusted pT3 cohorts (B). BCR, biochemical recurrence; RARP, robot-assisted radical prostatec- tomy; RRP, retropubic radical prostatectomy.
3. Adjusted oncologic outcomes
After adjustment, the overall PSM rates were 36.4% after RRP and 34.3% after RARP (p=0.766) (Table 2). The overall 5-year BCRFS rates were not different between our two study groups (48.5% vs. 59.6%, p=0.131) (Fig. 1, Table 2). Five- year BCRFS rates of pT3 patients were similar between two adjusted cohorts (30.9% vs. 46.9%, p=0.208) (Fig. 2), indicating that the difference in the 5-year BCRFS rates between the two surgical modalities in unadjusted pT3 patients was no longer present after adjustment (pT3a: 36.1% vs. 50.0%, p=0.159; pT3b: 25.0% vs. 42.3%, p=0.987). Cancer-specific (96.0%
vs. 96.0%, p=0.852) and overall survival rates (91.9% vs. 92.9%, p=0.954) at 5 years after surgery were also similar between the adjusted RRP and RARP cohorts.
4. Predictive analyses
The surgical modality was not found to be associated with PSM or BCR after adjustment (PSM: odds ratio [OR], 0.966; 95% confidence interval [CI], 0.603–1.549; p=0.887;
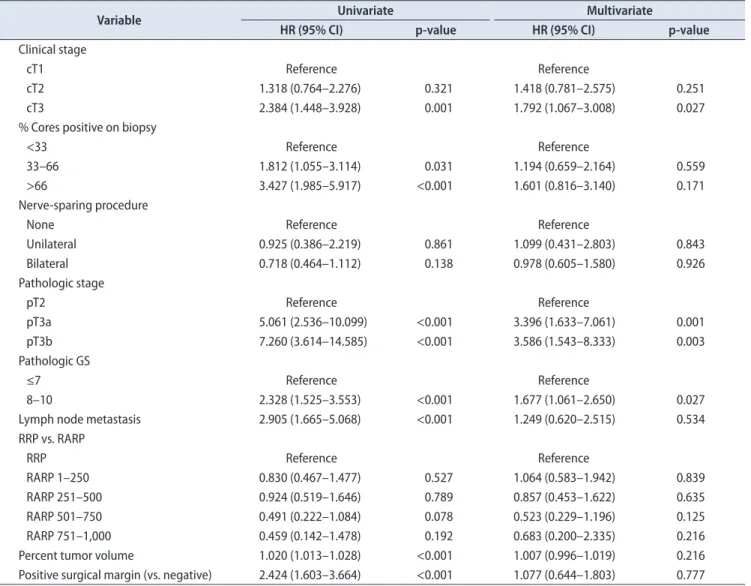
BCR: hazard ratio [HR], 0.915; 95% CI, 0.511–1.640; p=0.766) (Table 2). The Cox proportional hazards regression model’s results indicated that cT, pT stage, and pathologic GS were independent predictive factors for BCR (Table 3).
DISCUSSION
Although several previous studies have reported favorable oncologic outcomes for RRP in the treatment of high-risk PCa, the role of RARP in this setting has not yet been clearly elucidated. Comparative studies with respect to long-term survival rates associated with RRP and RARP
Table 3. Independent predictive factors for biochemical recurrence by multivariate analysis
Variable Univariate Multivariate
HR (95% CI) p-value HR (95% CI) p-value
Clinical stage
cT1 Reference Reference
cT2 1.318 (0.764–2.276) 0.321 1.418 (0.781–2.575) 0.251
cT3 2.384 (1.448–3.928) 0.001 1.792 (1.067–3.008) 0.027
% Cores positive on biopsy
<33 Reference Reference
33–66 1.812 (1.055–3.114) 0.031 1.194 (0.659–2.164) 0.559
>66 3.427 (1.985–5.917) <0.001 1.601 (0.816–3.140) 0.171
Nerve-sparing procedure
None Reference Reference
Unilateral 0.925 (0.386–2.219) 0.861 1.099 (0.431–2.803) 0.843
Bilateral 0.718 (0.464–1.112) 0.138 0.978 (0.605–1.580) 0.926
Pathologic stage
pT2 Reference Reference
pT3a 5.061 (2.536–10.099) <0.001 3.396 (1.633–7.061) 0.001
pT3b 7.260 (3.614–14.585) <0.001 3.586 (1.543–8.333) 0.003
Pathologic GS
≤7 Reference Reference
8–10 2.328 (1.525–3.553) <0.001 1.677 (1.061–2.650) 0.027
Lymph node metastasis 2.905 (1.665–5.068) <0.001 1.249 (0.620–2.515) 0.534
RRP vs. RARP
RRP Reference Reference
RARP 1–250 0.830 (0.467–1.477) 0.527 1.064 (0.583–1.942) 0.839
RARP 251–500 0.924 (0.519–1.646) 0.789 0.857 (0.453–1.622) 0.635
RARP 501–750 0.491 (0.222–1.084) 0.078 0.523 (0.229–1.196) 0.125
RARP 751–1,000 0.459 (0.142–1.478) 0.192 0.683 (0.200–2.335) 0.216
Percent tumor volume 1.020 (1.013–1.028) <0.001 1.007 (0.996–1.019) 0.216
Positive surgical margin (vs. negative) 2.424 (1.603–3.664) <0.001 1.077 (0.644–1.803) 0.777 Univariate analyses were performed with all of the pre- and postoperative variables that are presented in Table 1. Multivariate analysis was per- formed with the statistically significant variables found in the univariate analysis.
HR, hazard ratio; CI, confidence interval; GS, Gleason score; RRP, retropubic radical prostatectomy; RARP, robot-assisted radical prostatectomy.
in the treatment of high-risk PCa are still lacking. In our present study, we therefore compared 5-year survival outcomes of RARP with those of RRP.
The recently reported PSM rates after RARP in high- risk PCa showed no differences compared to RRP [9,11,17].
One of these earlier studies assessing oncologic outcomes in high-risk PCa, reported nonsignificant differences between the PSM rates after RRP (29.4%) versus after RARP (34.3%) [17]. This finding is consistent with our current results showing that the overall PSM rates did not differ between the RRP and RARP cohorts before or after adjustment.
Hu et al. [18] recently reported PSM rates for RRP and RARP for assessing comparative effectiveness of surgical modalities. In that study, the PSM rate for high-risk disease following RARP was lower than that for RRP (RRP vs.
RARP: 20.6% vs. 15.1%, p<0.001). However, a large portion of these previous data was excluded, including pT3b, which is an important unfavorable pathologic variable. The PSM rates reported previously are also questionable because the same rates were found for both intermediate and high-risk PCa [19]. We previously reported the oncologic outcomes of RRP vs. RARP stratified by surgical experience [20]. We demonstrated in these analyses that the pT2 PSM rates were not significantly different between the RRP and RARP series throughout the study period, whereas the pT3 PSM rates significantly decreased after 500 RARP cases, showing little impact of the surgical modalities on the pT3 PSM rates with the accumulation of experience with RARP cases [20]. The study of Punnen et al. [11] also supports the effect of surgical experience on improved outcomes in high-risk PCa. The learning curve for RARP in high-risk PCa seems to be more important, because of its impact on oncologic outcomes, and is not brief, even for a surgeon with considerable experience with RRP.
Menon et al. [8] reported the BCRFS of 1,384 patients following RARP with a median 5-year follow-up. In that study, BCRFS rates following RARP, stratified by D’Amico risk group, were 78.2%, 72.0%, and 67.5% in high-risk patients at 3, 5, and 7 years, respectively. These results were in concordance with an open series. One previous comparative study assessing BCRFS in high-risk PCa has demonstrated BCRFS rates for RARP compared with RRP of 84% vs. 79%
at 2 years and 68% vs. 66% at 4 years (p=0.52) [11]. Another comparative study reported difference in BCRFS rates for RRP and RARP of 56.3% versus 67.8% at 3 years, although this was not found to be significant [17]. In our current study, unadjusted 5-year BCRFS rates for RARP were significantly better than for RRP, mainly because of the differences in pT3 patients. However, after propensity score matching, our
calculated adjusted 5-year BCRFS rates for overall and pT3 following RARP were found to be similar with those of the RRP cohort. These different results indicate an effect of selection bias due to the nonrandomized controlled single institutional comparative design of our present analyses.
Using propensity score matching, we controlled the variables that affected the outcomes and minimized their effects. Our adjusted BCRFS rates, along with those reported by other studies, suggest that the BCRFS rates for RARP in high- risk PCa are comparable to those for RRP.
The adjusted BCRFS rates in our study were lower than those of other reports [11,17,18]. A possible explanation for this discrepancy is that we defined high-risk PCa according to the NCCN risk classification, which does not include clinical stage T2c as high-risk PCa. Most other studies have defined high-risk PCa according to the D’Amico criteria. We thus had a relatively higher proportion of pT3 patients than those of other studies. Indeed, one previous comparative study assessing oncologic outcomes in high-risk PCa evaluated a large number of patients with clinical stage T2c PCa [17]. Other possible reasons for the differences between report findings include a potential selection bias and the shorter follow-up periods of other comparative studies. Most of the earlier studies showed differences in demographic or tumor characteristics between the RRP and RARP cohorts.
Moreover, prior studies that performed propensity score matching in high-risk PCa were designed with very short follow-up periods (4–10 months) [9,21]. According to published contemporary comparative studies on high-risk PCa, mean or median follow-up periods of RARP cohorts are typically less than 2 years. In our present study, we demonstrated 5-year BCRFS rates with midterm mean follow-up periods of 45.3 months for RARP and 50.5 months for RRP in high-risk PCa patients.
There is some controversy regarding the appropriate strategy for treatment of low-risk PCa, and questioning of the benefit of RP for these patients [22,23]. Although active surveillance leads to good long-term survival outcomes in low-risk PCa patients, avoiding the harms of radical prostatectomy, high-risk PCa patients appear to have an increased risk of disease-specific mortality [23,24]. Therefore, these patients could gain a survival benefit from a definite treatment. In recent studies that have assessed the role for RP as a treatment option for high-risk PCa, the importance of RP in these patients has reportedly increased [23,25,26].
Regarding RARP in high-risk PCa, our present results show that this procedure has a comparable 5-year BCRFS to RRP in high-risk PCa patients.
A notable strength of our current study is that we
excluded patients who received neoadjuvant and adjuvant therapy because of the possible effect of these treatments on the PSM and BCRFS rates. In addition, all of our subject patients were treated by the same experienced surgeon, and their pathologic results were reviewed under the same protocol by a single uropathologist at the same institution.
Third, because clinical stage T3 is a more important variable for representing high-risk disease, we defined high-risk PCa as clinical stage T3 or higher, and we performed propensity score matching to minimize selection bias with midterm follow-up periods in high-risk Pca cases.
Some limitations of our present study should also be noted. Although the follow-up in our series was relatively longer than in other high-risk PCa comparative studies, this interval was still inadequate for the proper evaluation of cancer-specific and overall survival. NCCN guideline provides more detailed risk group classification that divided into high risk and very high risk group since 2014. However, more detailed classification requires larger sample size for adequate statistical analysis. Furthermore, in most guidelines, extended lymphadenectomy is recommended in high risk PCa. However, all patients in the cohort received standard lymphadenectomy. Further studies in the setting of current treatment option should be performed. We previously reported the comparable oncological outcomes of RARP after >500 cases of surgical experience. To avoid the discrepancy in surgical experience, patients of RARP subgroups divided according to the surgical experience were evenly included in adjusted cohort. Although we minimized the selection bias in our current analyses using propensity score matching, not all of our data were fully corrected because of nonrandomization. There was a trend towards better BCRFS rate with RARP compared with RRP after propensity score matching, despite of statistical insignificance. Further larger, long-term follow-up, randomized, prospective studies will be needed.
CONCLUSIONS
Our current matched comparison of the oncologic outcomes of RARP, in terms of PSM and 5-year BCRFS rates in high-risk PCa patients treated by the same surgeon, with those of RRP demonstrate that the two procedures are comparable. Although surgical experience affects the PSM rates, especially in pT3 disease, our current findings indicate that RARP is a feasible treatment option for high-risk PCa.
CONFLICTS OF INTEREST
The authors have nothing to disclose.
REFERENCES
1. Lowrance WT, Eastham JA, Savage C, Maschino AC, Laudone VP, Dechet CB, et al. Contemporary open and robotic radical prostatectomy practice patterns among urologists in the United States. J Urol 2012;187:2087-92.
2. Shikanov SA, Zorn KC, Zagaja GP, Shalhav AL. Trifecta out- comes after robotic-assisted laparoscopic prostatectomy. Urol- ogy 2009;74:619-23.
3. Hu JC, Gu X, Lipsitz SR, Barry MJ, D'Amico AV, Weinberg AC, et al. Comparative effectiveness of minimally invasive vs open radical prostatectomy. JAMA 2009;302:1557-64.
4. Kim SC, Song C, Kim W, Kang T, Park J, Jeong IG, et al. Fac- tors determining functional outcomes after radical prostatec- tomy: robot-assisted versus retropubic. Eur Urol 2011;60:413- 9.
5. Sooriakumaran P, Haendler L, Nyberg T, Gronberg H, Nilsson A, Carlsson S, et al. Biochemical recurrence after robot-assisted radical prostatectomy in a European single-centre cohort with a minimum follow-up time of 5 years. Eur Urol 2012;62:768- 74.
6. Liss MA, Lusch A, Morales B, Beheshti N, Skarecky D, Narula N, et al. Robot-assisted radical prostatectomy: 5-year oncologi- cal and biochemical outcomes. J Urol 2012;188:2205-10.
7. Suardi N, Ficarra V, Willemsen P, De Wil P, Gallina A, De Naeyer G, et al. Long-term biochemical recurrence rates after robot-assisted radical prostatectomy: analysis of a single-center series of patients with a minimum follow-up of 5 years. Urol- ogy 2012;79:133-8.
8. Menon M, Bhandari M, Gupta N, Lane Z, Peabody JO, Rog- ers CG, et al. Biochemical recurrence following robot-assisted radical prostatectomy: analysis of 1384 patients with a median 5-year follow-up. Eur Urol 2010;58:838-46.
9. Busch J, Magheli A, Leva N, Hinz S, Ferrari M, Friedersdorff F, et al. Matched comparison of outcomes following open and minimally invasive radical prostatectomy for high-risk pa- tients. World J Urol 2014;32:1411-6.
10. Wambi CO, Siddiqui SA, Krane LS, Agarwal PK, Stricker HJ, Peabody JO. Early oncological outcomes of robot-assisted radi- cal prostatectomy for high-grade prostate cancer. BJU Int 2010;
106:1739-45.
11. Punnen S, Meng MV, Cooperberg MR, Greene KL, Cowan JE, Carroll PR. How does robot-assisted radical prostatectomy (RARP) compare with open surgery in men with high-risk prostate cancer? BJU Int 2013;112:E314-20.
12. National Comprehensive Cancer Network clinical practice guidelines in oncology (NCCN Guidelines): Colon/rectal can- cer. ver. 1. 2010 [Internet]. Fort Wathington: National Compre- hensive Cancer Network; c2015 [cited 2015 Apr 21]. Available from: http://www.nccn.org/professionals/physician_gls/f_
guidelines.asp.
13. Prostate cancer: diagnosis and treatment. NICE guidelines (CG58). Published date: February 2008 [Internet] London:
National Institute for Health and Care Excellence; c2014 [cited 2015 Apr 21]. Available from: https://www.nice.org.uk/guid- ance/cg58.
14. Song C, Seo S, Ahn H, Byun SS, Cho JS, Choi YD, et al. Percent tumor volume predicts biochemical recurrence after radical prostatectomy: multi-institutional data analysis. Int J Clin On- col 2012;17:355-60.
15. Rosen MA, Goldstone L, Lapin S, Wheeler T, Scardino PT.
Frequency and location of extracapsular extension and positive surgical margins in radical prostatectomy specimens. J Urol 1992;148(2 Pt 1):331-7.
16. D'Agostino RB Jr. Propensity score methods for bias reduction in the comparison of a treatment to a non-randomized control group. Stat Med 1998;17:2265-81.
17. Pierorazio PM, Mullins JK, Eifler JB, Voth K, Hyams ES, Han M, et al. Contemporaneous comparison of open vs minimally- invasive radical prostatectomy for high-risk prostate cancer.
BJU Int 2013;112:751-7.
18. Hu JC, Gandaglia G, Karakiewicz PI, Nguyen PL, Trinh QD, Shih YC, et al. Comparative effectiveness of robot-assisted ver- sus open radical prostatectomy cancer control. Eur Urol 2014;
66:666-72.
19. Karnes RJ, Joniau S, Blute ML, Van Poppel H. Caveat emptor.
Eur Urol 2014;66:673-5.
20. Park J, Yoo DS, Song C, Park S, Park S, Kim SC, et al. Compari- son of oncological outcomes between retropubic radical pros- tatectomy and robot-assisted radical prostatectomy: an analysis stratified by surgical experience. World J Urol 2014;32:193-9.
21. Gandaglia G, Abdollah F, Hu J, Kim S, Briganti A, Sammon JD, et al. Is robot-assisted radical prostatectomy safe in men with high-risk prostate cancer? Assessment of perioperative out- comes, positive surgical margins, and use of additional cancer treatments. J Endourol 2014;28:784-91.
22. Wilt TJ, Brawer MK, Jones KM, Barry MJ, Aronson WJ, Fox S, et al. Radical prostatectomy versus observation for localized prostate cancer. N Engl J Med 2012;367:203-13.
23. Bill-Axelson A, Holmberg L, Garmo H, Rider JR, Taari K, Busch C, et al. Radical prostatectomy or watchful waiting in early prostate cancer. N Engl J Med 2014;370:932-42.
24. Abdollah F, Sun M, Schmitges J, Thuret R, Bianchi M, Shariat SF, et al. Survival benefit of radical prostatectomy in patients with localized prostate cancer: estimations of the number needed to treat according to tumor and patient characteristics.
J Urol 2012;188:73-83.
25. Ploussard G, Masson-Lecomte A, Beauval JB, Ouzzane A, Bon- niol R, Buge F, et al. Radical prostatectomy for high-risk pros- tate cancer defined by preoperative criteria: oncologic follow- up in national multicenter study in 813 patients and assessment of easy-to-use prognostic substratification. Urology 2011;78:
607-13.
26. Cooperberg MR, Vickers AJ, Broering JM, Carroll PR. Com- parative risk-adjusted mortality outcomes after primary sur- gery, radiotherapy, or androgen-deprivation therapy for local- ized prostate cancer. Cancer 2010;116:5226-34.