Urological Oncology
Role of the mTOR Pathway in the Progression and Recurrence of Bladder Cancer: An Immunohistochemical Tissue Microarray Study
Se Jun Park, Tae Jin Lee1, In Ho Chang
Departments of Urology and 1Pathology, Chung-Ang University College of Medicine, Seoul, Korea
Purpose: Numerous trials have been conducted to develop new treatment regimens for superficial and invasive bladder cancer, because there is an urgent need to identify nov- el agents to prevent the recurrence and progression of these cancers. We evaluated the prognostic and biological significance of mTOR pathway-related markers in patients with bladder cancer who had undergone transurethral resection of their bladder tumors and radical cystectomy.
Materials and Methods: We retrieved 208 bladder cancer specimens collected from pa- tients between 1989 and 2007 and constructed a tissue microarray comprising 208 tu- mor samples and 25 benign urothelium samples. Immunohistochemical staining was performed for mTOR, phosphorylated (phos) S6, and phos4E-BP1. The pattern, per- centage, and intensity of staining for all three markers were evaluated.
Results: The median age at diagnosis of the patient cohort was 67 years (range: 29-87 years), and the median follow-up was 72 months (range: 1-257 months). The expression of phos4E-BP1 was higher in the bladder cancer cohort than in the benign cohort, where- as phosS6 expression was lower in the bladder cancer cohort than in the benign cohort.
The expression of phosS6 was significantly higher in high-grade bladder cancer (p
<0.01). There was a significant positive correlation between the H-scores of mTOR and phos4E-BP1 (coefficient of correlation, r=0.37, p<0.01) as well as between the H-scores of mTOR and phosS6 (r=0.17, p<0.05). In the multivariate analysis, strong phosS6 ex- pression predicted shorter progression (p<0.01; hazard ratio [HR], 2.516) and dis- ease-specific survival (p<0.01; HR, 2.396) but not overall survival (p=0.112), whereas strong phos4E-BP1 expression was a predictor of disease-specific survival (p<0.05;
HR, 2.105). Moreover, strong phosS6 expression predicted shorter recurrence-free (p
<0.05) and progression-free (p<0.05) survival in the superficial bladder cancer cohort.
Conclusions: Our results demonstrate that mTOR pathway activation, as assessed by phos4E-BP1 phosphorylation, is related to bladder cancer tumorigenesis and that S6 protein phosphorylation is associated with a high level of disease recurrence and pro- gression and poor cancer-specific survival.
Key Words: Bladder; Cancer; mTOR protein
This is an Open Access article distributed under the terms of the Creative Commons Attribution Non-Commercial License (http://creativecommons.org/licenses/by-nc/3.0) which permits unrestricted non-commercial use, distribution, and reproduction in any medium, provided the original work is properly cited.
Article History:
received 15 June, 2011 accepted 28 June, 2011
Corresponding Author:
In Ho Chang
Department of Urology, Chung-Ang University Hospital, 102, Heukseong- ro, Dongjak-gu, Seoul 156-755, Korea
TEL: +82-2-748-9817 FAX: +82-2-798-8577 E-mail: [email protected]
This research was supported by Basic Science Research Program through the National Research Foundation of Korea (NRF) funded by the Ministry of Education Science and Technology (2011-0011821).
INTRODUCTION
Although about 80% of patients with non-muscle-invasive bladder cancer can be successfully treated through surgery
and adjuvant intravesical therapy, two-thirds of patients experience tumor recurrence within 5 years, and high- grade T1 tumors and carcinoma in situ have the potential to progress and possibly metastasize [1]. Patients with in
TABLE 1. Antibodies used for immunohistochemical staining Antigen Catalog
number Species Source Pretreatment Dilution Incubation Staining Positive control mTOR
Phos4E-BP1 PhosS6
2983S 2855S 2211S
Rabbit mAb Rabbit mAb Rabbit mAb
Cell signaling technology Cell signaling technology Cell signaling technology
Citrate buffer pH 6.0 Microwave oven 20 min Citrate buffer pH 6.0 Microwave oven 20 min Citrate buffer pH 6.0 Microwave oven 20 min
1:50 1:400 1:100
1 hr/RT 1 hr/RT 1 hr/RT
Cytoplasmic Cytoplasmic Cytoplasmic
Breast cancer Colon cancer Breast cancer RT: room temperature
vasive bladder cancer require a radical cystectomy.
However, it is controversial whether neoadjuvant or ad- juvant chemotherapy improves survival in patients with invasive bladder cancer, even though bladder transitional cell carcinoma is relatively chemotherapy-sensitive. Thus, during the past few decades, numerous trials have been conducted to develop new treatment regimens for both su- perficial and invasive bladder cancer, because there is an urgent need to identify new agents to prevent bladder can- cer recurrence and progression [2-5].
The mammalian target of rapamycin (mTOR), a ubiq- uitous serine-threonine kinase and a downstream compo- nent of the phosphatidylinositol 3’-kinase (PI3K)/AKT/
phosphatase and the tensin homologue (PTEN)-signaling pathway, has been shown to play a critical role in the regu- lation of protein synthesis, cell growth, proliferation, apop- tosis, survival, and angiogenesis [6]. Furthermore, mTOR has also been demonstrated to act as a transitional activa- tor of hypoxia-inducible factor (HIF) through its activated downstream molecules, namely phosphorylated S6 pro- tein (phosS6) and phosphorylated eukaryotic translation initiation factor 4E-binding protein-1 (phos4E-BP1) [7].
Indeed, elevated mTOR pathway activity has been noted to be important in a variety of human tumors both in vivo and in vitro and in bladder cancer in vitro [8-12].
In this study, we investigated the expression and recip- rocal interplay of three mTOR pathway-related markers (mTOR, phosS6, and phos4E-BP1) to determine the prog- nostic and biological significance of these mTOR path- way-related markers in patients with bladder cancer who had undergone transurethral resectioning of their bladder tumor (TURB) as well as radical cystectomy.
MATERIALS AND METHODS
1. Patient cohort and tissue microarray construction After obtaining institutional review board approval, we re- trieved 208 bladder cancer specimens collected at Chung- Ang University Hospital between 1989 and 2007. We ex- cluded samples from patients who had a history of pre- operative treatment including radiotherapy, systemic che- motherapy, or intravesical therapy. All sections were re- viewed to confirm the original diagnosis and were then staged according to the 2004 American Joint Committee on
Cancer (AJCC)/Union International Contre le Cancer TNM, 6th Edition Pathology Reporting Protocol, including TNM and AJCC stages. Grading was performed at the time of surgery by using either the World Health Organization/
International Society of Urological Pathology consensus classification or the 1965 classification [13,14]. Given the different grading systems used during the span of our study, standardization was performed by an expert uro- logic pathologist (TJ Lee), who classified all tumors as ei- ther high-grade or low-grade for statistical analyses. Para- ffin blocks were available for 208 cases, and tissue micro- arrays (TMAs) were constructed by using a manual array device (TMA set, Labro, Seoul, Republic of Korea). Two- millimeter-thick triplicate tumor samples were spotted from each sample, and 35 triplicate benign urothelium samples were obtained from the benign regions. Four-mi- crometer-thick sections were consecutively incised from the recipient block and transferred to polylysine-coated glass slides. Hematoxylin and eosin staining was per- formed on the TMAs to confirm the presence of tumor tissue or benign urothelium.
2. Clinicopathological data
All patients’ clinicopathological data were retrieved from electronic medical records. These included patient demo- graphics and preoperative information such as diagnostic procedures and clinical stage. Follow-up data on disease re- currence, progression, disease-specific survival (DSS), and overall survival (OS) were obtained by review of patient medical records, letters of inquiry to patients, and a review of the social security death index. For patients who had un- dergone partial or radical cystectomy, pelvic recurrence as well as recurrent metastatic disease were considered to be progression events.
3. Immunohistochemistry
For the immunohistochemical procedures, 4 μm-thick sec- tions were deparaffinized, rehydrated, and subjected to heat-induced antigen retrieval with buffer solution using a streamer autoclave. Sections were then incubated with the appropriate primary antibody. After the application of a secondary antibody, slides were developed using the chromogen 3-3’-diaminobenzidine and counterstained with hematoxylin. Table 1 lists all pertinent marker in-
FIG. 1. Expression of mTOR pathway-related markers in bladder tissues. (A) Immunohistochemical staining of mTOR, phosS6, and phos4E-BP1 in paraffin-embedded sections of benign urothelium, as well as low and high-grade bladder cancer tissues (x100). (B) Graph displaying comparisons of H-scores of mTOR, phosS6, and phos4E-BP1 with respect to benign and bladder cancer lesions. The mean H-scores for phos4E-BP1 were significantly higher and the mean H-scores for phosS6 were significantly lower in bladder cancer lesions, but the mean H-scores for mTOR were not significantly different between benign and cancerous lesions. (C) Graph displaying the H-scores for phosS6 and phos4EBP1 in relation to mTOR H-scores in bladder cancer cells. The mean H-scores of phos4EBP1 were significantly higher in tumor cells with strong mTOR immunostaining than in non-or weak immunostaining tumor cells, although the mean H- score of phosS6.
formation, including vendor, clone, dilution, pretreatment and incubation conditions, staining site, and positive controls. TMA spots with artificial folds or those lacking target tissue representation were omitted from further analyses. Tumors and benign TMA spots stained with each marker were evaluated for patterns of staining (nuclear vs.
cytoplasmic), extent (percent of positive cells), and in- tensity (0 to 3+ score). An H-score was generated for each marker as the sum of the products of each intensity cat- egory multiplied by the extent of immunoexpression [15].
A final H-score was generated by taking the average of trip- licate tissue samples. The H-scores of markers were used in the statistical analyses. In univariate and multivariate analyses, a cutoff value of expression of each marker was
used according to the mean tumor H-score (H-score≥141, 125, and 44, for mTOR, phos4E-BP1, and phosS6, re- spectively). We defined strong expression of a marker as expression equal to or greater than the cutoff value, and weak expression as no expression or expression less than the cutoff value.
4. Statistical analysis
SPSS ver. 14.0 (SPSS Inc., Chicago, IL, USA) was used for all statistical analyses. Differences between two variables were investigated by using a two-tailed Student’s t-test, and ANOVA analysis was used when comparing more than three variables. Pearson correlation coefficients were cal- culated to test relationships among parameters. Recur-
TABLE 2. Clinicopatholgical characteristics of patients and summary of mTOR-related biomarker expression (mean H-score) with respect to categorized pathological parameters
Clinical and pathologic features No. of patients (%)
mTOR phos4E-BP1 phosS6
H-score
(mean±SD) p-value H-score
(mean±SD) p-value H-score
(mean±SD) p-value Age
Sex TNM stage
Grade
<60 60-70
>70 Male Female A 1 2 3 4
Low (I, II) High (III)
65 (31.3) 83 (39.9) 60 (28.8) 182 (88.8) 26 (11.2) 54 (26.0) 102 (49.0) 28 (13.5) 9 (4.3) 15 (7.2) 109 (52.4) 99 (47.6)
145.3±91.5 150.3±79.7 119.1±75.4 142.3±85.2 132.3±71.2 140.6±84.7 149.0±81.4 90.7±83.9 99.8±79.3 96.4±79.4 143.1±85.8 138.9±82.3
0.074
0.570 0.081
0.721
125.4±83.7 123.5±81.4 124.7±79.9 126.7±81.5 117.1±83.7 113.7±78.9 123.9±82.9 143.9±87.7 126.8±84.2 133.2±84.0 117.3±78.4 135.5±83.2
0.991
0.575 0.468
0.107
32.4±56.7 43.8±68.5 53.7±64.6 44.5±66.3 41.2±57.6 30.2±46.1 50.8±73.6 47.4±59.4 39.1±79.2 42.2±71.1 27.0±43.6 63.0±79.0
0.184
0.810 0.444
<0.001 phos4E-BP1: phosphorylated 4E-BP1, phosS6: phosphorylated S6
rence-free and progression-free survival curves were esti- mated by using the Kaplan-Meier method, and any differ- ences in the survival curves were compared by log-rank tests. A Cox regression model was used during multi- variate analysis and p<0.05 was considered significant.
RESULTS
1. Demographic, clinical, and treatment characteristics The median age at diagnosis for the patient cohort was 67 years (range: 29-87 years) with a male to female ratio of 9:1 and a median follow-up period of 72 months (range: 1-257 months). In our cohort, 154 patients (74%) were diagnosed with carcinoma in situ or superficial bladder cancer and 54 (26%) with invasive or metastatic bladder cancer. One hun- dred sixty patients (76.9%) had undergone TURB, and 46 (22.1%) had undergone partial or radical cystectomy.
Recurrence was observed in 88 patients (42.3%) and pro- gression in 53 (25.5%). Rates of OS and DSS were 54.8%
and 78.4%, respectively.
2. Expression of mTOR pathway-related markers in rela- tion to clinicopathological variables
As shown in Fig. 1A, mTOR, phos4E-BP1, and phosS6 were expressed in the cytoplasm of bladder cancer cells and in benign urothelium. Overall, mTOR expression was de- tected in 197 (94.7%) of 208 bladder cancer samples and in 31 (88.6%) of 35 benign samples. Phos4E-BP1 and phosS6 were expressed in 96.2% and 72.6% of bladder cancer co- hort samples, respectively, and in 71.4% and 94.3% of be- nign cohort samples, respectively. The mean H-score of phos4E-BP1 was higher in the bladder cancer cohort (125.5 vs. 61.2) than in the benign cohort, whereas the mean H-score of phosS6 was lower in the bladder cancer cohort than in the benign cohort (44.0 vs. 183.8). The H-score of mTOR was not significantly different between these two
cohorts (141.0 vs. 141.9) (Fig. 1B). In the univariate analy- sis, there was no relationship between the H-scores of the markers and age, sex, or TMN stage grouping; however, the mean H-score of phosS6 expression was significantly high- er in high-grade bladder cancer samples (63.0 vs. 27.0, p<
0.01). Levels of the other two markers were not related to tumor grade (Table 2).
When we investigated the correlation between the ex- pression of mTOR pathway-related markers, we found a significant positive correlation between mTOR and phos4E-BP1 H-scores (correlation coefficient, r=0.37, p
<0.01), as well as between mTOR and phosS6 H-scores (r=0.17, p<0.05), although the correlation coefficient be- tween mTOR and phosS6 was weak. Fig. 1C shows the mean H-scores of phosS6 and phos4EBP1 in relation to mTOR H-scores in bladder cancer. The mean H-scores of phos4EBP1 were significantly higher in cancer cells that strongly expressed mTOR than in cancer cells with no or weak mTOR expression (p<0.05). The mean H-scores of phosS6 were higher.
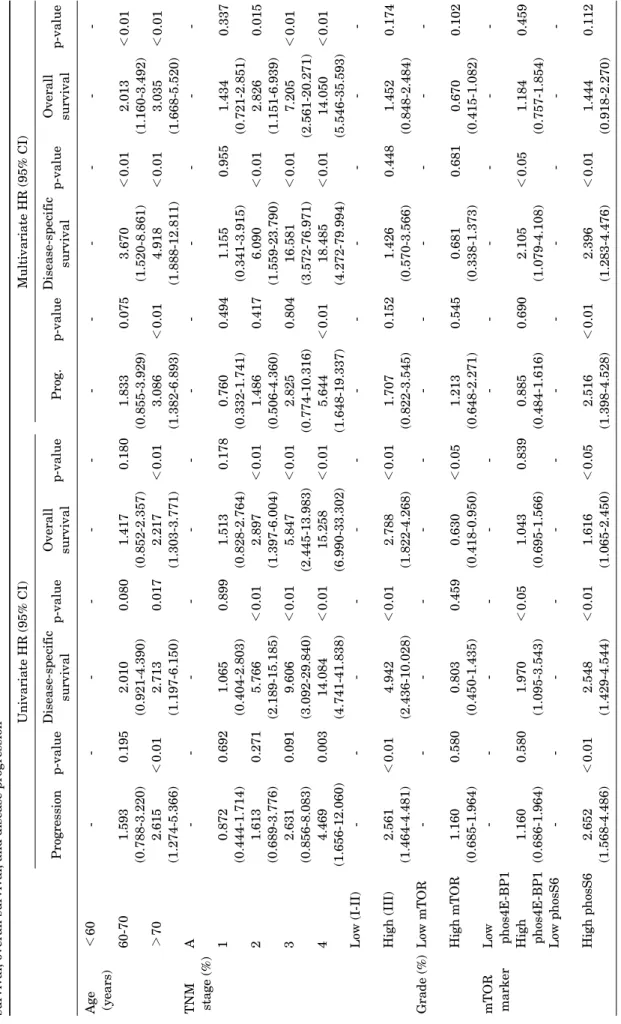
3. Univariate and multivariate survival analyses Table 3 shows the results of the univariate and multi- variate survival analyses. In the univariate analysis, a higher TNM stage and a higher cell grade were significant predictors of shorter progression, DSS, and OS. Further- more, older age was associated with shorter progression and OS (p<0.05), although older age was of borderline sig- nificance in predicting DSS (p=0.080). Among mTOR path- way-related markers, only phosS6 was a significant pre- dictor of progression, DSS, and OS, although mTOR was a predictor of OS, and phos4E-BP1 was a predictor of DSS.
In the multivariate analysis, TNM stage and age remained independent predictors of progression, DSS, and OS, but not of tumor cell grade. Among the markers, strong phosS6 expression predicted shorter progression (p<0.01; hazard
TABLE 3. Results of univariate and multivariate analyses of clinicopathological variables and the expression levels of mTOR-related markers in relation to disease-specific survival, overall survival, and disease progression Univariate HR (95% CI)Multivariate HR (95% CI) Progressionp-valueDisease-specific survivalp-valueOverall survivalp-valueProg.p-valueDisease-specific survivalp-valueOverall survivalp-value Age (years) TNM stage (%) Grade (%) mTOR marker
<60 60-70 >70 A 1 2 3 4 Low (I-II) High (III) Low mTOR High mTOR Low phos4E-BP1 High phos4E-BP1 Low phosS6 High phosS6
- 1.593 (0.788-3.220) 2.615 (1.274-5.366) - 0.872 (0.444-1.714) 1.613 (0.689-3.776) 2.631 (0.856-8.083) 4.469 (1.656-12.060) - 2.561 (1.464-4.481) - 1.160 (0.685-1.964) - 1.160 (0.686-1.964) - 2.652 (1.568-4.486)
- 0.195 <0.01 - 0.692 0.271 0.091 0.003 - <0.01 - 0.580 - 0.580 - <0.01
- 2.010 (0.921-4.390) 2.713 (1.197-6.150) - 1.065 (0.404-2.803) 5.766 (2.189-15.185) 9.606 (3.092-29.840) 14.084 (4.741-41.838) - 4.942 (2.436-10.028) - 0.803 (0.450-1.435) - 1.970 (1.095-3.543) - 2.548 (1.429-4.544)
- 0.080 0.017 - 0.899 <0.01 <0.01 <0.01 - <0.01 - 0.459 - <0.05 - <0.01
- 1.417 (0.852-2.357) 2.217 (1.303-3.771) - 1.513 (0.828-2.764) 2.897 (1.397-6.004) 5.847 (2.445-13.983) 15.258 (6.990-33.302) - 2.788 (1.822-4.268) - 0.630 (0.418-0.950) - 1.043 (0.695-1.566) - 1.616 (1.065-2.450)
- 0.180 <0.01 - 0.178 <0.01 <0.01 <0.01 - <0.01 - <0.05 - 0.839 - <0.05
- 1.833 (0.855-3.929) 3.086 (1.382-6.893) - 0.760 (0.332-1.741) 1.486 (0.506-4.360) 2.825 (0.774-10.316) 5.644 (1.648-19.337) - 1.707 (0.822-3.545) - 1.213 (0.648-2.271) - 0.885 (0.484-1.616) - 2.516 (1.398-4.528)
- 0.075 <0.01 - 0.494 0.417 0.804 <0.01 - 0.152 - 0.545 - 0.690 - <0.01
- 3.670 (1.520-8.861) 4.918 (1.888-12.811) - 1.155 (0.341-3.915) 6.090 (1.559-23.790) 16.581 (3.572-76.971) 18.485 (4.272-79.994) - 1.426 (0.570-3.566) - 0.681 (0.338-1.373) - 2.105 (1.079-4.108) - 2.396 (1.283-4.476)
- <0.01 <0.01 - 0.955 <0.01 <0.01 <0.01 - 0.448 - 0.681 - <0.05 - <0.01
- 2.013 (1.160-3.492) 3.035 (1.668-5.520) - 1.434 (0.721-2.851) 2.826 (1.151-6.939) 7.205 (2.561-20.271) 14.050 (5.546-35.593) - 1.452 (0.848-2.484) - 0.670 (0.415-1.082) - 1.184 (0.757-1.854) - 1.444 (0.918-2.270)
- <0.01 <0.01 - 0.337 0.015 <0.01 <0.01 - 0.174 - 0.102 - 0.459 - 0.112
FIG. 2. Kaplan-Meier curves based on phospS6 and phos4E-BP1 staining results in superficial bladder cancer patients. (A) In the recurrence-free survival curves, bladder cancers with strong pS6 immunostaining exhibited decreased recurrence-free survival (p=0.046, log-rank test). (B) Tumors with strong pS6 immunostaining showed significantly decreased progression-free survival (p=0.035, log-rank test). (C, D) Phos4E-BP1 status, however, was not related to recurrence-free survival (C) or progression-free survival (D) in superficial bladder cancers.
ratio [HR], 2.516) and DSS (p<0.01; HR, 2.396), but not OS (p=0.112), whereas strong phos4E-BP1 expression was a predictor of DSS (p<0.05; HR, 2.105).
4. Correlation between mTOR pathway-related marker ex- pression status and progression-free survival and re- currence-free survival in patients with superficial blad- der cancer
Of 154 superficial bladder cancer patients, 145 had under- gone TURB, and in these patients, we investigated the cor- relation between mTOR pathway-related marker ex- pression and progression-free survival and recurrence- free survival. The median age of this cohort was 64 years (range: 29-85 years) with a male to female ratio of 8.5:1.5 and a median follow-up of 72 months (range: 1-257 mon- ths). In our cohort, recurrence was observed in 59 patients (40.7%) and progression in 35 (24.1%). Kaplan-Meier sur- vival analysis revealed that of the three mTOR-related markers, only strong phosS6 expression predicted shorter
recurrence-free (p=0.046) and progression-free survival (p=0.035), although the p-value was not strong (Fig. 2).
DISCUSSION
It is well established that bladder cancer develops along two major molecular tracks [16]. The first track is charac- terized by the development of papillary lesions that rarely become invasive or metastatic but almost always recur [16]. These superficial tumors are therefore rarely lethal, but their high recurrence rates coupled with patient lon- gevity have made them the most expensive solid tumors to treat and, therefore, a significant public health burden.
Superficial tumors are thought to be driven by Ras path- way activation, most often (in up to 65% of cases) via the accumulation of activating mutations in the type 3 fibro- blast growth factor receptor and less often via mutations in PI3K or Ras [17-19]. The second progression track in- volves the inactivation of major tumor suppressors [p53,
Rb, and PTEN], which produces tumors that are highly in- vasive and metastatic [16,19]. Furthermore, PTEN loss leading to activation of the mTOR pathway has been re- ported in other genitourinary tract tumors such as prostate adenocarcinoma, renal cell carcinoma, upper tract ur- othelial carcinoma, and bladder urothelial carcinoma, of- fering a rationale for the limited but promising response of these types of tumors to mTOR inhibitors [20-24].
In our study, phos4E-BP1 expression was higher and phosS6 expression was lower in the bladder cancer cohort than in the benign cohort, although mTOR expression was not significantly different between these two cohorts.
Schultz et al reported lower phosS6 expression in a bladder cancer cohort than in a benign urothelium cohort in a study of 144 bladder cancer patients who had undergone radical cystectomy [25]; they suggested that their findings were consistent with reduced activation of AKT, resulting in an overall down-regulation of the mTOR pathway. In our study, we observed a similar phosS6 expression pattern to that reported by Schultz and colleagues; however, in our study, the expression of mTOR was not increased. If these effects are due to down-regulation of mTOR, mTOR (nonac- tivated form) expression should have been elevated in blad- der urothelial carcinoma samples compared with benign urothelium samples. Moreover, in our study, the bladder cancer cohort exhibited higher expression of phos4E-BP1 than seen in benign epithelium, indicating that the mTOR pathway was active. We believe that high phos4E-BP1 ex- pression may be related to bladder cancer tumorigenesis.
4E-BP-1 is a protein that binds to the eukaryotic trans- lation initiation factor4E (elF-4E) and plays a critical role in the regulation of gene expression. When 4E-BP1 is non- phosphorylated, it has been shown to bind tightly to elF-4E, blocking the formation of the cap-dependent mRNA trans- lation initiation complex and suppressing translation.
When 4E-BP1 is phosphorylated, elF-4E is released, and the initiation complex can form and promote translation [26]. Several studies have implicated components of the protein initiation synthesis apparatus in carcinogenesis.
For example, elF-4E was shown to induce malignant trans- formation when overexpressed in mammalian cells [27].
Moreover, increased levels of elF-4E are commonly found in breast, prostate, and head and neck tumors, but not in benign lesions [28].
In our study, there was a significant positive correlation between mTOR and phos4E-BP1 expression as well as be- tween mTOR and phosS6 expression in the bladder cancer cohort. Furthermore, phosS6 expression was elevated in bladder cancer cells compared with benign urothelium.
PhosS6 expression was also significantly higher in high- grade bladder cancer cells. These results suggest that the mTOR pathway may contribute to the aggressiveness and progression of bladder cancer.
Among the mTOR pathway-related markers that we evaluated, phosS6 was a significant predictor of pro- gression and DSS in the multivariate survival analysis, and phos4E-BP1 was a significant predictor of DSS. These
findings are similar to those for other solid tumors; how- ever, they are in contrast with prior studies that reported that phosS6 had a favorable prognostic effect in bladder cancer [25,29]. However, in the study by Schultz et al , 42%
of the bladder cancer cohort underwent preoperative treat- ment including radiotherapy, systemic chemotherapy, or intravesical therapy [25]. Systemic chemotherapy and in- travesical Bacillus Calmette Guerin (BCG) therapy may affect the expression of mTOR pathway-related markers as a result of telomerase activity and immune reactions [30,31]. In our study, therefore, we excluded patients with a history of preoperative treatment. Moreover, 49% of the bladder urothelial carcinoma cohort had a tumor staged higher than T3, whereas only 21% of the superficial bladder urothelial carcinoma cohort had a tumor at stage T3 or higher. A large proportion of patients with higher-stage bladder cancer may have a down-regulated mTOR path- way due to activation of HIF-1α. Additional large cohort studies are needed to determine the prognostic sig- nificance of mTOR pathway-related markers in bladder cancer patients.
In our study, strong phosS6 expression predicted shorter recurrence-free and progression-free survival in 145 pa- tients with superficial bladder cancer who had undergone TURB, demonstrating that the mTOR pathway is involved in bladder cancer recurrence and progression. Moreover, these findings suggest that mTOR signaling may play a critical role in the progression and recurrence of superficial bladder cancer. Seager et al reported that rapamycin, an mTOR inhibitor, prevented progression of carcinoma in situ to invasive bladder cancer in an animal model [32]; fur- thermore, intravesical delivery of rapamycin into the blad- der lumen was highly effective at suppressing bladder can- cer recurrence. The risk of recurrence in patients with su- perficial bladder cancer treated with surgical resection alone ranges from 45% to 80% and in intravesical BCG it ranges from 46% to 69% based on 5- and 10-year follow-ups, respectively [1]. If currently available intravesical agents fail to eliminate the tumor, patients are faced with the pros- pect of radical cystectomy or urinary diversion. These are life-altering procedures fraught with significant metabolic and surgical complications, and the reluctance to accept these interventions hinges on the expected decrease in quality of life or comorbid medical conditions. Our findings suggest that superficial bladder cancer patients may be ideal candidates for testing mechanism-based targeted therapies in a clinical setting.
CONCLUSIONS
Our results revealed that mTOR pathway activation, as as- sessed by phos4E-BP1 phosphorylation, is involved in bladder cancer tumorigenesis and that S6 protein phos- phorylation is a predictor of disease progression and poor cancer-specific survival. Moreover, we showed for the first time that S6 protein phosphorylation is related to high re- currence and disease progression in superficial bladder
cancer patients. Trials designed to evaluate novel targeted agents in patients who are most likely to respond will accel- erate the development of promising therapies. We hope that bladder cancer will rank highly among those human tumors to be effectively prevented and treated by
“individualized” therapy.
Conflicts of Interest
The authors have nothing to disclose.
REFERENCES
1. Dalbagni G. The management of superficial bladder cancer. Nat Clin Pract Urol 2007;4:254-60.
2. Jung SJ, Chang HS, Park CH, Kim CI, Kim BH. Effectiveness of an immediate mitomycin C instillation in patients with super- ficial bladder cancer receiving periodic mitomycin C instillation.
Korean J Urol 2011;52:323-6.
3. Choueiri TK, Raghavan D. Chemotherapy for muscle-invasive bladder cancer treated with definitive radiotherapy: persisting uncertainties. Nat Clin Pract Oncol 2008;5:444-54.
4. Fossa SD, Aass N, Ous S, Waehre H, Ilner K, Hannisdal E.
Survival after curative treatment of muscle-invasive bladder cancer. Acta oncol 1996;35(Suppl):59-65.
5. Sternberg CN, Donat SM, Bellmunt J, Millikan RE, Stadler W, De Mulder P, et al. Chemotherapy for bladder cancer: treatment guidelines for neoadjuvant chemotherapy, bladder preservation, adjuvant chemotherapy, and metastatic cancer. Urology 2007;69 (1 Suppl):62-79.
6. Garcia JA, Danielpour D. Mammalian target of rapamycin in- hibition as a therapeutic strategy in the management of urologic malignancies. Mol Cancer Ther 2008;7:1347-54.
7. Sabatini DM. mTOR and cancer: insights into a complex relationship. Nat Rev Cancer 2006;6:729-34.
8. Vignot S, Faivre S, Aguirre D, Raymond E. mTOR-targeted ther- apy of cancer with rapamycin derivatives. Ann Oncol 2005;16:
525-37.
9. Meric-Bernstam F, Gonzalez-Angulo AM. Targeting the mTOR signaling network for cancer therapy. J Clin Oncol 2009;27:
2278-87.
10. Robb VA, Karbowniczek M, Klein-Szanto AJ, Henske EP.
Activation of the mTOR signaling pathway in renal clear cell carcinoma. J Urol 2007;177:346-52.
11. Fechner G, Classen K, Schmidt D, Hauser S, Müller SC. Rapamy- cin inhibits in vitro growth and release of angiogenetic factors in human bladder cancer. Urology 2009;73:665-8.
12. Pinto-Leite R, Botelho P, Ribeiro E, Oliveira PA, Santos L. Effect of sirolimus on urinary bladder cancer T24 cell line. J Exp Clin Cancer Res 2009;28:3.
13. Bergkvist A, Ljungqvist A, Moberger G. Classification of bladder tumours based on the cellular pattern. Preliminary report of a clinical-pathological study of 300 cases with a minimum follow-up of eight years. Acta Chir Scand 1965;130:371-8.
14. Epstein JI, Amin MB, Reuter VR, Mostofi FK. The World Health Organization/International Society of Urological Pathology con- sensus classification of urothelial (transitional cell) neoplasms of the urinary bladder. Bladder Consensus Conference Committee.
Am J Surg Pathol 1998;22:1435-48.
15. Detre S, Saclani Jotti G, Dowsett M. A "quickscore" method for immunohistochemical semiquantitation: validation for oes-
trogen receptor in breast carcinomas. J Clin Pathol 1995;48:
876-8.
16. Dinney CP, McConkey DJ, Millikan RE, Wu X, Bar-Eli M, Adam L, et al. Focus on bladder cancer. Cancer cell 2004;6:111-6.
17. Zhang ZT, Pak J, Huang HY, Shapiro E, Sun TT, Pellicer A, et al.
Role of Ha-ras activation in superficial papillary pathway of ur- othelial tumor formation. Oncogene 2001;20:1973-80.
18. Sibley K, Cuthbert-Heavens D, Knowles MA. Loss of hetero- zygosity at 4p16.3 and mutation of FGFR3 in transitional cell carcinoma. Oncogene 2001;20:686-91.
19. Platt FM, Hurst CD, Taylor CF, Gregory WM, Harnden P, Knowles MA. Spectrum of phosphatidylinositol 3-kinase path- way gene alterations in bladder cancer. Clin Cancer Res 2009;15:
6008-17.
20. King JC, Xu J, Wongvipat J, Hieronymus H, Carver BS, Leung DH, et al. Cooperativity of TMPRSS2-ERG with PI3-kinase path- way activation in prostate oncogenesis. Nat Genet 2009;41:524-6.
21. Carver BS, Tran J, Gopalan A, Chen Z, Shaikh S, Carracedo A, et al. Aberrant ERG expression cooperates with loss of PTEN to promote cancer progression in the prostate. Nat Genet 2009;41:
619-24.
22. Pantuck AJ, Seligson DB, Klatte T, Yu H, Leppert JT, Moore L, et al. Prognostic relevance of the mTOR pathway in renal cell car- cinoma: implications for molecular patient selection for targeted therapy. Cancer 2007;109:2257-67.
23. Qian CN, Furge KA, Knol J, Huang D, Chen J, Dykema KJ, et al.
Activation of the PI3K/AKT pathway induces urothelial carcino- ma of the renal pelvis: identification in human tumors and con- firmation in animal models. Cancer Res 2009;69:8256-64.
24. Puzio-Kuter AM, Castillo-Martin M, Kinkade CW, Wang X, Shen TH, Matos T, et al. Inactivation of p53 and Pten promotes invasive bladder cancer. Genes Dev 2009;23:675-80.
25. Schultz L, Albadine R, Hicks J, Jadallah S, DeMarzo AM, Chen YB, et al. Expression status and prognostic significance of mam- malian target of rapamycin pathway members in urothelial carci- noma of urinary bladder after cystectomy. Cancer 2010;116:
5517-26.
26. Averous J, Proud CG. When translation meets transformation:
the mTOR story. Oncogene 2006;25:6423-35.
27. Lazaris-Karatzas A, Montine KS, Sonenberg N. Malignant trans- formation by a eukaryotic initiation factor subunit that binds to mRNA 5' cap. Nature 1990;345:544-7.
28. De Benedetti A, Harris AL. eIF4E expression in tumors: its possi- ble role in progression of malignancies. Int J Biochem Cell Biol 1999;31:59-72.
29. Baba HA, Wohlschlaeger J, Cicinnati VR, Hilgard P, Lang H, Sotiropoulos GC, et al. Phosphorylation of p70S6 kinase predicts overall survival in patients with clear margin-resected hep- atocellular carcinoma. Liver Int 2009;29:399-405.
30. Bu X, Jia F, Wang W, Guo X, Wu M, Wei L. Coupled down-regu- lation of mTOR and telomerase activity during fluorouracil-in- duced apoptosis of hepatocarcinoma cells. BMC Cancer 2007;7:
208.
31. Bansal K, Narayana Y, Patil SA, Balaji KN. M. bovis BCG induced expression of COX-2 involves nitric oxide-dependent and -independent signaling pathways. J Leukoc Biol 2009;85:804-16.
32. Seager CM, Puzio-Kuter AM, Patel T, Jain S, Cordon-Cardo C, Mc Kiernan J, et al. Intravesical delivery of rapamycin suppresses tumorigenesis in a mouse model of progressive bladder cancer.
Cancer Prev Res (Phila) 2009;2:1008-14.