I. Introduction
The concern and payment of medical service has hugely in- creased; therefore, the market for medical services has grown [1]. Along with adaptation of information technologies, such as ubiquitous and cloud computing, medical services have been changing from medical care to health management and illness prevention. Following this shift, telemedicine has been developing in a variety of fields. Most of all, mobile health monitoring services have attracted interest and have a potential for growth. Mobile health monitoring services related to health management and illness prevention could be provided. Such mobile health monitoring services could be highly effective, especially for chronically ill patients or
Perception of Influencing Factors on Acceptance of Mobile Health Monitoring Service:
A Comparison between Users and Non-users
Jaebeom Lee, PhD1, Mi Jung Rho, PhD2
1Graduate School of Business, Sogang University, Seoul; 2Department of Medical Informatics, The Catholic University of Korea College of Medicine, Seoul, Korea
Objectives: To improve and promote mobile health monitoring services, this study investigated the perception of various fac- tors influencing the acceptance of services between users and non‐users. Methods: This study drew 9 variables from studies related to mobile health monitoring services and the unified theory of acceptance and the use of technology model. A total of 219 samples were collected by a paper-based survey from users (n = 106) and non‐users (n = 113). Analysis was carried out using a two-independent samples t-test. Results: The findings indicate that users have a more positive perception of service benefits than non-users. Although there were difference between users and non‐users, all respondents had a positive percep- tion of the service benefits. After users used the service, they were less concerned about the risks involved with it. However, both users and non-users had a high negative perception of service risk. Users also had a more positive perception of intima- cy and communication associated with the services than non-users. Both users and non-users had a high behavioral inten- tion to use the services. Finally, this study observed that older subjects tended to recognize the higher value of the services.
Conclusions: This study provides insights to improve and invigorate mobile health monitoring services. This study also offers insights into how to increase the number of users of mobile health monitoring services in South Korea.
Keywords: Mobile Health, Telemedicine, Telehealth, UTAUT Model
Healthc Inform Res. 2013 September;19(3):167-176.
http://dx.doi.org/10.4258/hir.2013.19.3.167 pISSN 2093-3681 • eISSN 2093-369X
Submitted: May 10, 2013
Revised: 1st, July 14, 2013; 2nd, September 6, 2013 Accepted: September 17, 2013
Corresponding Author Mi Jung Rho, PhD
Department of Medical Informatics, The Catholic University of Ko- rea College of Medicine, 222, Banpo-daero, Seocho-gu, Seoul 137- 701, Korea. Tel: +82-2-2258-7648, Fax: +82-2-2258-8257, E-mail:
This is an Open Access article distributed under the terms of the Creative Com- mons Attribution Non-Commercial License (http://creativecommons.org/licenses/by- nc/3.0/) which permits unrestricted non-commercial use, distribution, and reproduc- tion in any medium, provided the original work is properly cited.
ⓒ 2013 The Korean Society of Medical Informatics
people who want to manage their health and avoid illness [2].
Mobile health monitoring services have been defined as a combination system of mobile computing, medical sensors, and communications technologies for healthcare. Although, mobile health monitoring services have growth potential [3], it is limited by laws in South Korea [4].
In South Korea, telemedicine service acceptance has been driven by the Korean government [5]. Many issues must be solved; thus, it has not reached the stage of commercializa- tion yet. Although there are obstacles that must be overcome before mobile health monitoring services can reach a more active stage of development, it could provide comprehensive medical care for chronically ill patients as well as healthy people. Therefore, many studies should be carried out. How- ever, very few studies related to the users’ perspective on mobile health monitoring services in South Korea [6,7]. To provide appropriate mobile health monitoring services, the system should be designed considering the perceptions and factors influencing mobile health monitoring service accep- tance. Therefore, this study focused on public perceptions of mobile health monitoring services.
This study attempted to determine the importance of real service usage and service awareness to service users. This study investigated the user’s perspective on mobile health monitoring services. The objectives of this study may be summarized as follows. This study aimed to discover the various perceptions of factors influencing the acceptance of mobile health monitoring services of users and non‐users.
By revealing the perceptions of mobile health monitoring service users and non‐users, this study can provide under- standing and insight into the needs and desires of users.
Moreover, the study can provide a practical guideline for the design and development of mobile health monitoring ser- vices by service providers and policy makers.
1. Theoretical Background
1) Patients’ perception in telemedicine service acceptance To understand patients’ perception influencing telemedicine
service acceptance, a literature review was conducted related to telemedicine service acceptance. Through the literature review, this study finally found four perceptions: commu- nication, accessibility, intimacy, and service risk. This study classified the four perceptions into three categories concern- ing the patients’ core perception in telemedicine service acceptance, namely, 1) benefit factors, 2) benefit & disadvan- tage factors, and 3) disadvantage factors.
According to literature review, patients perceived that us- ing telemedicine services would help them to improve their health condition [8-11] and that it would provide health re- cords or health care unbound by time and space [12-17]. In addition, patients perceived that using telemedicine services would involve communication with the service provider, hospital staff, clinical institution, and other users, and they had a sense of intimacy between patients and providers through sympathy, confidence, and respect; however, they also expressed concern over these factors [11-13,18,19].
On the other hand, they were worried about uncertainty of telemedicine services [20-22]. Table 1 summarizes patients’
perception in telemedicine service acceptance.
2) Unified theory of acceptance and use of technology This study accepted constructs as basic perceptions influenc- ing the acceptance of mobile health monitoring service in order to complement patients’ positive perception in mobile health monitoring service acceptance. Therefore, this study adopted four constructs from the unified theory of accep- tance and the use of technology (UTAUT) model proposed by Venkatesh et al. [23] because the UTAUT model could provide robust understanding for users’ technology accep- tance [24].
As noted above, the UTAUT model comprises four signifi- cant constructs, namely, performance expectation, effort expectancy, social influence, and facilitation conditions.
Performance expectation in the UTAUT model has the same meaning as perceived usefulness in the technology accep- tance model (TAM). Effort expectancy is the same as the perceived ease of use in TAM [25]. Social influence means
Table1. Patients’ perception in telemedicine service acceptance
Factor Perception Advantage Disadvantage
Benefit factor Quality of care
Accessibility of patient record, health information, and service
√
√ Benefit & disadvantage factor Communication
Intimacy
√
√
√
√
Disadvantage factor Privacy √
the degree to which an individual perceives it to be impor- tant that others believe he or she should use the new system.
Facilitating conditions refer to the degree to which an indi- vidual believes that an organizational and technical infra- structure exists to support the use of the new system [23].
The UTAUT model has some advantages. First, although there are various versions of users’ technology acceptance model, such as TAM and TAM2, the UTAUT is a compre- hensive model to explain the user’s usage intention and actual usage in the information system. The UTAUT was de- veloped by considering eight previously developed models, namely, the theory of research action, TAM, the motivational model, the theory of planned behavior (TPB), combined TAM and TPB, the model of PC utilization, the innovation diffusion theory, and social cognitive theory. Second, the UTAUT model explained 69% of intention to use IT, while other models explained approximately 40% of technology acceptance [23].
Among the many studies related to technology accep- tance, the UTAUT model had also been frequently used in the healthcare field [26-31]. Nwabueze et al. [24] used the UTAUT model to find that cultural characteristics are important factors in the adoption of telemedicine service.
Cranen et al. [32] used a qualitative framework based on the UTAUT to recognize patients’ perceptions regarding telere- habilitation services and the factors that facilitate or prevent patients’ intentions to use.
To accept four constructs as patients’ perceptions influenc- ing mobile health monitoring service acceptance, this study modified four constructs based on literature review related to telemedicine service. Accordingly, this study drew positive factors influencing mobile health monitoring service accep- tance by patients from studies based on the UTAUT model.
II. Methods
1. Instrument Development
Firstly, this study conducted a literature review to derive ba- sic perceptions influencing the acceptance of mobile health monitoring services. We found four perceptions: communi- cation, accessibility, intimacy, and service risk. As previously mentioned, the four perceptions were categorized in terms of three categories concerning the patients’ core perception of the advantages and disadvantages of telemedicine services:
1) factors for which telemedicine is perceived positively are considered benefit factors, 2) those for which it is perceived
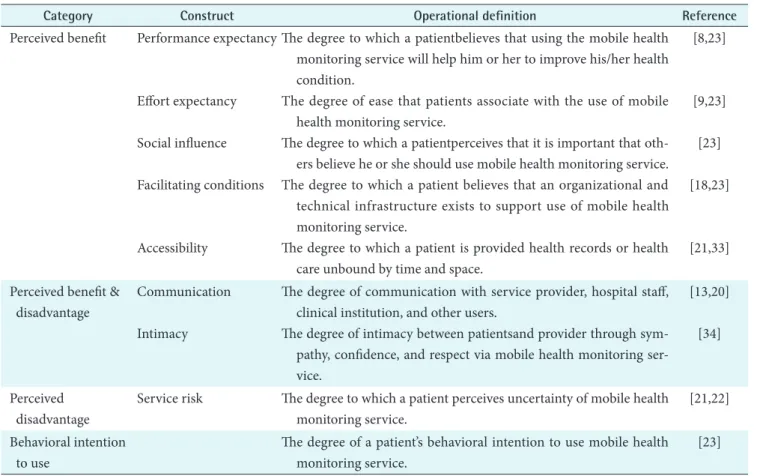
Table 2. Operational definitions of the constructs
Category Construct Operational definition Reference
Perceived benefit Performance expectancy
Effort expectancy Social influence Facilitating conditions
Accessibility
The degree to which a patientbelieves that using the mobile health monitoring service will help him or her to improve his/her health condition.
The degree of ease that patients associate with the use of mobile health monitoring service.
The degree to which a patientperceives that it is important that oth- ers believe he or she should use mobile health monitoring service.
The degree to which a patient believes that an organizational and technical infrastructure exists to support use of mobile health monitoring service.
The degree to which a patient is provided health records or health care unbound by time and space.
[8,23]
[9,23]
[23]
[18,23]
[21,33]
Perceived benefit &
disadvantage
Communication Intimacy
The degree of communication with service provider, hospital staff, clinical institution, and other users.
The degree of intimacy between patientsand provider through sym- pathy, confidence, and respect via mobile health monitoring ser- vice.
[13,20]
[34]
Perceived disadvantage
Service risk The degree to which a patient perceives uncertainty of mobile health monitoring service.
[21,22]
Behavioral intention to use
The degree of a patient’s behavioral intention to use mobile health monitoring service.
[23]
both positively and negatively are considered benefit & dis- advantage factors, and 3) those factors for which telemedi- cine is perceived negatively are considered disadvantage factors. Secondly, this study adopted four constructs from the UTAUT model, to complement patients’ positive percep- tions in the mobile health monitoring service acceptance.
All constructs were adopted from prior studies related to the UTAUT, with necessary validation and wording changes tailored to the telemedicine service and healthcare context.
Table 2 summarizes the definitions of the constructs based on nine factors from the literature review. All questions were measured using a seven-point Likert scale with answers from
“strongly agree” to “strongly disagree”.
2. Sample and Data Collection
Data were collected from the users group and the non‐users group in relation to mobile health monitoring services. A survey was conducted for eight weeks, from March 5, 2012 to April 28, 2012. The survey was administered separately to users and non‐users. First, the survey of the users group was conducted at Changwon City Health Center. Changwon City Health Center provided a mobile health monitoring service to prevent diseases of the local population. This service was provided with support from the Korean government, from February to December in 2012. This mobile health monitor- ing service provided care in areas, such as nutrition and ex- ercise management. Through this service, participants could use a ‘pedometer,’ to record health information. Users could update their health information, such as body composition analysis, activity, and other personal health information.
There were three health zones where health information readers were installed around Changwon City. If a user placed the ‘pedometer’ they had used on the health informa- tion reader, their health information was sent to the health service center. Users could manage comprehensive health care through the Website. Their health information was then managed by a trainer, nutritionist, and nurse. Users could receive telephone and SMS counseling, and they received health analysis reports by e-mail and post each month. After the users agreed to participate in our survey, paper-based questionnaires were administered. Two-hundred question- naires were distributed. The survey finally yielded 106 usable responses from the users group. Second, the survey for the non‐users group was conducted at six university hospitals.
Five of these hospitals were located in Seoul, and the other was located in Daegu City. After the patients agreed to par- ticipate in the survey, paper-based questionnaires were ad- ministered. Questionnaires were collected from 200 outpa- tients. The survey finally yielded 113 usable responses from
the non‐users group.
3. Statistical Analysis
SPSS ver. 18.0 software (SPSS Inc., Chicago, IL, USA) was used for this study. First, this study performed exploratory factor analysis to find discernible construct structures. Next, a principal component analysis with varimax rotation was performed. Second, this study assessed the reliability of all constructs using Cronbach’s alpha. Third, before the analysis of different perception among users and non‐users, a two- independent samples t-test was carried out with the focus on gender. Also, a one-way ANOVA analysis was carried out in relation to age using nine variables. Finally, a two-inde- pendent samples t-test was carried out focused on users (n = 106) and non‐users (n = 113) depending on the perception of influencing factors on the acceptance of mobile health monitoring service.
III. Results
1. Sample Characteristics
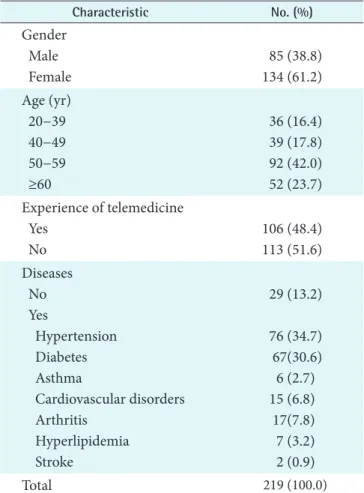
Table 3 summarizes the profile of the 219 respondents. Among
Table 3. Descriptive statistics of respondent characteristics
Characteristic No. (%)
Gender Male Female
85 (38.8) 134 (61.2) Age (yr)
20−39 40−49 50−59 ≥60
36 (16.4) 39 (17.8) 92 (42.0) 52 (23.7) Experience of telemedicine
Yes No
106 (48.4) 113 (51.6) Diseases
No Yes
Hypertension Diabetes Asthma
Cardiovascular disorders Arthritis
Hyperlipidemia Stroke
29 (13.2) 76 (34.7) 67(30.6) 6 (2.7) 15 (6.8) 17(7.8) 7 (3.2) 2 (0.9)
Total 219 (100.0)
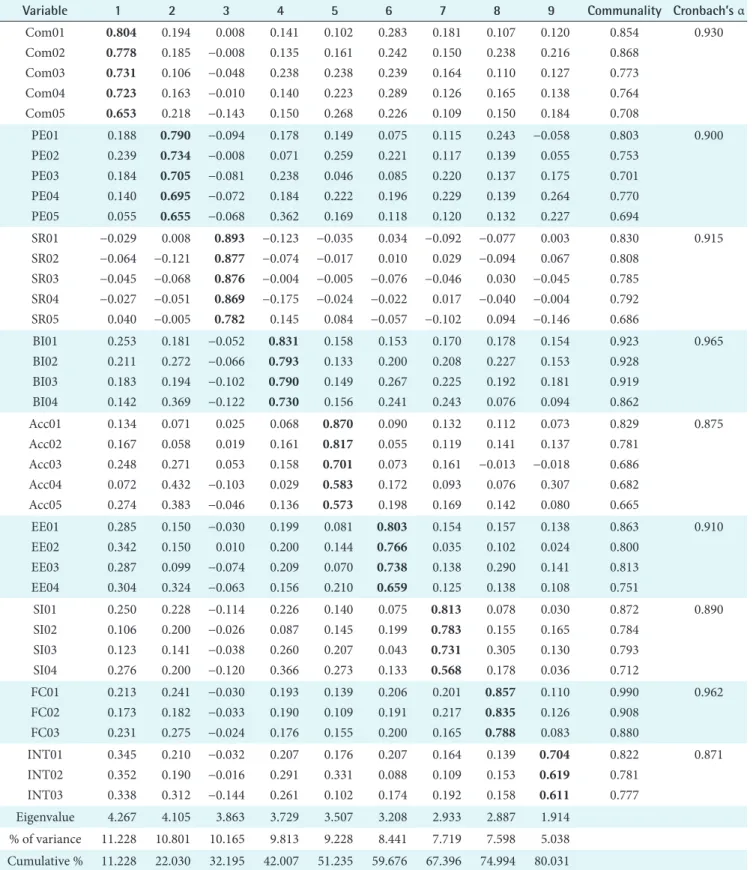
Table 4. Results of reliability and validity analysis
Variable 1 2 3 4 5 6 7 8 9 Communality Cronbach’s α
Com01 Com02 Com03 Com04 Com05
0.804 0.778 0.731 0.723 0.653
0.194 0.185 0.106 0.163 0.218
0.008
−0.008
−0.048
−0.010
−0.143
0.141 0.135 0.238 0.140 0.150
0.102 0.161 0.238 0.223 0.268
0.283 0.242 0.239 0.289 0.226
0.181 0.150 0.164 0.126 0.109
0.107 0.238 0.110 0.165 0.150
0.120 0.216 0.127 0.138 0.184
0.854 0.868 0.773 0.764 0.708
0.930
PE01 PE02 PE03 PE04 PE05
0.188 0.239 0.184 0.140 0.055
0.790 0.734 0.705 0.695 0.655
−0.094
−0.008
−0.081
−0.072
−0.068
0.178 0.071 0.238 0.184 0.362
0.149 0.259 0.046 0.222 0.169
0.075 0.221 0.085 0.196 0.118
0.115 0.117 0.220 0.229 0.120
0.243 0.139 0.137 0.139 0.132
−0.058 0.055 0.175 0.264 0.227
0.803 0.753 0.701 0.770 0.694
0.900
SR01 SR02 SR03 SR04 SR05
−0.029
−0.064
−0.045
−0.027 0.040
0.008
−0.121
−0.068
−0.051
−0.005
0.893 0.877 0.876 0.869 0.782
−0.123
−0.074
−0.004
−0.175 0.145
−0.035
−0.017
−0.005
−0.024 0.084
0.034 0.010
−0.076
−0.022
−0.057
−0.092 0.029
−0.046 0.017
−0.102
−0.077
−0.094 0.030
−0.040 0.094
0.003 0.067
−0.045
−0.004
−0.146
0.830 0.808 0.785 0.792 0.686
0.915
BI01 BI02 BI03 BI04
0.253 0.211 0.183 0.142
0.181 0.272 0.194 0.369
−0.052
−0.066
−0.102
−0.122
0.831 0.793 0.790 0.730
0.158 0.133 0.149 0.156
0.153 0.200 0.267 0.241
0.170 0.208 0.225 0.243
0.178 0.227 0.192 0.076
0.154 0.153 0.181 0.094
0.923 0.928 0.919 0.862
0.965
Acc01 Acc02 Acc03 Acc04 Acc05
0.134 0.167 0.248 0.072 0.274
0.071 0.058 0.271 0.432 0.383
0.025 0.019 0.053
−0.103
−0.046
0.068 0.161 0.158 0.029 0.136
0.870 0.817 0.701 0.583 0.573
0.090 0.055 0.073 0.172 0.198
0.132 0.119 0.161 0.093 0.169
0.112 0.141
−0.013 0.076 0.142
0.073 0.137
−0.018 0.307 0.080
0.829 0.781 0.686 0.682 0.665
0.875
EE01 EE02 EE03 EE04
0.285 0.342 0.287 0.304
0.150 0.150 0.099 0.324
−0.030 0.010
−0.074
−0.063
0.199 0.200 0.209 0.156
0.081 0.144 0.070 0.210
0.803 0.766 0.738 0.659
0.154 0.035 0.138 0.125
0.157 0.102 0.290 0.138
0.138 0.024 0.141 0.108
0.863 0.800 0.813 0.751
0.910
SI01 SI02 SI03 SI04
0.250 0.106 0.123 0.276
0.228 0.200 0.141 0.200
−0.114
−0.026
−0.038
−0.120
0.226 0.087 0.260 0.366
0.140 0.145 0.207 0.273
0.075 0.199 0.043 0.133
0.813 0.783 0.731 0.568
0.078 0.155 0.305 0.178
0.030 0.165 0.130 0.036
0.872 0.784 0.793 0.712
0.890
FC01 FC02 FC03
0.213 0.173 0.231
0.241 0.182 0.275
−0.030
−0.033
−0.024
0.193 0.190 0.176
0.139 0.109 0.155
0.206 0.191 0.200
0.201 0.217 0.165
0.857 0.835 0.788
0.110 0.126 0.083
0.990 0.908 0.880
0.962
INT01 INT02 INT03
0.345 0.352 0.338
0.210 0.190 0.312
−0.032
−0.016
−0.144
0.207 0.291 0.261
0.176 0.331 0.102
0.207 0.088 0.174
0.164 0.109 0.192
0.139 0.153 0.158
0.704 0.619 0.611
0.822 0.781 0.777
0.871
Eigenvalue 4.267 4.105 3.863 3.729 3.507 3.208 2.933 2.887 1.914
% of variance 11.228 10.801 10.165 9.813 9.228 8.441 7.719 7.598 5.038 Cumulative % 11.228 22.030 32.195 42.007 51.235 59.676 67.396 74.994 80.031 Values are presented as factor loading.
Eigenvalue: variance of principal components, % of variance: percentage of variance explained, Cumulative %: total variance, Com:
communication, PE: performance expectancy, SR: service risk, BI: behavioral intention to use, Acc: accessibility, EE: effort expec- tancy, SI: social influence, FC: facilitating conditions, INT: intimacy.
all respondents, 106 respondents (48.4%) had experience with mobile health monitoring service, while 113 respondents (51.6%) had no experience with mobile health monitoring service. A total of 61.2% of the respondents were women. Of the 219 respondents, 144 respondents (65.7%) were over 50 years old. Only 29 respondents (13.2%) had no disease. The rest of the respondents who had a disease mostly had hyper- tension (34.7%) and diabetes (30.6%).
2. Reliability and Validity
Before the analysis, the construct validity and internal reli-
ability was tested. First, an exploratory factor analysis was performed to test the construct validity. A principal compo- nent analysis with varimax rotation was carried out for each construct. All factors emerged with no-cross construct load- ings above 0.50. The pattern of loadings and cross-loadings supported discriminant validity and internal consistency [35]. The instrument also demonstrated a convergent validi- ty with factor loadings that exceeded 0.50 for each construct.
The results showed the existence of all factors with eigenval- ues greater than 1.0 that accounted for 80.031% of the total variance. In addition, communality ranged from 0.665 to 0.990. Therefore, all items achieved the 0.50 threshold [36].
Thus, these results demonstrated that all constructs were dis- tinct uni-dimensional scales.
Next, the use of Cronbach’s alpha was evaluated for inter- nal consistency reliability [37]. The values for all constructs ranged from 0.871 to 0.965. Since the values for all con- structs were greater than 0.70 [35], Cronbach’s alpha was reliable for all constructs. Table 4 summarizes the results of the reliability and validity analysis.
3. Different Perception in Demographic Factors
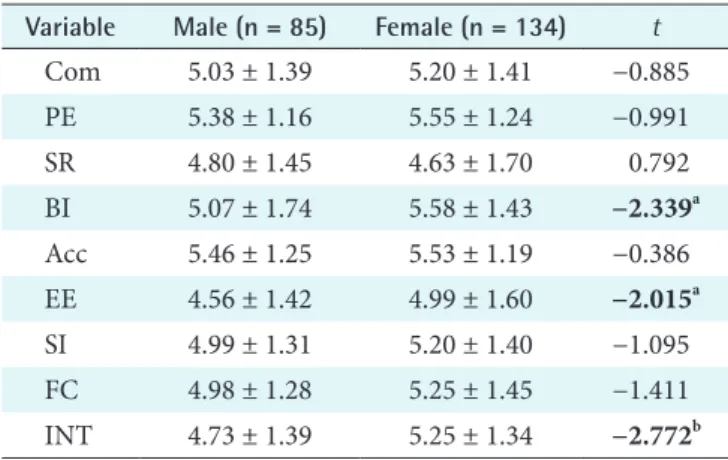
Before the analysis of different perceptions among users and non‐users, a two-independent samples t-test was carried out with the focus on gender (Table 5). First, the mean score was found to be higher in females than in males with respect to nine variables. The results indicate that there is a significant difference between males and females regarding the behav- ioral intention to use (t = −2.339, p < 0.05), effort expectancy (t = −2.015, p < 0.05), and intimacy (t = −2.772, p < 0.01).
Table 5. Perceptions differences according to gender Variable Male (n = 85) Female (n = 134) t
Com 5.03 ± 1.39 5.20 ± 1.41 −0.885
PE 5.38 ± 1.16 5.55 ± 1.24 −0.991
SR 4.80 ± 1.45 4.63 ± 1.70 0.792
BI 5.07 ± 1.74 5.58 ± 1.43 −2.339a
Acc 5.46 ± 1.25 5.53 ± 1.19 −0.386
EE 4.56 ± 1.42 4.99 ± 1.60 −2.015a
SI 4.99 ± 1.31 5.20 ± 1.40 −1.095
FC 4.98 ± 1.28 5.25 ± 1.45 −1.411
INT 4.73 ± 1.39 5.25 ± 1.34 −2.772b
Values are presented as mean ± standard deviation.
Com: communication, PE: performance expectancy, SR: service risk, BI: behavioral intention to use, Acc: accessibility, EE: effort expec- tancy, SI: social influence, FC: facilitating conditions, INT: intimacy.
at0.05 = 1.960, bt0.01=2.576.
Table 6. Perception differences according to age
Variable Age (yr)
20-39 (n = 36) 40-49 (n = 39) 50-59 (n = 92) ≥60 (n = 52) F
Com 4.83 ± 1.17 5.63 ± 1.20 5.11 ± 1.33 5.03 ± 1.71 2.35
PE 5.25 ± 1.03 5.77 ± 1.14 5.41 ± 1.21 5.56 ± 1.36 1.36
SR 5.01 ± 1.37 4.50 ± 1.88 4.69 ± 1.41 4.64 ± 1.85 0.67
BI 5.28 ± 1.32 5.67 ± 1.50 5.30 ±1.47 5.38 ± 1.93 0.56
Acc 4.94 ± 1.12 6.07 ± 0.89 5.60 ± 1.06 5.29 ± 1.50 6.67b
EE 4.81 ± 1.04 5.35 ± 1.48 4.68 ± 1.55 4.67 ± 1.81 1.93
SI 4.91 ± 1.33 5.62 ± 1.36 5.04 ± 1.25 5.04 ± 1.54 2.19
FC 4.97 ± 1.12 5.68 ± 1.18 4.96 ± 1.30 5.21 ± 1.74 2.78a
INT 4.60 ± 1.15 5.46 ± 1.42 5.07 ± 1.29 5.02 ± 1.58 2.49
Values are presented as mean ± standard deviation.
Com: communication, PE: performance expectancy, SR: service risk, BI: behavioral intention to use, Acc: accessibility, EE: effort ex- pectancy, SI: social influence, FC: facilitating conditions, INT: intimacy.
ap < 0.05, bp < 0.001.
Second, a one-way ANOVA analysis was conducted in re- lation to age using nine variables (independent variables).
The results of this analysis demonstrated that perceptions of accessibility differed with age (F(3, 215) = 6.67; p = 0.001).
Post hoc comparisons were then performed using a Scheffe test, which showed significant paired comparison only for 20–39 years versus 40–49 years (p = 0.001) (Table 6). The re- sults from the one-way ANOVA analysis also demonstrated that facilitating conditions differences were dependent on age (F(3, 215) = 2.78; p = 0.042). Post hoc comparisons were then performed using a Scheffe test, which did not show sig- nificant paired comparison in relation to age.
4. Perception Differences between Users and Non-users A two-independent samples t-test was carried out focused on users (n = 106) and non‐users (n = 113) in relation to the perception of influencing factors on the acceptance of mo- bile health monitoring service.
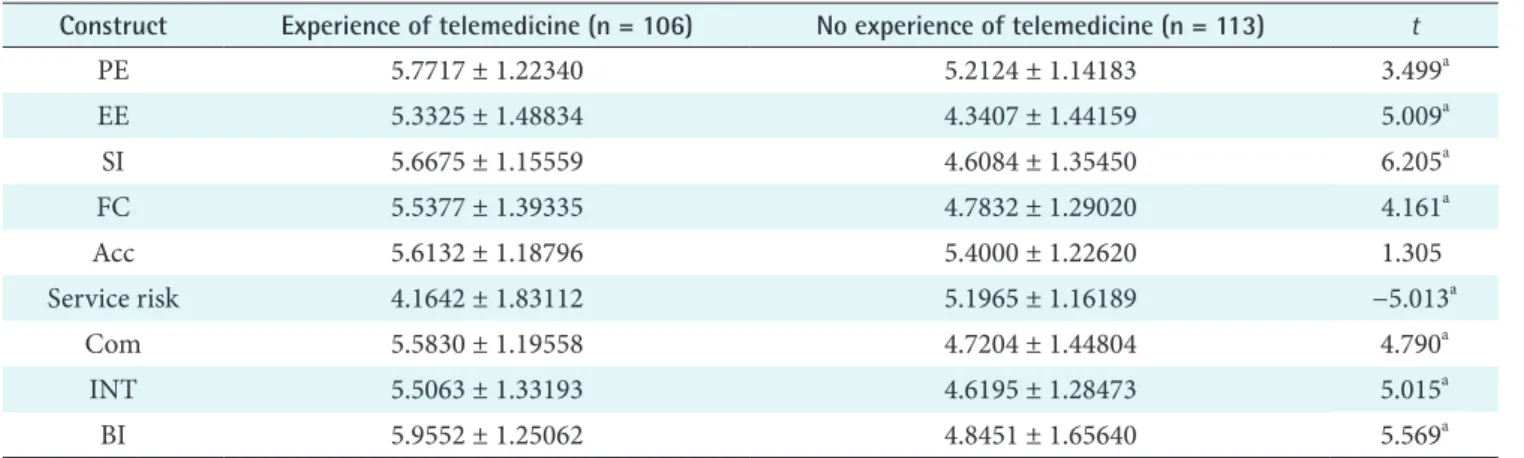
Firstly, a two-independent samples t-test was conducted re- garding perceived benefits, such as performance expectancy, effort expectancy, facilitating conditions, social influence, and accessibility. The results in Table 7 show that the 5 con- structs’ mean score related to users, who had an experience of mobile health monitoring service, were higher than the non‐users’ mean score. The results showed significant differ- ences between users and non-users regarding performance expectancy (t = 3.499, p < 0.001), effort expectancy (t = 5.009, p < 0.001), social influence (t = 6.205, p < 0.001), and facilitating conditions (t = 4.161, p < 0.001). There was no significant different between users and non-users regarding accessibility.
Secondly, this study conducted a two-independent samples t-test regarding perceived risk, such as service risk (Table 7).
For non‐users, the mean score for service risk was higher than that of users; the results showed a significant differ- ence between users and non-users regarding service risk (t =
−5.013, p < 0.001).
Thirdly, a two-independent samples t-test was carried out regarding communication and intimacy, which are consid- ered both perceived benefits and perceived risks. The results in Table 7 showed that 2 constructs’ mean score related to users, who had experience of telemedicine, were higher than the non‐users’ scores. The results showed a significant differ- ence between users and non-users regarding communication (t = 4.790, p < 0.001) and intimacy (t = 5.015, p < 0.001).
Finally, the mean score of behavioral intention to use relat- ed to users, who had an experience of mobile health moni- toring service, was higher than the non‐users’ score (Table 7). The results showed a significant difference between users and non-users regarding behavioral intention to use (t = 5.569, p < 0.001).
IV. Discussion
This study investigated the perception of various factors influencing the acceptance of mobile health monitoring ser- vices between users and non‐users. Based on the results of this study, the following conclusions may be drawn.
First, the users group had a more positive perception of service benefits than the non-users group. However, there was no difference in perceptions of accessibility. Although there were significant differences between the perceptions
Table 7. Perceived benefit, risk, and behavioral intention to use
Construct Experience of telemedicine (n = 106) No experience of telemedicine (n = 113) t
PE 5.7717 ± 1.22340 5.2124 ± 1.14183 3.499a
EE 5.3325 ± 1.48834 4.3407 ± 1.44159 5.009a
SI 5.6675 ± 1.15559 4.6084 ± 1.35450 6.205a
FC 5.5377 ± 1.39335 4.7832 ± 1.29020 4.161a
Acc 5.6132 ± 1.18796 5.4000 ± 1.22620 1.305
Service risk 4.1642 ± 1.83112 5.1965 ± 1.16189 −5.013a
Com 5.5830 ± 1.19558 4.7204 ± 1.44804 4.790a
INT 5.5063 ± 1.33193 4.6195 ± 1.28473 5.015a
BI 5.9552 ± 1.25062 4.8451 ± 1.65640 5.569a
Values are presented as mean ± standard deviation.
PE: performance expectancy, EE: effort expectancy, SI: social influence, FC: facilitating conditions, Acc: accessibility, Com: commu- nication, INT: intimacy, BI: Behavioral intention to use.
at0.001 = 3.291.
of the users group and the non‐users group, all respondents had a positive perception of service benefits [13,20,21,33,34].
In other words, people had positive expectations for mobile health monitoring services.
Second, after people used mobile health monitoring ser- vices, they were less concerned about service risks, such as cost and service quality. However, both the users group and the non-users group had high negative perception of service risk [21].
Third, the users group had a more positive perception of intimacy and communication than non-users. There were additional differences between the users group and the non‐
users group. These results showed that users felt that mobile health monitoring services created relationships between pa- tients as service providers that were sympathetic, confident, and respectful [13,20,34]. They could communicate with ser- vice providers, hospital staff, clinical institutions, and other users.
Fourth, both the users group and the non-users group had high behavioral intention to use. In other words, people had high demand for mobile health monitoring services.
Finally, there are some differences related to age and gen- der. Females had a positive perception of behavior intention to use, effort expectancy, and intimacy. People in their forties perceived the mobile health monitoring services more posi- tively regarding accessibility than younger people. This result confirmed that, to users, it was important to not only know about mobile health monitoring service, but also experience the service. Therefore, service providers primarily should publicize the advantages associated with mobile health monitoring service. This promotion could serve to allay us- ers concerns about service risks, such as cost and service quality. Furthermore, service providers should encourage service users feel comfortable and confident about service quality and usage. To do that, they should provide a lot of assistance, guidelines, and education. Providers should cre- ate opportunities for the public to experience their services, such as the mobile health monitoring service pack and trial period service. Mobile health monitoring service devices should be designed so that they are compatible with familiar devices, such as cellular phones and smartphones. In addi- tion, mobile health monitoring services should be designed with consideration of the age of many people.
There were two main limitations of this study. First, females were over-represented in the respondent groups. Among the respondents, those who were 50−59 years of age comprised about 42.0%. Future studies should collect data following the gender and age ratios of the general population.
Second, among the respondents, only 29 respondents
(13.2%) had no disease. The remainder of the respondents who had a disease mostly had hypertension (34.7%) and dia- betes (30.6%). Future studies should design be designed to focus on patients with specific medical conditions.
Third, the surveys of the users group and the non‐users group were conducted at different types of health care insti- tutions, that is, Changwon City Health Center and university hospitals. Future studies should design the surveys to be conducted at the same types of medical institutions.
Although this study had some limitations, this study yielded some valuable implications. To our knowledge, there have been no previous studies conducted on the percep- tion of various factors influencing the acceptance of mobile health monitoring services between users and non‐users in South Korea. This study also provides insight and practical guideline to enhance and promote mobile health monitoring services.
Conflicts of Interest
No potential conflict of interest relevant to this article was reported.
Acknowledgments
Authors express sincere gratitude for the support of the Changwon City Health Center. We would like to thank Ji- Hwan Park and Kang-Suk Han, for your survey support.
References
1. Korean Health Industry Development Institution. 2009 Health care industry trends, issues and analysis. Cheon- gwon, Korea: Korean Health Industry Development Institution; 2009.
2. Istepanian RS, Sungoor A, Earle KA. Technical and compliance considerations for mobile health self- monitoring of glucose and blood pressure for patients with diabetes. Conf Proc IEEE Eng Med Biol Soc 2009;2009:5130-3.
3. Nundy S, Dick JJ, Goddu AP, Hogan P, Lu CY, Solomon MC, et al. Using mobile health to support the chronic care model: developing an institutional initiative. Int J Telemed Appl 2012;2012:871925.
4. Medical Service Act, Article 34: Remote Medical Treat- ment Law (Dec 8, 2011).
5. Yoo T, Koh HJ, Ou SW. Tele-primary care and pa- tient satisfaction in Korea. J Korean Soc Med Inform 2003;9(1):17-24.
6. Lim S, Kim SY, Kim JI, Kwon MK, Min SJ, Yoo SY, et al. A survey on ubiquitous healthcare service de- mand among diabetic patients. Diabetes Metab J 2011;35(1):50-7.
7. Park H, Chon Y, Lee J, Choi IJ, Yoon KH. Service de- sign attributes affecting diabetic patient preferences of telemedicine in South Korea. Telemed J E Health 2011;17(6):442-51.
8. Bakken S, Grullon-Figueroa L, Izquierdo R, Lee NJ, Morin P, Palmas W, et al. Development, validation, and use of English and Spanish versions of the telemedicine satisfaction and usefulness questionnaire. J Am Med In- form Assoc 2006;13(6):660-7.
9. van Bon AC, Kohinor MJ, Hoekstra JB, von Basum G, deVries JH. Patients’ perception and future accep- tance of an artificial pancreas. J Diabetes Sci Technol 2010;4(3):596-602.
10. Heart T, Kalderon E. Older adults: are they ready to adopt health-related ICT? Int J Med Inform 2011 Apr 8. [Epub]. Available from: http://www.ijmijournal.com/
article/S1386-5056(11)00068-2/fulltext.
11. Yip MP, Chang AM, Chan J, MacKenzie AE. Develop- ment of the Telemedicine Satisfaction Questionnaire to evaluate patient satisfaction with telemedicine: a pre- liminary study. J Telemed Telecare 2003;9(1):46-50.
12. Hjelm NM. Benefits and drawbacks of telemedicine. J Telemed Telecare 2005;11(2):60-70.
13. Katz SJ, Moyer CA. The emerging role of online com- munication between patients and their providers. J Gen Intern Med 2004;19(9):978-83.
14. van der Vaart R, Drossaert CH, Taal E, van de Laar MA.
Patient preferences for a hospital-based rheumatology Interactive Health Communication Application and fac- tors associated with these preferences. Rheumatology (Oxford) 2011;50(9):1618-26.
15. Eikelboom RH, Atlas MD. Attitude to telemedicine, and willingness to use it, in audiology patients. J Telemed Telecare 2005;11 Suppl 2:S22-5.
16. Martinez A, Everss E, Rojo-Alvarez JL, Figal DP, Garcia- Alberola A. A systematic review of the literature on home monitoring for patients with heart failure. J Telemed Telecare 2006;12(5):234-41.
17. Varkey P, Schumacher K, Swanton C, Timm B, Hagen PT. Telemedicine in the work site: a study of feasibility, and patient and provider satisfaction. J Telemed Telec- are 2008;14(6):322-5.
18. Basoglu N, Daim TU, Topacan U. Determining pa- tient preferences for remote monitoring. J Med Syst 2012;36(3):1389-401.
19. Shore JH, Brooks E, Savin D, Orton H, Grigsby J, Man- son SM. Acceptability of telepsychiatry in American Indians. Telemed J E Health 2008;14(5):461-6.
20. Houston TK, Sands DZ, Jenckes MW, Ford DE. Experi- ences of patients who were early adopters of electronic communication with their physician: satisfaction, ben- efits, and concerns. Am J Manag Care 2004;10(9):601-8.
21. Buysse HE, Coorevits P, Van Maele G, Hutse A, Kaufman J, Ruige J, et al. Introducing telemonitoring for diabetic patients: development of a telemonitoring
‘Health Effect and Readiness’ Questionnaire. Int J Med Inform 2010;79(8):576-84.
22. Lim N. Consumers’ perceived risk: sources versus conse- quences. Electron Commer Res Appl 2003;2(3):216-28.
23. Venkatesh V, Morris MG, Davis GB, Davis FD. User ac- ceptance of information technology: toward a unified view. MIS Q 2003;27(3):425-78.
24. Nwabueze SN, Mandela N, Meso PN, Mbarika VW, Kifle M, Okoli C, et al. The effects of culture of adoption of telemedicine in medically underserved communities.
In: Proceedings of the 42nd Hawaii International Con- ference on System Sciences; 2009 Jan 5-8; Big Island, HI.
25. Kim C, Mirusmonov M, Lee I. An empirical examina- tion of factors influencing the intention to use mobile payment. Comput Human Behav 2010;26(3):310-22.
26. Chang IC, Hwang HG, Hung WF, Li YC. Physicians’
acceptance of pharmacokinetics-based clinical decision support systems. Expert Syst Appl 2007;33(2):296-303.
27. Nuq PA. Innovation adoption (behavioral intention) for eHealth services in developing countries: a conceptual framework. J Int Univ Genava Bus Rev 2009;2(1):75-80.
28. Schaper LK, Pervan GP. ICT and OTs: a model of infor- mation and communication technology acceptance and utilisation by occupational therapists. Int J Med Inform 2007;76 Suppl 1:S212-21.
29. Wilson EV, Lankton NK. Modeling patients’ acceptance of provider-delivered e-health. J Am Med Inform Assoc 2004;11(4):241-8.
30. Chismar WG, Wiley-Patton S. Test of the technology acceptance model for the internet in pediatrics. Proc AMIA Symp 2002;2002:155-9.
31. Puuronen S, Vasilyeva E, Pechenizkiy M, Tesanovic A.
A holistic framework for understanding acceptance of Remote Patient Management (RPM) systems by non- professional users. In: Proceedings of the 23rd IEEE International Symposium on Computer-Based Medical Systems; 2010 Oct 12-15; Perth, Australia. p. 426-31.
32. Cranen K, Drossaert CH, Brinkman ES, Braakman-Jansen AL, Ijzerman MJ, Vollenbroek-Hutten MM. An explora-
tion of chronic pain patients’ perceptions of home telere- habilitation services. Health Expect 2012;15(4):339-50.
33. Jia H, Chuang HC, Wu SS, Wang X, Chumbler NR.
Long-term effect of home telehealth services on preventable hospitalization use. J Rehabil Res Dev 2009;46(5):557-66.
34. Mair FS, Goldstein P, May C, Angus R, Shiels C, Hib- bert D, et al. Patient and provider perspectives on home telecare: preliminary results from a randomized con- trolled trial. J Telemed Telecare 2005;11(Suppl 1):95-7.
35. Nunnally JC. Psychometric theory. New York (NY):
McGraw-Hill; 1978.
36. Hair JF, Black WC, Babin BJ, Anderson RE. Multivariate data analysis. 7th ed. Upper Saddle River (NJ): Prentice- Hall; 2010.
37. Choi W, Rho MJ, Park J, Kim KJ, Kwon YD, Choi IY. In- formation system success model for customer relation- ship management system in health promotion centers.
Healthc Inform Res 2013;19(2):110-20.