• 검색 결과가 없습니다.

Nonalcoholic Fatty Liver Disease and Abdominal Fat Accumulation According to Vitamin D Status in Patients with Type 2 Diabetes

N/A
N/A
Protected

Academic year: 2021

Share "Nonalcoholic Fatty Liver Disease and Abdominal Fat Accumulation According to Vitamin D Status in Patients with Type 2 Diabetes"

Copied!
8
0
0

로드 중.... (전체 텍스트 보기)

전체 글

(1)

Nonalcoholic Fatty Liver Disease and Abdominal Fat Accumulation According to Vitamin D Status in

Patients with Type 2 Diabetes

Dug-Hyun Choi, Chan-Hee Jung, Ji-Oh Mok, Chul-Hee Kim, Sung Koo Kang, Bo-Yeon Kim*

Division of Endocrinology and Metabolism, Department of Internal Medicine, Soonchunhyang University Bucheon Hospital, Soonchunhyang University College of Medicine, Bucheon, Korea

Background: Vitamin D deficiency is known to increase the incidence of metabolic syndrome. Nonalcoholic fatty liver disease is a common metabolic disease in patients with type 2 diabetes. This study evaluated nonalco- holic fatty liver disease and abdominal fat accumulation according to 25-hydroxyvitamin D status in patients with type 2 diabetes.

Methods: The study comprised 302 patients with type 2 diabetes. Patients were divided into three groups based upon their 25-hydroxyvitamin D status: vitamin D deficient group (<10 ng/mL), vitamin D insufficient group (≥10 to <20 ng/mL) and vitamin D sufficient group (≥20 ng/mL). Patient clinical and laboratory markers were evaluated retrospectively.

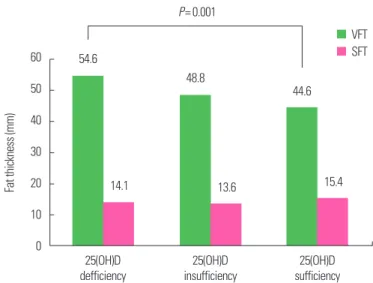
Results: Visceral fat thickness was significantly higher in the vitamin D deficient group. There were no differenc- es in glycemic control, body mass index, and subcutaneous fat thickness correlated with 25-hydroxyvitamin D status. The prevalence of nonalcoholic fatty liver disease was significantly higher in the vitamin D deficient group compared to the vitamin D sufficient and vitamin D insufficient groups. In multivariate logistic analysis, after ad- justment for age, sex, body mass index, glycated hemoglobin and homeostasis model assessment of insulin re- sistance, patients with type 2 diabetes in the vitamin D sufficient group showed significantly lower odds ratio for nonalcoholic fatty liver disease than those within the vitamin D deficient group.

Conclusion: In type 2 diabetes, the vitamin D deficient group showed thicker visceral fat thickness and higher nonalcoholic fatty liver disease prevalence.

Key words: Non-alcoholic fatty liver disease, Vitamin D, Type 2 diabetes mellitus

Received October 30, 2017 Reviewed November 23, 2017 Accepted December 22, 2017

* Corresponding author Bo-Yeon Kim

https://orcid.org/0000-0002-3658-2351 Division of Endocrinology and Metabolism, Department of Internal Medicine, Soonchunhyang University Bucheon Hospital, Soonchunhyang University College of Medicine, 170 Jomaru-ro, Wonmi-gu, Bucheon 14584, Korea

Tel: +82-32-621-5157 Fax: +82-32-621-5017 E-mail: [email protected]

INTRODUCTION

Recently, vitamin D has been studied as an important factor in the development of many diseases, and its importance is not limit- ed to its classic role in bone health. Many previous works have shown an association between vitamin D deficiency or insufficien- cy and many disease like cardiovascular disease

1,2

, cancer

3,4

, and in- fection.

5

The relationship between vitamin D levels and the devel- opment of type 2 diabetes mellitus

6-8

and metabolic syndrome

9-11

has also been a recent focus and many studies have reported that low vitamin D levels are associated with insulin resistance and the onset of metabolic syndrome.

Nonalcoholic fatty liver disease (NAFLD) is a metabolic disease of liver associated with insulin resistance. NAFLD is a common condition among patients with type 2 diabetes and according to a meta-analysis reported in 2016, its comorbidity with type 2 diabe- tes is about 22.51%.

12

The presence of NAFLD in type 2 diabetes can increase the incidence of vascular complications including car-

Copyright © 2018 Korean Society for the Study of Obesity

This is an Open Access article distributed under the terms of the Creative Commons Attribution Non-Commercial License (http://creativecommons.org/licenses/by-nc/4.0/) which per- mits unrestricted non-commercial use, distribution, and reproduction in any medium, provided the original work is properly cited.

Original Article eISSN 2508-7576

2017-03-16 https://crossmark-cdn.crossref.org/widget/v2.0/logos/CROSSMARK_Color_square.svg

(2)

diovascular disease.

13,14

Previous studies have shown that lower lev- els of vitamin D may contribute to NAFLD and abdominal obesi- ty.

10,15-17

Furthermore, the negative effect of low vitamin D levels on insulin resistance and vascular complications of type 2 diabetes has recently been suggested.

18-20

Still, the underlying mechanism for the association between vitamin D levels and NAFLD is not entirely known and more human research is needed. In this study, we evalu- ated NAFLD and abdominal fat accumulation according to vita- min D status in patients with type 2 diabetes.

METHODS Subjects

Data from patients with type 2 diabetes who visited the diabetes clinic at Soonchunhyang University Bucheon Hospital from 2011 to 2014 were analyzed retrospectively. Patients with type 2 diabetes (n= 995) who underwent regular outpatient clinic follow-up for more than 2 years were included. The following patients were ex- cluded: (1) patients (n= 378) in whom abdominal ultrasonogra- phy was not performed, (2) those (n= 92) who were taking calci- um, vitamin D supplementation or osteoporosis therapies or had uncontrolled thyroid or parathyroid disease, (3) those (n= 120) in whom serum vitamin D levels were not measured, and (4) those (n= 103) who had other chronic liver diseases, any viral hepatitis patients and viral carriers, hemochromatosis patients, any hepatic malignancy patients and alcoholic liver disease patients or heavy al- cohol drinkers (more than 140 g/wk of pure alcohol).

The remaining 302 patients with type 2 diabetes were ultimately included. We used patient medical records to carefully review their demographic and biochemical data. This study was approved by the Institutional Review Board of Soonchunhyang University Bu- cheon Hospital (IRB No. 2017-10-020). The informed consent was exempted from the Institutional Review Board because this study is a retrospective and analytical study.

Laboratory biomarker measurements

Laboratory biomarkers measured included fasting glucose, gly- cated hemoglobin (HbA1c), C-peptide, insulin, total cholesterol, triglyceride, low-density lipoprotein cholesterol, high-density lipo- protein cholesterol, aspartate aminotransferase (AST), alanine

aminotransferase (ALT) and serum creatinine. Ion-exchange high- performance liquid chromatography (Bio-Rad, Hercules, CA, USA) was used to measure HbA1c. Homeostasis model assess- ment of insulin resistance (HOMA-IR) was calculated using the following formula: fasting insulin (μIU/mL)× fasting plasma glu- cose (mg/dL)/405.

The vitamin D status was evaluated by measuring the level of 25-hydroxyvitamin D (25(OH)D), a commonly used marker for vitamin D status. 25(OH)D concentration was measured using a radioimmunoassay (CIS Bio International, Paris, France). Patients were divided into three groups according to their 25(OH)D levels:

the vitamin D deficient group (n= 116, 25(OH)D < 10 ng/mL), the vitamin D insufficient group (n= 118, 10 ng/mL≤ 25(OH)D

<20 ng/mL) and the vitamin D sufficient group (n=68, 25(OH)D

≥ 20 ng/mL). Cutoff levels for vitamin D status were as defined in the World Health Organization guidelines and by the Institute of Medicine.

21,22

Abdominal fat and NAFLD assessment

Ultrasonography was used to assess visceral fat thickness (VFT) and abdominal subcutaneous fat thickness (SFT). The distance between the posterior aspect of the rectus abdominis muscle and the anterior wall of the aorta was defined as VFT

23

and the maxi- mal thickness of the fat tissue layer from the skin-fat interface to the linea alba was defined as SFT. A single experienced investigator measured abdominal fat thickness using a high-resolution B-mode ultrasonography. The 3.5-MHz convex-array probe and a 12-MHz linear-array probe were used to measure VFT and SFT, respective- ly. The intraobserver technical measurement errors for VFT and SFT were between 1.4%–2.3% and 1.1%–1.7%, respectively.

Skilled radiologists and gastroenterologists performed the abdomi- nal ultrasonography. Hepatic steatosis was diagnosed based on characteristic sonographic features, i.e., diffuse hyper-echogenicity of the liver relative to the kidneys, vascular blurring and ultrasound beam attenuation.

Statistical analysis

SPSS version 14.0 software (SPSS Inc., Chicago, IL, USA) was

used to conduct the statistical analysis. Results are summarized

with mean and standard deviation for continuous variables. Skewed

(3)

distributed variables, like fasting glucose, HbA1c, AST, ALT and lipid profiles, were log-transformed and then analyzed. A chi- square test was performed to compare categorical variables. A stu- dent t-test was used to evaluate the significance of the mean differ- ences including 25(OH)D levels in patients with and without NAFLD and in those without NAFLD. One-way analysis of vari- ance was performed to evaluate the differences of means among groups according to the 25(OH)D levels. The correlation between serum 25(OH)D and clinical parameters was analyzed with Pear- son or Spearman correlation analyses. Multivariate logistic regres- sion was performed to determine the odds ratios (ORs) for NAFLD after adjusting for other variables. P-values less than 0.05 were considered as statistically significant.

RESULTS

The prevalences of vitamin D deficient and vitamin D sufficient patients among patients with type 2 diabetes were 38.4% and 22.5%, respectively. The prevalence of NAFLD in all patients with type 2 diabetes included in the study was 62.9%. The mean levels of 25(OH)D were 21.7± 14.1 ng/mL and 15.1± 9.7 ng/mL in pa- tients with type 2 diabetes with or without NAFLD, respectively (P=0.003).

The clinical and demographic characteristics of patients are de- scribed in Table 1. The mean ages of vitamin D deficient, vitamin D insufficient, and vitamin D sufficient groups were 59.1, 55.3, and 59.9 years. Body mass index (BMI) was not statistically different

Table 1. Clinical and demographic characteristics of study participants according to vitamin D status

Variable Vitamin D deficient group (n= 116) Vitamin D insufficient group (n= 118) Vitamin D sufficient group (n= 68) P Anthropometric parameter

Age (yr) 59.1± 15.8 55.3± 16.1 59.9± 15.6 0.390

Male sex (%) 23.5 48.8 43.2 0.070

BMI (kg/m

2

) 24.4± 4.0 24.8± 4.2 25.2± 3.8 0.378

Hypertension (%) 47.1 41.5 59.5 0.378

SBP (mmHg) 123.8± 15.6 128.1± 17.1 123.9± 16.6 0.431

DBP (mmHg) 72.5± 11.1 78.0± 10.9 75.2± 10.7 0.096

Duration of diabetes (yr) 8.0± 10.6 6.8± 5.6 7.1± 6.3 0.782

Biochemical metabolic parameter

25(OH)D (ng/mL) 7.0± 2.3 14.6± 2.8 30.9± 10.9 < 0.001

FPG (mg/dL) 185.5± 69.9 162.5± 66.5 209.8± 120.5 0.593

HbA1c (%) 9.4± 1.9 10.5± 2.4 10.6± 3.4 0.136

Total cholesterol (mg/dL) 173.0± 50.2 172.2± 59.9 168.1± 73.9 0.937

Triglyceride (mg/dL) 166.1± 161.8 166.3± 104.2 178.3± 138.5 0.907

HDL cholesterol (mg/dL) 39.8± 47.1 35.4± 43.9 35.5± 41.9 0.178

LDL cholesterol (mg/dL) 88.9± 117.2 87.4± 124.2 78.2± 95.6 0.133

AST (IU/L) 28.0± 25.0 24.9± 16.2 22.2± 13.1 0.227

ALT (IU/L) 31.5± 33.6 31.9± 26.3 27.7± 24.9 0.677

Creatinine (mg/dL) 1.2± 0.6 1.4± 1.1 1.2± 0.4 0.300

Fasting insulin (µIU/mL) 7.6± 6.7 9.8± 7.3 12.6± 12.5 0.103

Fasting C-peptide (ng/mL) 2.1± 1.4 2.9± 2.0 3.6± 3.5 0.037

HOMA-IR 4.4± 5.4 2.5± 2.1 3.6± 3.1 0.112

Treatment modality 0.032

No treatment (%) 23.5 25.7 22.2

OHA (%) 35.3 34.3 36.1

Insulin (%) 35.3 20.0 22.2

OHA+insulin (%) 5.9 17.1 19.4

Values are presented as mean± standard deviation. Chi-square test was used to compare sex, hypertension, and treatment modality.

Vitamin D deficient group, 25(OH)D < 10 ng/mL; Vitamin D insufficient group, 10 ng/mL≤ 25(OH)D < 20 ng/mL; Vitamin D sufficient group, 25(OH)D ≥ 20 ng/mL; BMI, body mass in-

dex; SBP, systolic blood pressure; DBP, diastolic blood pressure; 25(OH)D, 25-hydroxyvitamin D; FPG, fasting plasma glucose; HbA1c, glycated hemoglobin; HDL, high-density lipopro-

tein; LDL, low-density lipoprotein; AST, aspartate aminotransferase; ALT, alanine aminotransferase; HOMA-IR, homeostasis model assessment of insulin resistance; OHA, oral hypo-

glycemic agent.

(4)

between the three groups (24.4± 4.0 kg/m

2

in the vitamin D defi- cient group, 24.8± 4.2 kg/m

2

in the vitamin D insufficient group, and 25.2± 3.8 kg/m

2

in the vitamin D sufficient group; P=0.378).

Levels of fasting plasma C-peptide were significantly increased ac- cording to the increase in 25(OH)D (2.1± 1.4 ng/mL in the vita- min D deficient group, 2.9± 2.0 ng/mL in the vitamin D insuffi- cient group, and 3.6± 3.5 ng/mL in the vitamin D sufficient group, P=0.037). However, no statistical differences in serum fasting plasma glucose, HbA1c, lipid profiles, AST, ALT and HOMA-IR were found according to 25(OH)D status.

Serum 25(OH)D levels were positively correlated with systolic blood pressure, fasting C-peptide, and fasting insulin (Table 2).

VFT was significantly higher in the vitamin D deficient group com- pared to in the vitamin D sufficient group (54.6 mm vs. 44.6 mm, P=0.001), but no differences in SFT were found to correlate with 25(OH)D status (Fig. 1). The prevalence of NAFLD was signifi- cantly higher in the vitamin D deficient group compared to the vi- tamin D sufficient and vitamin D insufficient groups (75.0% vs.

36.4% vs. 64.0%, P=0.001) (Fig. 2). In multivariate logistic analy-

sis, after adjustment for age, sex, BMI, HbA1c, and HOMA-IR, ORs and 95% confidence intervals for NAFLD in both the vitamin D sufficient (0.109 [0.035–0.342], P<0.001) and vitamin D insuf- ficient groups (0.244 [0.075–0.793], P=0.019) were significantly lower than in the vitamin D deficient group (Table 3).

DISCUSSION

According to the Fourth Korea National Health and Nutrition Examination Surveys (KNHANES IV), vitamin D insufficiency is very common among Koreans.

24

In our cohort, only 22.5% of pa- Table 2. Correlations between vitamin D levels and clinical and biochemical vari-

ables

Variable 25(OH)D

r P

Age (yr) 0.117 0.111

BMI (kg/m

2

) 0.118 0.113

SBP (mmHg) 0.062 0.011

DBP (mmHg) 0.037 0.351

Duration of diabetes (yr) 0.019 0.421

FPG (mg/dL) 0.087 0.186

HbA1c (%) 0.052 0.294

Total cholesterol (mg/dL) –0.097 0.234

Triglyceride (mg/dL) –0.006 0.475

HDL cholesterol (mg/dL) –0.155 0.053

LDL cholesterol (mg/dL) –0.150 0.061

AST (IU/L) –0.119 0.162

ALT (IU/L) –0.085 0.319

Creatinine (mg/dL) –0.069 0.234

Fasting insulin (µIU/mL) 0.235 0.010

Fasting C-peptide (ng/mL) 0.287 0.002

HOMA-IR –0.264 0.112

25(OH)D, 25-hydroxyvitamin D; BMI, body mass index; SBP, systolic blood pressure;

DBP, diastolic blood pressure; FPG, fasting plasma glucose; HbA1c, glycated hemoglo- bin; HDL, high-density lipoprotein; LDL, low-density lipoprotein; AST, aspartate amino- transferase; ALT, alanine aminotransferase; HOMA-IR, homeostasis model assessment of insulin resistance.

Figure 1. Visceral (VFT) and subcutaneous fat thicknesses (SFT) according to vita- min D status in patients with type 2 diabetes. 25(OH)D, 25-hydroxyvitamin D.

60 50 40 30 20 10 0

Fat thickness (mm)

25(OH)D

defficiency 25(OH)D

insufficiency 25(OH)D

sufficiency P= 0.001

54.6

48.8 44.6

14.1 13.6 15.4

VFT SFT

Figure 2. The prevalence of nonalcoholic fatty liver disease (NAFLD) according to vitamin D status in patients with type 2 diabetes. 25(OH)D, 25-hydroxyvitamin D.

80 70 60 50 40 30 20 10 0

Prevalence of NAFLD (%)

25(OH)D

deficiency 25(OH)D

insufficiency 25(OH)D

sufficiency P= 0.001

75.0

64.0

36.4

(5)

tients had serum vitamin D levels above 30 ng/mL. The results of our study suggest that low vitamin D levels are associated with NAFLD and abdominal visceral fat accumulation in Korean pa- tients with type 2 diabetes. In this study, the lower prevalence of NAFLD among patients with higher levels of vitamin D remained significant even after adjusting for possible confounding factors like age, sex, BMI, HbA1c, and HOMA-IR. Some studies have also demonstrated the association between levels of vitamin D and the risk of NAFLD.

25,26

Moreover, a recent study based on data from the U. S. Third National Health and Nutrition Examination Survey reported that vitamin D levels were associated with mortality from diabetes and Alzheimer disease in NAFLD.

27

A randomized pro- spective study consisting of 81 NAFLD patients showed that the addition of vitamin D along with lifestyle modification resulted in significant improvements in serum ALT and adiponectin levels.

Because vitamin D is known to be involved in immune regulation, cell differentiation and proliferation, and inflammatory responses, low levels of vitamin D are thought to play a part in the pathogene- sis of NAFLD by upregulating hepatic inflammation through adi- pocytokines.

28

In our study, no differences in glycemic control, HOMA-IR, BMI, or abdominal SFT were found between groups with different 25(OH)D status. However, abdominal VFT was significantly high- er in the vitamin D deficient group compared to the vitamin D suf- ficient group. Previous data has suggested that abdominal obesity is significantly associated with vitamin D deficiency.

16,17

Cheng et al.

29

reported that lower vitamin D levels were associated with greater

regional adiposity in the Framingham Heart Study. In a Malaysian study, vitamin D insufficiency was independently associated with greater abdominal obesity.

30

These studies reported that the associ- ation between vitamin D and visceral fat was more potent than with abdominal subcutaneous fat.

In this study, serum 25(OH)D levels were not correlated with glycemic control and HOMA-IR, but did correlate significantly with fasting C-peptide and insulin levels. Results from previous studies on the association between vitamin D deficiency and glyce- mic control and insulin resistance in patients with type 2 diabetes have been inconsistent.

31-34

The presence of vitamin D receptors on pancreatic β cells

35

and the presence of a vitamin D response ele- ment in the insulin gene

36

are suggested mechanisms for the effect of vitamin D on pancreatic β cells. A prospective study by Kayaniyil et al.

34

reported that higher vitamin D levels independently predict- ed better β-cell function in type 2 diabetes. However, a case-control study by Fondjo et al.

32

reported there was no association between vitamin D deficiency and insulin resistance or β cell function.

These results are thought to be inconsistent due to differences in race, ethnicity, obesity and nutritional status. For our current study, since the participants were patients with type 2 diabetes, previous usage of oral hypoglycemic agents may have interfered with the HOMA-IR results.

Our current study has several limitations. First, since our study was designed to be cross-sectional, we could not determine the causal relationship between vitamin D levels and NAFLD and ab- dominal visceral fat accumulation. Second, due to the lack of data, we could not classify NAFLD by severity. Other possible impor- tant factors confounding the vitamin D levels, like outside activity, dietary habits and seasonal variations in vitamin D, were also not included in our study. Sex difference also is an important factor.

Stadlmayr et al.

37

reported that vitamin D levels are independently associated with type 2 diabetes in women, but not in men. Verdoia et al.

38

also reported that lower vitamin D levels in women play a more relevant role in conditioning the severity of coronary artery disease than in men. Also, as previously known, sex is an important factor in the assessment of abdominal fat and NAFLD. However, in our current study, probably due to lack of data, we could not derive significant results from differences in sex. Nevertheless, we adjusted for sex difference in our multivariate logistic analysis of vitamin D Table 3. Multivariate logistic regression analysis with the presence and absence

of NAFLD as the dependent variable

Variable Odds ratio (95% CI) P

Age 0.968 (0.935–1.003) 0.071

Sex (male) 0.780 (0.302 –2.011) 0.606

BMI 1.156 (1.017–1.313) 0.026

HbA1c 1.007 (0.858–1.182) 0.930

25(OH)D (ng/mL)

< 10 1

≥ 10 & < 20 0.244 (0.075–0.793) 0.019

≥ 20 0.109 (0.035 –0.342) < 0.001

HOMA-IR 1.072 (0.935 –1.230) 0.317

NAFLD, nonalcoholic fatty liver disease; CI, confidence interval; BMI, body mass index;

HbA1c, glycated hemoglobin; 25(OH)D, 25-hydroxyvitamin D; HOMA-IR, homeostasis

model assessment of insulin resistance.

(6)

and NAFLD. Due to lack of data, the above-mentioned factor in- cluding the sex difference should be investigated in a future study.

Finally, since our study was based on a single clinical center, there is a possibility of selection bias on the results. Nonetheless, this sin- gle-center study also conferred a high degree of consistency with respect to laboratory data and the evaluation of NAFLD.

Despite these limitations, our study has strength in that the pa- tients were divided into three groups based upon their vitamin D status, and the important metabolic variables in each group were compared and evaluated with each other group. Moreover, this study had a high degree of consistency with respect to laboratory data and the evaluation of NAFLD. The association of vitamin D with the development of many chronic diseases has been the focus of much research recently. The important role of vitamin D on the development of metabolic disease including NAFLD has been es- tablished, but many more studies are needed because the data are still incoherent. In this study, the vitamin D deficient group had a thicker VFT and higher NAFLD prevalence than either the vita- min D sufficient or vitamin D insufficient groups. Larger prospec- tive studies will be required to elucidate the associations between vitamin D levels and NAFLD and abdominal fat in patients with type 2 diabetes.

CONFLICTS OF INTEREST

The authors declare no conflict of interest.

ACKNOWLEDGMENTS

This work was supported by the Soonchunhyang University Re- search Fund.

REFERENCES

1. Poole KE, Loveridge N, Barker PJ, Halsall DJ, Rose C, Reeve J, et al. Reduced vitamin D in acute stroke. Stroke 2006;37:243-5.

2. Giovannucci E, Liu Y, Hollis BW, Rimm EB. 25-Hydroxyvita- min D and risk of myocardial infarction in men: a prospective study. Arch Intern Med 2008;168:1174-80.

3. Giovannucci E, Liu Y, Rimm EB, Hollis BW, Fuchs CS, Stamp-

fer MJ, et al. Prospective study of predictors of vitamin D sta- tus and cancer incidence and mortality in men. J Natl Cancer Inst 2006;98:451-9.

4. Jenab M, Bueno-de-Mesquita HB, Ferrari P, van Duijnhoven FJ, Norat T, Pischon T, et al. Association between pre-diagnos- tic circulating vitamin D concentration and risk of colorectal cancer in European populations: a nested case-control study.

BMJ 2010;340:b5500.

5. Ginde AA, Mansbach JM, Camargo CA Jr. Association be- tween serum 25-hydroxyvitamin D level and upper respiratory tract infection in the Third National Health and Nutrition Ex- amination Survey. Arch Intern Med 2009;169:384-90.

6. Mattila C, Knekt P, Männistö S, Rissanen H, Laaksonen MA, Montonen J, et al. Serum 25-hydroxyvitamin D concentration and subsequent risk of type 2 diabetes. Diabetes Care 2007;

30:2569-70.

7. Pittas AG, Lau J, Hu FB, Dawson-Hughes B. The role of vita- min D and calcium in type 2 diabetes: a systematic review and meta-analysis. J Clin Endocrinol Metab 2007;92:2017-29.

8. Chiu KC, Chu A, Go VL, Saad MF. Hypovitaminosis D is as- sociated with insulin resistance and beta cell dysfunction. Am J Clin Nutr 2004;79:820-5.

9. Maki KC, Fulgoni VL 3rd, Keast DR, Rains TM, Park KM, Rubin MR. Vitamin D intake and status are associated with lower prevalence of metabolic syndrome in U.S. adults: Na- tional Health and Nutrition Examination Surveys 2003-2006.

Metab Syndr Relat Disord 2012;10:363-72.

10. Angelico F, Del Ben M, Conti R, Francioso S, Feole K, Fiorel- lo S, et al. Insulin resistance, the metabolic syndrome, and nonalcoholic fatty liver disease. J Clin Endocrinol Metab 2005;

90:1578-82.

11. Shin SR, Han AL, Park SH. Vitamin D status and its relation with abdominal adiposity and cardiovascular risk factors of Korean adults in certain areas. Korean J Obes 2015;24:30-5.

12. Younossi ZM, Koenig AB, Abdelatif D, Fazel Y, Henry L, Wymer M. Global epidemiology of nonalcoholic fatty liver disease: meta-analytic assessment of prevalence, incidence, and outcomes. Hepatology 2016;64:73-84.

13. Targher G, Bertolini L, Poli F, Rodella S, Scala L, Tessari R, et

al. Nonalcoholic fatty liver disease and risk of future cardiovas-

(7)

cular events among type 2 diabetic patients. Diabetes 2005;54:

3541-6.

14. Hazlehurst JM, Woods C, Marjot T, Cobbold JF, Tomlinson JW. Non-alcoholic fatty liver disease and diabetes. Metabolism 2016;65:1096-108.

15. Ganji V, Zhang X, Tangpricha V. Serum 25-hydroxyvitamin D concentrations and prevalence estimates of hypovitaminosis D in the U.S. population based on assay-adjusted data. J Nutr 2012;142:498-507.

16. Bhatt SP, Misra A, Sharma M, Guleria R, Pandey RM, Luthra K, et al. Vitamin D insufficiency is associated with abdominal obesity in urban Asian Indians without diabetes in North In- dia. Diabetes Technol Ther 2014;16:392-7.

17. Hannemann A, Thuesen BH, Friedrich N, Völzke H, Stevel- ing A, Ittermann T, et al. Adiposity measures and vitamin D concentrations in Northeast Germany and Denmark. Nutr Metab (Lond) 2015;12:24.

18. Kayaniyil S, Vieth R, Retnakaran R, Knight JA, Qi Y, Gerstein HC, et al. Association of vitamin D with insulin resistance and beta-cell dysfunction in subjects at risk for type 2 diabetes. Di- abetes Care 2010;33:1379-81.

19. Herrmann M, Sullivan DR, Veillard AS, McCorquodale T, Straub IR, Scott R, et al. Serum 25-hydroxyvitamin D: a pre- dictor of macrovascular and microvascular complications in patients with type 2 diabetes. Diabetes Care 2015;38:521-8.

20. Bajaj S, Singh RP, Dwivedi NC, Singh K, Gupta A, Mathur M.

Vitamin D levels and microvascular complications in type 2 diabetes. Indian J Endocrinol Metab 2014;18:537-41.

21. Looker AC, Johnson CL, Lacher DA, Pfeiffer CM, Schleicher RL, Sempos CT. Vitamin D status: United States, 2001-2006.

NCHS Data Brief 2011;(59):1-8.

22. Ross AC, Manson JE, Abrams SA, Aloia JF, Brannon PM, Clinton SK, et al. The 2011 report on dietary reference in- takes for calcium and vitamin D from the Institute of Medi- cine: what clinicians need to know. J Clin Endocrinol Metab 2011;96:53-8.

23. Kawamoto R, Ohtsuka N, Ninomiya D, Nakamura S. Associa- tion of obesity and visceral fat distribution with intima-media thickness of carotid arteries in middle-aged and older persons.

Intern Med 2008;47:143-9.

24. Choi HS, Oh HJ, Choi H, Choi WH, Kim JG, Kim KM, et al.

Vitamin D insufficiency in Korea: a greater threat to younger generation. The Korea National Health and Nutrition Exami- nation Survey (KNHANES) 2008. J Clin Endocrinol Metab 2011;96:643-51.

25. Eliades M, Spyrou E, Agrawal N, Lazo M, Brancati FL, Potter JJ, et al. Meta-analysis: vitamin D and non-alcoholic fatty liver disease. Aliment Pharmacol Ther 2013;38:246-54.

26. Wang X, Li W, Zhang Y, Yang Y, Qin G. Association between vitamin D and non-alcoholic fatty liver disease/non-alcoholic steatohepatitis: results from a meta-analysis. Int J Clin Exp Med 2015;8:17221-34.

27. Kim HS, Rotundo L, Kothari N, Kim SH, Pyrsopoulos N. Vi- tamin D is associated with severity and mortality of non-alco- holic fatty liver disease: a US population-based study. J Clin Transl Hepatol 2017;5:185-92.

28. Kwok RM, Torres DM, Harrison SA. Vitamin D and nonal- coholic fatty liver disease (NAFLD): is it more than just an association? Hepatology 2013;58:1166-74.

29. Cheng S, Massaro JM, Fox CS, Larson MG, Keyes MJ, Mc- Cabe EL, et al. Adiposity, cardiometabolic risk, and vitamin D status: the Framingham Heart Study. Diabetes 2010;59:242-8.

30. Moy FM, Bulgiba A. High prevalence of vitamin D insuffi- ciency and its association with obesity and metabolic syn- drome among Malay adults in Kuala Lumpur, Malaysia. BMC Public Health 2011;11:735.

31. Talaei A, Mohamadi M, Adgi Z. The effect of vitamin D on insulin resistance in patients with type 2 diabetes. Diabetol Metab Syndr 2013;5:8.

32. Fondjo LA, Owiredu WK, Sakyi SA, Laing EF, Adotey-Kwofie MA, Antoh EO, et al. Vitamin D status and its association with insulin resistance among type 2 diabetics: a case-control study in Ghana. PLoS One 2017;12:e0175388.

33. Afzal S, Bojesen SE, Nordestgaard BG. Low 25-hydroxyvita- min D and risk of type 2 diabetes: a prospective cohort study and metaanalysis. Clin Chem 2013;59:381-91.

34. Kayaniyil S, Retnakaran R, Harris SB, Vieth R, Knight JA,

Gerstein HC, et al. Prospective associations of vitamin D with

β-cell function and glycemia: the PROspective Metabolism

and ISlet cell Evaluation (PROMISE) cohort study. Diabetes

(8)

2011;60:2947-53.

35. Zittermann A. Vitamin D and disease prevention with special reference to cardiovascular disease. Prog Biophys Mol Biol 2006;92:39-48.

36. Maestro B, Dávila N, Carranza MC, Calle C. Identification of a vitamin D response element in the human insulin receptor gene promoter. J Steroid Biochem Mol Biol 2003;84:223-30.

37. Stadlmayr A, Aigner E, Huber-Schönauer U, Niederseer D,

Zwerina J, Husar-Memmer E, et al. Relations of vitamin D sta- tus, gender and type 2 diabetes in middle-aged Caucasians.

Acta Diabetol 2015;52:39-46.

38. Verdoia M, Schaffer A, Barbieri L, Di Giovine G, Marino P,

Suryapranata H, et al. Impact of gender difference on vitamin

D status and its relationship with the extent of coronary artery

disease. Nutr Metab Cardiovasc Dis 2015;25:464-70.

수치

Table 1. Clinical and demographic characteristics of study participants according to vitamin D status
Figure 1. Visceral (VFT) and subcutaneous fat thicknesses (SFT) according to vita- vita-min D status in patients with type 2 diabetes

참조

관련 문서

Effects of combined calcium and vitamin D supplementation on insulin secretion, insulin sensitivity and β -cell function in multi-ethnic vitamin D-deficient

Key word : Ca 2+ influx, GABA, galectin-1, glutamate, lipid accumulation, lysosomal exocytosis, neurotransmitter system, Niemann-Pick disease type C... List

The associations of hepatic steatosis and fibrosis using fatty liver index and BARD score with cardiovascular outcomes and mortality in patients with new‑onset type 2

To identify causal variants among EGFR SNPs associated with the risk of glioma in a Korean population, a logistic regression analysis under an additive model adjusted for age

In our study, however, change in abdominal visceral fat remained associated with future pulse pressure after adjusting for HOMA-IR and fasting plasma glucose, implying

Although visceral fat adiposity has known to be associated with clinical, pathologic, and oncologic outcomes in patients with colorectal cancer (CRC), the

1 reported the usefulness of the metabolic score for insulin resistance (METS-IR) in the screening and prediction of non- alcoholic fatty liver disease (NAFLD) in middle-aged

Effect of faecal microbiota transplan- tation for treatment of Clostridium difficile infection in patients with inflammatory bowel disease: a systematic review and meta-analysis