Framingham Risk Score Assessment in Subjects with Pre-diabetes and Diabetes: A Cross-Sectional Study in Korea
Hyuk Sang Kwon1, Kee Ho Song2, Jae Myung Yu3, Dong Sun Kim4, Ho Sang Shon5, Kyu Jeung Ahn6, Sung Hee Choi7, Seung Hyun Ko8, Won Kim9, Kyoung Hwa Lee9, Il Seong Nam-Goong10,*, Tae Sun Park11,*
1Division of Endocrinology and Metabolism, Department of Internal Medicine, Yeouido St. Mary’s Hospital, College of Medicine, The Catholic University of Korea, Seoul; 2Department of Internal Medicine, Konkuk University Medical Center, Konkuk University School of Medicine, Seoul; 3Department of Internal Medicine, Hallym University Kangnam Sacred Heart Hospital, Hallym University College of Medicine, Seoul; 4Division of Endocrinology and Metabolism, Department of Internal Medicine, Hanyang University Hospital, Seoul; 5Department of Internal Medicine, Catholic University of Daegu School of Medicine, Daegu; 6Department of Endocrinology and Metabolism, Kyung Hee University School of Medicine, Seoul; 7Department of Internal Medicine, Seoul National University Bundang Hospital, Seongnam; 8Department of Endocrinology and Metabolism, Department of Internal Medicine, St. Vincent’s Hospital, College of Medicine, The Catholic University of Korea, Suwon; 9Medical Department, Sanofi-Aventis Korea, Seoul; 10Department of Internal Medicine, Ulsan University Hospital, University of Ulsan College of Medicine, Ulsan; 11Division of Endocrinology and Metabolism, Department of Internal Medicine, Jeonbuk National University Hospital, Jeonbuk National University Medical School, Jeonju, Korea
Background: This study aimed to evaluate cardiovascular risk in subjects with pre-diabetes and diabetes in Korea.
Methods: In this pan-Korean, non-interventional, cross-sectional study, data were collected from medical re- cords of 10 hospitals between November 2013 and June 2014. Subjects (aged ≥40 years) with medical records of dysglycemia and documentation of total cholesterol level, high-density lipoprotein cholesterol level, systolic blood pressure, and smoking status in the past 6 months were included. The primary endpoint was to deter- mine the Framingham risk score (FRS). The relationships between FRS and cardiovascular risk factors, glycated hemoglobin, and insulin usage were determined by multiple linear regression analyses.
Results: Data from 1,537 subjects with pre-diabetes (n=1,025) and diabetes (n=512) were analyzed. The mean FRS (mean±standard deviation) in subjects with pre-diabetes/diabetes was 13.72±8.77. FRS was higher in subjects with diabetes than pre-diabetes (P<0.001). FRS in men with pre-diabetes was comparable to that in women with diabetes (13.80±7.37 vs. 13.35±7.13). FRS was elevated in subjects who consumed alcohol (2.66, P=0.033) and with obesity-class II (6.10, P=0.015) among subjects with diabetes (n=199), and was elevated in patients with left ventricular hypertrophy (11.10, P=0.005), those who consumed alcohol (3.06, P=0.000), were pre-obese (3.21, P=0.002), or were obesity-class I (2.89, P=0.002) among subjects with pre-diabetes (n=306) in comparison to subjects without these coexisting risk factors.
Conclusion: Overall, Korean subjects with pre-diabetes and diabetes have an increased cardiovascular risk, which is significantly higher in those subjects with diabetes than with pre-diabetes. The present data can be used to develop measures to prevent and manage cardiovascular complications in Koreans with impaired glu- cose metabolism.
Key words: Cardiovascular diseases, Diabetes mellitus, Risk assessment
Received December 29, 2020 Reviewed March 15, 2021 Accepted April 23, 2021
* Corresponding author Il Seong Nam-Goong
https://orcid.org/0000-0002-0492-0467 Department of Internal Medicine, Ulsan University Hospital, University of Ulsan College of Medicine, 877
Bangeojinsunhwan-doro, Dong-gu, Ulsan 44033, Korea
Tel: +82-52-250-7000 Fax: +82-52-250-8085 E-mail: isnamgoong@naver.com
* Co-Corresponding author Tae Sun Park
https://orcid.org/0000-0001-7216-8468 Division of Endocrinology and Metabolism, Department of Internal Medicine, Jeonbuk National University Hospital, Jeonbuk National University Medical School, 20 Geonji-ro, Deokjin-gu, Jeonju 54907, Korea Tel: +82-63-250-1794 Fax: +82-63-270-3053 E-mail: pts@chonbuk.ac.kr
The first two authors contributed equally to this study.
2017-03-16 https://crossmark-cdn.crossref.org/widget/v2.0/logos/CROSSMARK_Color_square.svg
Copyright © 2021 Korean Society for the Study of Obesity
This is an Open Access article distributed under the terms of the Creative Commons Attribution Non-Commercial License (https://creativecommons.org/licenses/by-nc/4.0/) which permits unrestricted non-commercial use, distribution, and reproduction in any medium, provided the original work is properly cited.
INTRODUCTION
In the last few decades, there has been a global increase in the prevalence of pre-diabetes and diabetes.1 In 2019, the worldwide prevalence of pre-diabetes among adults aged 20–79 years was 7.5% while that of diabetes was 9.3%; these values have been pro- jected to increase to 8.6% and 10.9%, respectively, by 2045.1 Con- tribution of the Western Pacific region to the total global diabetes disease burden is approximately 35%.1 Among countries in the Western Pacific region, the prevalence of diabetes in Korea in- creased from 12.4% in 2011 to 14.4% in 2016 and was higher in men (15.8%) than in women (13.0%).2 This increase was attribut- ed to an aging population, westernized lifestyle, and other socio- economic factors.3
Complications due to diabetes are associated with increased medical costs and reduced life expectancy. Cardiovascular disease (CVD) is the leading cause of morbidity and mortality in subjects with diabetes, and the risk of developing CVD is almost double that in individuals with diabetes compared to those without.1 CVD is known to be associated with fasting plasma glucose (FPG); post- prandial plasma glucose (PPG) is also an important determinant of CVD burden.4-6 Pre-diabetes increases the risk of CVD and all-cause mortality, and the risk appears to be present in subjects with an FPG as low as 100 mg/dL and glycated hemoglobin (HbA1c) of 5.7%.7
International guidelines established by the American Diabetes Association and the European Association for the Study of Diabe- tes recommend a reduction in diabetes complications and CVD risk as the primary goal in the management of diabetes.8 In agree- ment with the international guidelines, the Korean Diabetes Asso- ciation also emphasizes the evaluation and prevention of CVD while managing diabetes.9 Cardiovascular (CV) risk should be as- sessed quantitatively to prevent and effectively manage CV compli- cations in subjects with diabetes. Various algorithms have been de- vised for CV risk assessment, but their suitability for assessing risk in subjects with diabetes is unclear.10-13 The Framingham risk score (FRS) is one of the most useful CV risk calculators used globally in clinical practice to identify and treat high-risk populations as well as to communicate risk effectively.14,15
In Korea, the prevalence of pre-diabetes and diabetes is increas- ing, but information on associated CV risk is limited. In view of
this, the OCARINA (a cross-sectional study to evaluate cardiovas- cular risk in prediabetic and diabetic patients) study was undertak- en to investigate the relationship between FRS and CV risk factors (myocardial infarction [MI], stroke, history of CV revasculariza- tion, history of angina, left ventricular hypertrophy [LVH], coro- nary artery stenosis > 50%, and carotid stenosis > 50%) in subjects with pre-diabetes and diabetes in Korea.
METHODS Study design
OCARINA was a pan-Korea, multicenter, non-interventional, cross-sectional study conducted in compliance with good epidemi- ologic practice.16 Physicians from 10 general hospitals in Korea, who managed and treated subjects with diabetes based on health system and expertise, participated in the study as investigators. The study period was from November 2013 to June 2014.
Study population
Subjects with pre-diabetes or diabetes aged ≥40 years who visited outpatient departments at the ten medical institutions during the participating physicians’ duty schedules were enrolled based on the availability of their case records. Type 2 diabetes mellitus (T2DM) was diagnosed based on plasma glucose (PG), FPG of ≥126 mg/dL or 2-hour PG of ≥ 200 mg/dL during a 75-g oral glucose tolerance test (OGTT), or HbA1c level ≥ 6.5%.17-19 Pre-diabetes was diag- nosed based on the presence of impaired fasting glucose (IFG) with FPG ranging from 100 to 125 mg/dL and/or impaired glucose tol- erance with a 2-hour PG of 140 to 199 mg/dL during a 75-g OGTT, and/or HbA1c of 5.7% to 6.4%.17-19 Subjects with documented total cholesterol (TC) and high-density lipoprotein cholesterol (HDL-C) values, systolic blood pressure (SBP), and smoking status within the previous 6 months were included in the study. Subjects that were receiving any investigational drug; those with a history of MI, stroke, or major surgery; or those with a reported use of systemic glucocorticoids for a week within the 3 months preceding enroll- ment were excluded from the study.
Data collection and verification
Data from medical records were entered in electronic case report
forms. Data included demographics, pharmacotherapy in the previ- ous 6 months, record of CV risk factors, FPG, PPG, HbA1c, TC, HDL-C, antihyperlipidemic therapy, SBP, diastolic blood pressure (DBP), antihypertensive therapy, and smoking status.
Study endpoints
The primary endpoint of the study was to determine the FRS.
Framingham equations for general CV risk were used to calculate the CV risk for the FRS using an online calculator (https://framing- hamheartstudy.org/fhs-risk-functions/cardiovascular-disease-10-year- risk/). Secondary endpoints included the percentage of subjects with high CV risk, the relationship between FRS and HbA1c level and insulin usage, and the relationship between high CV risk and HbA1c level and insulin usage.
High CV risk in subjects was defined as having at least one of the following underlying CV risk factors: MI, history of stroke, prior revascularization, history of angina, urine albumin creatinine ratio (UACR) > 30 µg/mg, history of LVH, or stenosis of the coronary arteries.
Statistical analysis
Data collected from subjects were analyzed using descriptive sta- tistics. Qualitative data were summarized as frequencies and percent- ages, while quantitative data were summarized using descriptive statistics (mean, standard deviation [SD], median, and range). Mul- tiple linear regression was performed to investigate the relationship between FRS and CV risk factors, as well as FRS according to HbA1c level and insulin use. The association between presence of CV risk factors and HbA1c level and insulin usage was assessed by multiple logistic regression analysis. SAS versions 9.2 or higher (SAS Institute Inc., Cary, NC, USA) were used to perform all analyses.
Ethical considerations
This non-interventional, retrospective study protocol was approved by local ethics review committees with informed consent form ex- emption. Institutional review board approval numbers from the 10 hospitals that participated in this study are as follows: Konkuk Uni- versity Medical Center (KUH1010518), Gangdong Kyung Hee Uni- versity Hospital (2013-0077), Ulsan University Hospital (2013096), Chonbuk National University Hospital (CUH 2013-10-021), Seoul
National University Bundang Hospital (B-1310/222-112), Daegu Catholic University Hospital (CR-13-085-L), The Catholic Univer- sity of Korea, Yeouido St. Mary’s Hospital (XC13RSMI0125S), The Catholic University of Korea, St. Vincent’s Hospital (XC13RSMI0125V), Hallym University Kangnam Sacred Heart Hospital (2013-11-91), and Hanyang University Hospital (HYUH 2013-11-015).
RESULTS
Population demographics and clinical characteristics
Out of 1,540 subjects screened, data from 1,537 subjects were included in the analysis; one subject was excluded because his/her medical record did not confirm dysglycemia at enrollment, and two other subjects were excluded as baseline data (TC, HDL-C, SBP, and smoking status) within 6 months before enrollment were missing.
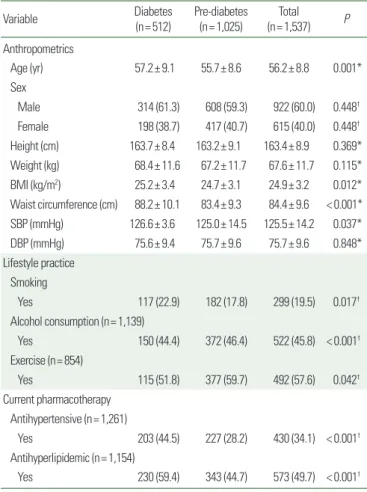
About one-third (33%, 512/1,537) of analyzed subjects had dia- betes, while the remainder (n= 1,025) had pre-diabetes. More than half (60.0%, 922/1,537) of the subjects were men; the mean± SD age and body mass index of the study subjects was 56.2± 8.8 years and 24.9± 3.2 kg/m2, respectively. The Mean± SD of SBP and DBP were 125.5±14.2 mmHg and 75.7±9.6 mmHg, respectively.
About one-fifth (19.5%, 299/1,537) of subjects were active smokers.
Fewer than half (45.8%, 522/1,139) of subjects were alcohol con- sumers. The proportion of subjects who received antihypertensive and antihyperlipidemic therapy was 34.1% (430/1,261) and 49.7%
(573/1,154), respectively (Table 1).
FRS in subjects with diabetes and pre-diabetes
In subjects whose records had all the data required for calculation of FRS (n= 1,261), the mean± SD FRS was 13.72± 8.77 (Fig. 1).
Through assumption of either “yes” or “no” when data for the pa- rameter “treatment with antihypertensive drugs” was unavailable, the FRS score was 13.88±8.71 and 13.30±8.66, respectively (Sup- plementary Table 1).
Subjects with diabetes had a higher FRS (18.99±8.79) than those with pre-diabetes (10.74± 7.23) (P<0.001) (Fig. 1). FRS in men with pre-diabetes was comparable to that in women with diabetes (13.80± 7.37 and 13.35± 7.13, respectively) (Fig. 2).
Subjects with high CV risk and associated FRS
Among 132 subjects whose high-risk status could be ascertained, 81 (61.4%; 95% confidence interval [CI], 53.06–69.67) presented with at least one risk factor (thus falling in the high CV risk category).
The most prevalent CV risk factor was angina, reported in 28 sub- jects (2.72%), followed by stroke (n= 17, 1.66%), ankle-brachial index < 0.9 (n= 15, 7.77%), UACR > 30 µg/mg (n= 10, 3.46%), LVH (n=9, 1.02%), MI (n=6, 0.58%), prior revascularization (n=6, 0.60%), and ≥ 50% stenosis of coronary arteries (n= 2, 0.22%). No subject had ≥50% stenosis of the lower extremity or carotid arteries.
In subjects with high CV risk (presence of ≥ 1 CV risk factors), the mean± SD of FRS was 17.86± 8.86; in comparison, the FRS in those without any coexistent CV risk factor was 14.58± 8.54 (P=
0.048). FRS was higher in subjects with stroke (∆=4.49, P=0.032), angina (∆=6.58, P=0.000), LVH (∆=9.21, P=0.003), alcohol consumption (∆= 3.66, P<0.001), higher BMI (∆=0.3 [under- weight vs. normal], ∆= 2.14 [pre-obesity vs. normal], and ∆=3.14 [obesity vs. normal]; P<0.001), and higher HbA1c (∆=3.48 [tertile 2 vs. 1], ∆= 6.83 [tertile 3 vs. 1]; P<0.001) than in those without these coexisting risk factors. FRS was substantially elevated in pa- tients with angina (∆= 4.57; P=0.019) and those who consumed alcohol (∆= 3.96, P= 0.000) among subjects with diabetes and in those with stroke (∆= 5.1, P=0.031), LVH (∆=11.76, P=0.005), alcohol consumption (∆=3.62, P<0.001), higher BMI (∆=−4.19 [underweight vs. normal], ∆= 1.74 [pre-obesity vs. normal], and
∆= 2.06 [obesity vs. normal]; P=0.000), and higher HbA1c (∆=
Table 1. Demographics of the study subjects
Variable Diabetes
(n= 512) Pre-diabetes
(n= 1,025) Total (n= 1,537) P Anthropometrics
Age (yr) 57.2± 9.1 55.7± 8.6 56.2± 8.8 0.001*
Sex
Male 314 (61.3) 608 (59.3) 922 (60.0) 0.448†
Female 198 (38.7) 417 (40.7) 615 (40.0) 0.448†
Height (cm) 163.7± 8.4 163.2± 9.1 163.4± 8.9 0.369*
Weight (kg) 68.4± 11.6 67.2± 11.7 67.6± 11.7 0.115*
BMI (kg/m2) 25.2± 3.4 24.7± 3.1 24.9± 3.2 0.012*
Waist circumference (cm) 88.2± 10.1 83.4± 9.3 84.4± 9.6 < 0.001*
SBP (mmHg) 126.6± 3.6 125.0± 14.5 125.5± 14.2 0.037*
DBP (mmHg) 75.6± 9.4 75.7± 9.6 75.7± 9.6 0.848*
Lifestyle practice Smoking
Yes 117 (22.9) 182 (17.8) 299 (19.5) 0.017†
Alcohol consumption (n= 1,139)
Yes 150 (44.4) 372 (46.4) 522 (45.8) < 0.001† Exercise (n= 854)
Yes 115 (51.8) 377 (59.7) 492 (57.6) 0.042†
Current pharmacotherapy Antihypertensive (n= 1,261)
Yes 203 (44.5) 227 (28.2) 430 (34.1) < 0.001† Antihyperlipidemic (n= 1,154)
Yes 230 (59.4) 343 (44.7) 573 (49.7) < 0.001† Values are presented as mean± standard deviation or number (%). Denominator of the percentage is the number of subjects. Subjects with unknown information were not in- cluded: height: 563 subjects, weight: 375 subjects, alcohol consumption: 398 subjects, exercise status: 683 subjects, treatment with antihypertensive drugs: 276 subjects, and treatment with antihyperlipidemic drugs: 341 subjects (missing data in 42 subjects).
*t-test; †Chi-square test.
BMI, body mass index; SBP, systolic blood pressure; DBP, diastolic blood pressure.
Figure 2. Comparison of Framingham risk score within pre-diabetes and diabetes populations by sex. Values are presented as mean± standard deviation. Sex com- parisons within pre-diabetes and diabetes population by analysis of variance. Mul- tiple comparisons by Duncan’s test. Male diabetes> male pre-diabetes= female diabetes> female pre-diabetes (P< 0.001).
35 30 25 20 15 10 5 0
Framingham risk score
22.61± 7.80
13.80± 7.37 13.35± 7.13
6.62± 4.47
Diabetes Pre-diabetes Diabetes Pre-diabetes Male Female Figure 1. Comparison of Framingham risk score between diabetes and pre-diabe- tes.Values are presented as mean± standard deviation. Framingham risk score comparison between diabetes vs. pre-diabetes by t-test.
30 25 20 15 10 5 0
Framingham risk score
Diabetes Pre-diabetes Total
18.99± 8.79
10.74± 7.23
13.72± 8.77 P< 0.001
1.00 [tertile 2 vs. 1] and ∆= 2.24 [tertile 3 vs. 1]; P=0.010) among subjects with pre-diabetes in comparison to those without these coexisting CV risk factors (Supplementary Table 2).
Multivariate analysis that included factors with statistical signifi- cance (P<0.005) in the univariate analysis was performed to iden-
tify significant CV risk factors (Table 2). FRS was elevated in dia- betic subjects (n= 199) who consumed alcohol (2.66, P=0.033) and fell in the obesity-class II category (6.10, P=0.015) while it was elevated in pre-diabetic subjects (n= 306) with LVH (11.10, P=0.005), alcohol consumption (3.06, P<0.001), pre-obesity (3.21, P=0.002), and obesity-class I (2.89, P=0.002) in compari- son to subjects without these coexisting risk factors (Table 2).
HbA1c, insulin usage, and association with FRS and CV risk
Overall, the mean± SD HbA1c was 6.34%± 1.03% (n= 1,154);
HbA1c was 8.29%± 2.06% in insulin users (n= 18) and 6.30%±
0.98% in non-insulin users (n= 1,136), and a significant increase in FRS was noted with an increase in HbA1c (2.41, P<0.001). Fur- ther, with each 0.5% to 1% increase in HbA1c from 5% to 7%, there was a directly proportional but statistically insignificant increase in the FRS (Table 3). HbA1c ≥ 7% was associated with a higher CV risk than an HbA1c < 7% (odds ratio, 3.43; P=0.026). Insulin us- age, however, did not have a statistically significant association with the FRS. An increase in BMI tended to be associated with an increase in FRS. In particular, a J-shaped curve was observed in men with di- abetes as the FRS was high for those men with a BMI <18.5 kg/m2 (Fig. 3).
DISCUSSION
In this study, about 33% of subjects had diabetes, while the re- maining subjects had pre-diabetes. Evaluation of CV risk using the Table 2. Effect of cardiovascular risk factors on the Framingham risk score
Variable Parameter estimate (SE) P *
Overall (n= 469)†
Stroke presence (vs. none) 3.28 (3.11) 0.291
Angina presence (vs. none) 1.65 (3.10) 0.594
LVH presence (vs. none) 10.75 (3.34) 0.001
Alcohol consumption presence (vs. none) 3.22 (0.75) < 0.001 HbA1c tertile 2 (vs. tertile 1) 3.31 (0.93) < 0.001 HbA1c tertile 3 (vs. tertile 1) 7.22 (0.88) < 0.001 BMI underweight (vs. normal weight) 9.02 (4.05) 0.026 BMI pre-obesity (vs. normal weight) 2.92 (1.04) 0.005 BMI obesity-class I (vs. normal weight) 3.21 (0.90) < 0.001 BMI obesity-class II (vs. normal weight) 4.00 (1.80) 0.027 BMI obesity-class III (vs. normal weight) 1.28 (4.05) 0.751 Diabetes (n= 199)†
Angina presence (vs. none) 4.98 (2.96) 0.094
Alcohol consumption presence (vs. none) 2.66 (1.24) 0.033 BMI underweight (vs. normal weight) 3.49 (4.49) 0.437 BMI pre-obesity (vs. normal weight) 1.93 (1.80) 0.285 BMI obesity-class I (vs. normal weight) 2.70 (1.56) 0.085 BMI obesity-class II (vs. normal weight) 6.10 (2.49) 0.015 BMI obesity-class III (vs. normal weight) 0.91 (5.12) 0.859 Pre-diabetes (n= 306)†
Stroke presence (vs. none) 4.40 (2.82) 0.119
LVH presence (vs. none) 11.10 (3.94) 0.005
Alcohol consumption presence (vs. none) 3.06 (0.78) < 0.001
HbA1c tertile 2 (vs. tertile 1) 1.02 (0.90) 0.257
HbA1c tertile 3 (vs. tertile 1) 1.86 (0.96) 0.054
BMI underweight (vs. normal weight) NA NA
BMI pre-obesity (vs. normal weight) 3.21 (1.05) 0.002 BMI obesity-class I (vs. normal weight) 2.89 (0.90) 0.002 BMI obesity-class II (vs. normal weight) –0.11 (2.11) 0.958 BMI obesity-class III (vs. normal weight) 3.65 (4.71) 0.439 HbA1c was subdivided into tertiles: HbA1c ≤ 5.9% (tertile 1), > 5.9% to ≤ 6.3% (tertile 2), and > 6.3% (tertile 3) for the overall population, HbA1c ≤ 6.4% (tertile 1), > 6.4% to
≤ 7.0% (tertile 2), and > 7.0% (tertile 3) for the diabetes population; and HbA1c ≤ 5.7%
(tertile 1), > 5.7% to ≤ 6.0% (tertile 2), and > 6.0% (tertile 3) for the pre-diabetes popu- lation; Underweight: BMI < 18.5 kg/m2, normal weight: BMI 18.5–22.9 kg/m2, pre-obe- sity: BMI 23.0–24.9 kg/m2, obesity-class I: BMI 25.0–29.9 kg/m2, obesity-class II: BMI 30.0–34.9 kg/m2, and obesity-class III: BMI≥ 35 kg/m2.
*Multivariable analysis of the relationship between risk factors and the Framingham risk score (multiple linear regression); †Number of observations with missing values:
overall, 1,068; diabetes, 313; and pre-diabetes, 719.
SE, standard error; LVH, left ventricular hypertrophy; HbA1c, glycated hemoglobin; BMI, body mass index; NA, not applicable.
Table 3. Framingham risk score according to HbA1c
Variable n* Parameter
estimate Standard
error P
Total 980
Overall HbA1c† 2.41 0.26 < 0.001
HbA1c (%)‡
≥ 5 to < 6 367 1.47 5.96 0.806
≥ 6 to < 6.5 322 5.03 5.96 0.398
≥ 6.5 to < 7 125 7.07 5.99 0.238
≥ 7 164 10.14 5.98 0.090
*The number of subjects included in the analysis; †Analysis for the relationship be- tween HbA1c and FRS (linear regression analysis); ‡Analysis for the relationship be- tween HbA1c classification and FRS (linear regression analysis).
HbA1c, glycated hemoglobin; FRS, Framingham risk score.
FRS indicated that CV risk was significantly higher in subjects with diabetes than in those with pre-diabetes. When stratified by sex, men were at a higher CV risk than women, and men with pre-dia- betes had a similar CV risk to that of women with diabetes. In addi- tion, alcohol consumption and obesity were the most significant predictors of CV risk in Koreans with diabetes, while LVH, pre- obesity, and obesity were the most significant predictors of CV risk in Koreans with pre-diabetes.
The FRS estimation used in this study has been traditionally used to predict the 10-year risk of coronary heart disease (CHD) by fac- toring in age, smoking status, lipid profile, blood pressure, and pres- ence or absence of diabetes.20,21 A survey based on data obtained from the third Korea National Health and Nutrition Examination in 2005 of 5,271 non-institutionalized civilians (aged 20–79 years) in the Republic of Korea revealed that the FRS was closely associ- ated with prediction of CHD.22 In the current study, the mean FRS of 13.72 in subjects with pre-diabetes and diabetes indicates inter- mediate risk of developing CVD including stroke, peripheral artery disease, heart failure, and ischemic heart disease within 10 years. In a 10-year follow-up study of 2,775 subjects at high risk of diabetes, the mean Framingham 10-year CV risk scores were the highest in subjects with pre-diabetes (16.2%), intermediate in subjects with normal glucose regulation (15.5%), and the lowest in subjects with diabetes (14.4%) (P<0.05 for all pairwise comparisons).23 In con- trast, the present study established that the FRS was higher in sub-
jects with diabetes than in those with pre-diabetes.
Various studies have been conducted to assess the impact of sex on diabetes-associated CV risk.24-26 In a cohort of 1,378 subjects se- lected from the Maracaibo City Metabolic Syndrome Prevalence Study, significantly higher coronary risk was observed in men with normoglycemia (3.28%) than women with normoglycemia (2.05%) (P<0.001) and in men with IFG (4.90%) than women with IFG (2.75%) (P<0.001). Although the overall risk was greater in sub- jects with diabetes than in subjects with normoglycemia or IFG, no sex differences were evident.24 A meta analysis of 37 prospective cohort studies of T2DM and fatal CHD among 447,064 subjects revealed that the relative risk for fatal CHD associated with diabe- tes was 50% greater in women than in men.26 However, in the pres- ent study, the FRS in men was higher than that in women in both pre-diabetes and diabetes groups, indicating a clear sex difference.
Men with pre-diabetes had a CV risk similar to women with diabe- tes. This finding highlights the need to create awareness that men with pre-diabetes are at greater risk of developing CV complica- tions than women with pre-diabetes.
CV risk factors including obesity, hypertension, and dyslipidemia are common among subjects with diabetes, increasing the risk for CV events. It is therefore important to target CV risk factors in sub- jects with diabetes to minimize long-term CV complications asso- ciated with diabetes.27 We found that the mean FRS was notably higher in subjects with high CV risk than in subjects without high Figure 3. Comparison of Framingham risk score according to body mass index (BMI). Values are presented as mean± standard deviation.
35 30 25 20 15 10 5 0
Framingham risk score
21.23± 9.54
19.84± 9.1123.04± 7.89 24.04± 6.97
24.72± 7.19
4.70± 0 12.96± 7.29
13.79± 7.69 13.67± 7.12
16.39± 8.42
13.10± 7.70 13.75± 6.54
12.09± 6.30 13.88± 8.03
4.74± 3.09 5.72± 3.83
6.60± 4.80 7.27± 4.56
5.86± 3.00
Diabetes Pre-diabetes
≥18.5–
<23
≥23–<25
≥25–<30 ≥30
<18.5
BMI (kg/m2)
≥18.5–
<23
≥23–<25
≥25–<30 ≥30
<18.5
BMI (kg/m2)
≥18.5–
<23
≥23–<25
≥25–<30 ≥30
<18.5
BMI (kg/m2)
≥18.5–
<23
≥23–<25
≥25–<30 ≥30
<18.5
BMI (kg/m2)
Diabetes Pre-diabetes
Male Female
CV risk (P=0.048) and confirmed that alcohol consumption (in- creased FRS by 2.66; standard error, 1.24; P=0.033) and obesity- class II28 (increased FRS by 6.10; standard error, 2.49; P=0.015) were significant contributors to CV risk in subjects with diabetes in Korea. In a study conducted in Taiwan that included 439 subjects with chronic kidney disease, presence of diabetes, coronary artery disease, low albumin, low hemoglobin, low estimated glomerular filtration rate, high uric acid, proteinuria, left atrial diameter >4.7 cm, LVH, and left ventricular ejection fraction < 50% were all signifi- cantly associated with an increase in CV events.29 We found that LVH (P=0.005), alcohol consumption (P=0.000), pre-obesity (P=0.002), and obesity-class I (P=0.002) were significantly asso- ciated with increased FRS in subjects with pre-diabetes in Korea.
In contrast, various studies have shown that moderate alcohol con- sumption is associated with a reduced risk of incident diabetes.30,31 Obesity is a well-established risk factor for developing CV disease32 consistent with our findings in this study; both obesity and pre-obe- sity were significant contributors to increased CV risk in subjects with pre-diabetes or diabetes.
Association between HbA1c and CV risk and mortality has been extensively investigated.27 A systematic review (74 studies) and meta-analysis (46 studies) conducted by Cavero-Redondo et al.33 that included observational studies established that HbA1c had a positive association with all-cause mortality and CV mortality in both subjects with diabetes and those without diabetes. A study of 34,737 subjects with T2DM reported increased microvascular and macrovascular events in subjects with diabetes and HbA1c levels
≥ 6.5% as compared to subjects with HbA1c < 6.5% for the 0- to 1-year early exposure period.34 A retrospective study of 2,879 Kore- an adults aged 40 to 79 years without diabetes revealed that HbA1c levels were positively correlated with the FRS and may reflect CVD risk in subjects without diabetes.35 In the present study, we demon- strated that an increase in HbA1c was associated with an increase in the FRS, indicating a higher probability of CV complications in subjects with uncontrolled diabetes. In subjects with high CV risk, the FRS was higher when HbA1c was ≥7%, alcohol was consumed, and LVH was present. HbA1c ≥ 7% was associated with higher CV risk as compared to HbA1c <7%, emphasizing the need for HbA1c control to prevent CV complications in subjects with pre-diabetes and diabetes in Korea.
Several meta-analyses of randomized controlled trials investigat- ing the effects of intensive glycemic control on all-cause mortality, CV death, and vascular events in T2DM have shown limited bene- fits of therapy and no significant effects on CV outcomes.36-39 In this study, insulin usage did not significantly affect the FRS or high CV risk. However, the association between HbA1c and insulin us- age and their cumulative effects on the FRS need to be further sub- stantiated through future studies to assess the impact of insulin us- age on the FRS and high CV risk.
BMI has been reported to be a strong predictor of future risk of CHD.40 Positive, inverse, or U- and J-shaped associations between BMI and mortality among subjects with diabetes have been report- ed in different studies.41-44 Association between BMI and CHD risk among 30,434 low-income and underinsured subjects with diabe- tes in the United States was positive among both men and women with T2DM at baseline and during the more than 7 years of follow- up.45 The current study confirmed that CV risk increases with in- creasing BMI in subjects with diabetes, highlighting the impor- tance of monitoring BMI to prevent CHD among subjects with di- abetes.
Limitations of the study
This study assessed CV risk in subjects with pre-diabetes and di- abetes based on their medical records, which is a limitation of this study, as the data may not be reliable if the required information was not noted correctly in the medical records. The period of the study over which the data were collected, i.e., 7 months may not be a representative of long-term trends. Because subjects with normal glucose levels were not included, the CV risk in subjects with pre- diabetes and diabetes could not be compared to that of non-diabet- ic subjects. Factors required for calculation of FRS included status of treatment with antihypertensive drugs. However, because anti- hypertensive treatment status was not available in 276 subjects, the FRS could not be calculated for these cases. However, an imputa- tion method was used to account for subjects for whom antihyper- tensive treatment status was not available, and the mean± SD FRS calculated using for this dataset was similar to that of the group for which data were available. Furthermore, data on the use of antihy- perlipidemic drugs were missing for 341 subjects and may have im- pacted the FRS results. Some of the missing data, such as that on
alcohol consumption, could also have impacted the results. In addi- tion, to determine high CV risk, previous MI, stroke, revasculariza- tion, and angina were assessed. Due to difficulty in elucidating the time sequences of these events in this cross-sectional study, we could not confidently assess correlations between the effects of current insulin use/status of HbA1c control and high CV risk. Fur- thermore, very few subjects were on insulin therapy. Family history of premature CV events is an important determinant of CV risk.46 However, data on the family history of premature CV events were not collected in this study; further studies are needed to determine if family history of premature CV events affects CV risk. Finally, some researchers have suggested that the FRS may not be suitable for some populations, including Koreans.47 Therefore, the results of this study should be verified using other CV risk scoring models. In conclusion, based on the overall distribution and characteristics of CV risk, Korean subjects with pre-diabetes and diabetes are at high risk for developing CVD, and subjects with diabetes have a signifi- cantly higher predisposition for developing CVD than those with pre-diabetes. Risk stratification based on sex, BMI, and underlying comorbidities can be used to develop measures to prevent and manage CV complications in Korean subjects with impaired glu- cose metabolism.
CONFLICTS OF INTEREST
Won Kim and Kyoung Hwa Lee are employees of Sanofi. No other potential conflicts of interest relevant to this article were re- ported.
ACKNOWLEDGMENTS
This study was funded by Sanofi-Aventis Korea, Ltd. Editorial support in the preparation of this publication was provided by AP- CER Life Sciences and was paid for by Sanofi, India. Editorial sup- port was also provided by Anahita Gouri and Rohan Mitra of Sanofi, India. The authors individually and collectively are responsible for all content and editorial decisions and have received no payment from Sanofi, directly or indirectly (through a third party), for the development/presentation of this publication.
AUTHOR CONTRIBUTIONS
Study concept and design: HSK, KHS, ISN, and TSP; acquisition of data: HSK, KHS, ISN, TSP, JMY, DSK, HSS, KJA, SHC, and SHK; analysis or interpretation of data: HSK, WK, and KHL; draft- ing of the manuscript: HSK, KHS, and WK; critical revision of the manuscript: HSK and WK; and study supervision: ISN and TSP.
REFERENCES
1. International Diabetes Federation. IDF diabetes atlas 9th edi- tion [Internet]. Brussels: International Diabetes Federation;
2020 [cited 2021 Jul 30]. Available from: https://www.diabe- tesatlas.org/en/resources/
2. Korean Diabetes Association. Diabetes fact sheet in Korea:
2018 [Internet]. Seoul: Korean Diabetes Association; 2020 [cited 2021 Jul 30]. Available from: http://www.diabetes.or.
kr/bbs/index.html?code=e_resource&mode=tlist
3. Kolb H, Martin S. Environmental/lifestyle factors in the patho- genesis and prevention of type 2 diabetes. BMC Med 2017;
15:131.
4. Lawes CM, Parag V, Bennett DA, Suh I, Lam TH, Whitlock G, et al. Blood glucose and risk of cardiovascular disease in the Asia Pacific region. Diabetes Care 2004;27:2836-42.
5. DECODE Study Group; the European Diabetes Epidemiolo- gy Group. Glucose tolerance and cardiovascular mortality:
comparison of fasting and 2-hour diagnostic criteria. Arch In- tern Med 2001;161:397-405.
6. Balkau B, Shipley M, Jarrett RJ, Pyörälä K, Pyörälä M, Forhan A, et al. High blood glucose concentration is a risk factor for mortality in middle-aged nondiabetic men: 20-year follow-up in the Whitehall study, the Paris prospective study, and the Helsinki policemen study. Diabetes Care 1998;21:360-7.
7. Huang Y, Cai X, Mai W, Li M, Hu Y. Association between prediabetes and risk of cardiovascular disease and all cause mortality: systematic review and meta-analysis. BMJ 2016;
355:i5953.
8. Davies MJ, D’Alessio DA, Fradkin J, Kernan WN, Mathieu C, Mingrone G, et al. Management of hyperglycemia in type 2 diabetes, 2018: a consensus report by the American Diabetes
Association (ADA) and the European Association for the Study of Diabetes (EASD). Diabetes Care 2018;41:2669-701.
9. Korean Diabetes Association. Treatment guidelines for diabe- tes. 5th ed. [Internet]. Seoul: Korean Diabetes Association;
2015 [cited 2021 Jul 30]. Available from: http://www.diabe- tes.or.kr/bbs/index.html?code=e_resource&mode=tlist 10. Kariuki JK, Stuart-Shor EM, Leveille SG, Hayman LL. Evalu-
ation of the performance of existing non-laboratory based cardiovascular risk assessment algorithms. BMC Cardiovasc Disord 2013;13:123.
11. Chamnan P, Simmons RK, Sharp SJ, Griffin SJ, Wareham NJ.
Cardiovascular risk assessment scores for people with diabe- tes: a systematic review. Diabetologia 2009;52:2001-14.
12. Stevens RJ, Coleman RL, Holman RR. Framingham risk equa- tions underestimate coronary heart disease risk in diabetes.
Diabet Med 2005;22:228.
13. Yeo WW, Yeo KR. Predicting CHD risk in patients with dia- betes mellitus. Diabet Med 2001;18:341-4.
14. Garg N, Muduli SK, Kapoor A, Tewari S, Kumar S, Khanna R, et al. Comparison of different cardiovascular risk score calcu- lators for cardiovascular risk prediction and guideline recom- mended statin uses. Indian Heart J 2017;69:458-63.
15. Eichler K, Puhan MA, Steurer J, Bachmann LM. Prediction of first coronary events with the Framingham score: a system- atic review. Am Heart J 2007;153:722-31, e1-8.
16. Andrews EA, Avorn J, Bortnichak EA, Chen R, Dai WS, Di- eck GS, et al. Guidelines for good epidemiology practices for drug, device, and vaccine research in the United States. Phar- macoepidemiol Drug Saf 1996;5:333-8.
17. American Diabetes Association. 10. Cardiovascular disease and risk management: standards of medical care in diabetes- 2019. Diabetes Care 2019;42(Suppl 1):S103-23.
18. Kim MK, Ko SH, Kim BY, Kang ES, Noh J, Kim SK, et al.
2019 Clinical practice guidelines for type 2 diabetes mellitus in Korea. Diabetes Metab J 2019;43:398-406.
19. American Diabetes Association. Standards of medical care in diabetes: 2013. Diabetes Care 2013;36 Suppl 1(Suppl 1):
S11-66.
20. Grundy SM, Balady GJ, Criqui MH, Fletcher G, Greenland P, Hiratzka LF, et al. Primary prevention of coronary heart dis-
ease: guidance from Framingham: a statement for healthcare professionals from the AHA Task Force on Risk Reduction.
American Heart Association. Circulation 1998;97:1876-87.
21. Khanna R, Kapoor A, Kumar S, Tewari S, Garg N, Goel PK.
Metabolic syndrome & Framingham risk score: observations from a coronary angiographic study in Indian patients. Indian J Med Res 2013;137:295-301.
22. Kang HM, Kim DJ. Metabolic Syndrome versus Framingham Risk Score for Association of Self-Reported Coronary Heart Disease: The 2005 Korean Health and Nutrition Examination Survey. Diabetes Metab J 2012;36:237-44.
23. Perreault L, Temprosa M, Mather KJ, Horton E, Kitabchi A, Larkin M, et al. Regression from prediabetes to normal glu- cose regulation is associated with reduction in cardiovascular risk: results from the Diabetes Prevention Program outcomes study. Diabetes Care 2014;37:2622-31.
24. Bermúdez V, Rojas J, Salazar J, Gonzalez R, Martinez MS, Chavez C, et al. Coronary risk estimation according to the Framingham-Wilson score and impaired fasting glucose in adult subjects from Maracaibo city, Venezuela. Glob J Obes Diabetes Metab Syndr 2014;1:20-9.
25. Ford ES, Zhao G, Li C. Pre-diabetes and the risk for cardio- vascular disease: a systematic review of the evidence. J Am Coll Cardiol 2010;55:1310-7.
26. Huxley R, Barzi F, Woodward M. Excess risk of fatal coronary heart disease associated with diabetes in men and women:
meta-analysis of 37 prospective cohort studies. BMJ 2006;
332:73-8.
27. Leon BM, Maddox TM. Diabetes and cardiovascular disease:
epidemiology, biological mechanisms, treatment recommen- dations and future research. World J Diabetes 2015;6:1246-58.
28. Seo MH, Lee WY, Kim SS, Kang JH, Kang JH, Kim KK, et al.
2018 Korean Society for the Study of Obesity guideline for the management of obesity in Korea. J Obes Metab Syndr 2019;28:40-5.
29. Chen SC, Su HM, Tsai YC, Huang JC, Chang JM, Hwang SJ, et al. Framingham risk score with cardiovascular events in chronic kidney disease. PLoS One 2013;8:e60008.
30. Polsky S, Akturk HK. Alcohol consumption, diabetes risk, and cardiovascular disease within diabetes. Curr Diab Rep
2017;17:136.
31. Crandall JP, Polsky S, Howard AA, Perreault L, Bray GA, Barrett-Connor E, et al. Alcohol consumption and diabetes risk in the Diabetes Prevention Program. Am J Clin Nutr 2009;90:595-601.
32. Yoo B, Nam H, Hwang IC, Park Y. Correlation of cardiovas- cular risk factors with central obesity and multiple body mass index in Korea. Korean J Fam Med 2017;38:338-45.
33. Cavero-Redondo I, Peleteiro B, Álvarez-Bueno C, Rodriguez- Artalejo F, Martínez-Vizcaíno V. Glycated haemoglobin A1c as a risk factor of cardiovascular outcomes and all-cause mor- tality in diabetic and non-diabetic populations: a systematic review and meta-analysis. BMJ Open 2017;7:e015949.
34. Laiteerapong N, Ham SA, Gao Y, Moffet HH, Liu JY, Huang ES, et al. The legacy effect in type 2 diabetes: impact of early glycemic control on future complications (the diabetes & ag- ing study). Diabetes Care 2019;42:416-26.
35. Shin JH, Kang JI, Jung Y, Choi YM, Park HJ, So JH, et al.
Hemoglobin A1c is positively correlated with Framingham risk score in older, apparently healthy nondiabetic Korean adults. Endocrinol Metab (Seoul) 2013;28:103-9.
36. Boussageon R, Bejan-Angoulvant T, Saadatian-Elahi M, La- font S, Bergeonneau C, Kassaï B, et al. Effect of intensive glu- cose lowering treatment on all cause mortality, cardiovascular death, and microvascular events in type 2 diabetes: meta-anal- ysis of randomised controlled trials. BMJ 2011;343:d4169.
37. Ray KK, Seshasai SR, Wijesuriya S, Sivakumaran R, Nether- cott S, Preiss D, et al. Effect of intensive control of glucose on cardiovascular outcomes and death in patients with diabetes mellitus: a meta-analysis of randomised controlled trials. Lan- cet 2009;373:1765-72.
38. Control Group, Turnbull FM, Abraira C, Anderson RJ, By- ington RP, Chalmers JP, et al. Intensive glucose control and macrovascular outcomes in type 2 diabetes. Diabetologia 2009;52:2288-98.
39. Hemmingsen B, Lund SS, Gluud C, Vaag A, Almdal T, Hem-
mingsen C, et al. Intensive glycaemic control for patients with type 2 diabetes: systematic review with meta-analysis and trial sequential analysis of randomised clinical trials. BMJ 2011;
343:d6898.
40. Flint AJ, Rexrode KM, Hu FB, Glynn RJ, Caspard H, Manson JE, et al. Body mass index, waist circumference, and risk of coronary heart disease: a prospective study among men and women. Obes Res Clin Pract 2010;4:e171-81.
41. Bhaskaran K, Dos-Santos-Silva I, Leon DA, Douglas IJ, Smeeth L. Association of BMI with overall and cause-specific mortal- ity: a population-based cohort study of 3·6 million adults in the UK. Lancet Diabetes Endocrinol 2018;6:944-53.
42. Kokkinos P, Myers J, Faselis C, Doumas M, Kheirbek R, Nyl- en E. BMI-mortality paradox and fitness in African American and Caucasian men with type 2 diabetes. Diabetes Care 2012;
35:1021-7.
43. Chen Y, Copeland WK, Vedanthan R, Grant E, Lee JE, Gu D, et al. Association between body mass index and cardiovascu- lar disease mortality in east Asians and south Asians: pooled analysis of prospective data from the Asia Cohort Consortium.
BMJ 2013;347:f5446.
44. Tobias DK, Pan A, Jackson CL, O’Reilly EJ, Ding EL, Willett WC, et al. Body-mass index and mortality among adults with incident type 2 diabetes. N Engl J Med 2014;370:233-44.
45. Li N, Katzmarzyk PT, Horswell R, Zhang Y, Li W, Zhao W, et al. BMI and coronary heart disease risk among low-income and underinsured diabetic patients. Diabetes Care 2014;37:
3204-12.
46. Mulders TA, Meyer Z, van der Donk C, Kroon AA, Ferreira I, Stehouwer CD, et al. Patients with premature cardiovascular disease and a positive family history for cardiovascular disease are prone to recurrent events. Int J Cardiol 2011;153:64-7.
47. Jee SH, Jang Y, Oh DJ, Oh BH, Lee SH, Park SW, et al. A coronary heart disease prediction model: the Korean Heart Study. BMJ Open 2014;4:e005025.