167
Korean College of Clinical Pharmacy Available online at http://www.kccp.or.kr pISSN: 1226-6051
신생아 중환자실 영양요법치료에서 약사의 역할과 영향
오윤경1,2·이광섭2·이정연1*
1이화여자대학교 약학대학, 2건국대학교병원 약제부
(2013년 3월 14일 접수·2013년 6월 10일 수정·2013년 6월 11일 승인)
Neonatal Total Nutritional Pharmacy Service at Intensive Care Unit at a University Hospital in Korea
Yun Kyoung Oh
1,2, Gwang Sup Lee
2, and Sandy Rhie
1*1College of Pharmacy, Ewha Womans University,
2Division of Pharmacy, Konkuk University Medical Center, Seoul, Korea (Received March 14, 2013·Revised June 10, 2013·Accepted June 11, 2013)
Objective: The study evaluated the impact of pharmacist inventions with the implementation of pharmacist- involved nutritional support service at neonate intensive care unit in a tertiary teaching hospital. Method: A ret- rospective and observational study was carried out. The total of 58 infants in neonate intensive care unit was enrolled between January 2011 and October 2012. The pharmacist-involved total parenteral nutritional program was initiated in June of 2012. During the program, pharmacist actively participated in the multidisciplinary round with performing the interventions from reviewing the amount of combined total parenteral nutrition and enteral fluid intakes, the amount of total calories, the glucose infusion rate, and the amounts of proteins per weight in kilogram. The outcome was compared with the results from the control group which reflected the prior period of the program initiation. Result: The number of days of regaining birth weight was significantly shorter (14.5 vs. 19 days, p=0.049) and the percentage of total calorie days with >90 kcal/kg/day was increased significantly (40 vs. 13%, p=0.008) in intervention group compared to the values in control group. In addition, the total mean daily caloric intakes (84.78±13.8 vs. 74.86±15.36 kcal/kg/day, p=0.018) was significantly higher in interven- tion group than those results in control group. There were no significant differences in safety parameters between two groups related to nutritional services of necrotizing enterocolitis, intraventricular hemorrhage, proven sepsis, and also parenteral nutrition-induced hepatotoxicity. Conclusion: Pharmacist-involved total parenteral nutri- tion managed program was successfully implemented. The outcome showed the improved effectiveness of total parenteral nutrition with pharmacist interventions and no differences in adverse reactions. This could prove the positive effects of pharmacist involvement on nutritional therapy for neonate population.
□ Key words - neonate intensive care unit, pharmacist intervention, parenteral nutritional service, enteral nutrition.
INTRODUCTION
As postnatal growth is a major concern for premature or sick-born neonates, early nutritional support of pre- term infants is critical for the life-long health and well- being. Total parenteral nutrition (TPN) is one of the methods to serve the maximal nutrition in a fast and timely manner. And it prevents the complications from
the malnutrition to neonates who cannot achieve the desirable amounts of calories at the early stage of birth.
Parenteral nutrient solutions mainly consist with a lipid emulsion, crystalline amino acid and dextrose as a main nutritional source. In addition, enteral feeding (EN) is another nutritional support tool via placement through the nose, esophagus, stomach, or intestines (duodenum or jejunum) once oral feeding is feasible. However, due to the immature gastrointestinal absorption capability and the potential intolerance to enteral nutrition in early stage of birth, it is often associated with several complications such as metabolic-, infectious-, and hepatobiliary prob-
Correspondence to : Sandy (Jeong Yeon) Rhie
College of Pharmacy, Ewha Womans University, Seoul 120-750, Korea
Tel: +82-2-3277 3023, Fax: +82-2-3277-3051 E-mail: [email protected]
lems when it is inadequately managed.
1)In rare cases, a possible necrotizing enterocolitis could be a concern. In clinical setting, TPN treatment requires the well-organized program with interdisciplinary management approach to achieve not only the effectiveness of treatment, but also the safety. Many studies evaluated the outcomes of the interventions on TPN management. Some of the efforts include assessing the compatibility of TPN solution with concomitantly administering intravenous medications, the solubility of calcium and phosphorus contents in the solution to prevent unwanted precipitation,
2)and the osmolarity to keep the osmolarity less than 850 mOsm/
L
3)to lower the risk of phlebitis for peripheral intravenous access. Healthcare providers should be aware of signs of catheter-induced infections at the TPN needle site and con- tamination from the compounding process.
4,5)The benefits of operating a nutritional support team (NST) with the mul- tidisciplinary members with physicians, pharmacists, nutritionists, and nurses had been assessed by optimizing the formulation. It thus demonstrated maximizing the impact of the activities of the professionals on patients’
clinical prognosis and further to prevent the complica- tions associated with TPN.
6)In neonatal intensive care unit (NICU), TPN is sug- gested to support all the ill and premature babies who are less than 1.5 kg, are unable to be fed at least 60 kcal/kg/day by oral or enteral route within 2~3days after birth. A direct relationship between the nutrition supply and prognosis was first described by Stephens et al. who showed an association between an increased protein-energy intake during the first week of life and improved neuromotor development scores in 18-month-old children.
7)This association strengthens the concept that parenteral nutrition should be started as soon as possible, prefera- bly within the first hours after birth; this has been shown to be both safe and effective.
8)Otherwise, these neonates are at the high risk of the excessive protein loss by malnutrition in infants. It could result in the impaired neurocognitive developmental and physical growth.
9-13)Based on European Society of Pediatric Gas- troenterology, Hepatology and Nutrition (ESPGHAN) and European Society for Clinical Nutrition and Metabolism
(ESPEN) guidelines
14,15)to infants, children and adoles- cents, they justify that a premature birth should be attended to by neonatal intensive care unit (ICU) teams as a nutritional emergency.
15)They also note that the important role of TPN in the nutritional support for pre- term and sick-born infants in NICU, as enteral feedings does together. It allows the survival from the starvation after the reserve exhaustion for only up to four days with- out nutritional support which is even shorter in hyperme- tabolism states. Pharmacist-monitored TPN management program in neonates has provided a benefit on weight gaining by maximize the amount of nutrients
26)and mini- mize the complications. In various studies, incorporat- ing pharmacists into interdisciplinary NST team in direct patient care showed a potential solution to improve health care outcomes.
17)Korea is still consid- ered as a fast growing developed country with prevalent physician-oriented practice. The pharmacist-involved TPN program in NICU has not been well investigated, yet. Thus, our study evaluated the impact of pharma- cist’s invention on NST program in NICU after the implementation of new program by pharmacy at a ter- tiary teaching hospital in Korea.
METHODS
Study design
A retrospective, observational study was carried out at NICU in Konkuk Medical Center, Seoul, Korea. The approval of study protocol from Konkuk Medical Center institutional review boards was obtained (No: KUH 1280021). We included a total of 58 infants who were born at the hospital between January 2011 and October 2012.
Inclusion criterion was the neonates who were treated
with parenteral nutrition (PN) at birth for 7 or more
days at NICU. Exclusion criteria were the neonates who
were (a) on TPN for less than 7 days, (b) transferred
out of NICU while on TPN, (c) deceased on discharge,
or (d) duplicated between groups. Each neonate in the
control group was matched to a neonate born at similar
gestational age (GA) of intervention group in order to
remove the compounding effect of the gestational age
on TPN therapy outcomes. Among the control group, in case where two or more neonates with similar GA were found, one was chosen randomly and compared to the intervention group.
Intervention group: Among 60 neonates who were born during the study period, thirty-one were excluded from this study; twenty-six didn’t receive PN to meet the inclusion criteria of minimum 7 or more days, three were transferred out from NICU during study period, and two were duplicated. From June 15
thto October 31
stin 2012, the infants in the NICU were enrolled in the Pharmacy nutritional service with TPN prescription (n=29). Besides pharmacists’ participating to the daily medical round, pharmacist intervention included the assessment of nutritional intakes, patient’s clinical sta- tus, complications and the report any abnormal lab results associated with PN therapy. Prior to the medical round, a pharmacist reviewed the overnight report of any unusual episodes of the patients with the laboratory results in advance. Then the pharmacist prepared for the pharmacy nutritional report to share the current infor- mation with medical team. Pharmacy nutritional report contained the amount of combined TPN and enteral fluid intakes, the amount of total calories, the glucose infusion rate, and the amounts of proteins per weight in kilogram during 24 hrs. Differently from the control group with post-order review activity, pharmacist attended to the multidisciplinary medical round for the infants with the most updated accurate information of nutrition status in intervention group. In addition, phar- macist initiated on-time intervention on the TPN man- agement service for reviewing inappropriate TPN dosing, TPN-related complications, and checking com- patibility of TPN solution.
Control group: Control group was represented by the infants (n=29) who TPN order was processed without the pharmacy nutrition services in the NICU from Janu- ary 1
st, 2011 to June 14
th, 2012. During this period, one-hundred-twenty-five infants were born. However, ninety-six were excluded; sixty were on PN for less than 7 days, three were transferred out, two were dupli- cated, two were deceased upon discharge and twenty-
nine were not matched with the intervention group.
Once the TPN order was entered by physicians in the order entry system, pharmacists initiated to review the TPN order with consideration of the relevant lab results, a line accessibility for TPN administration, and a progress note on electronic medical chart. With any problems on TPN prescription, pharmacist tried to resolve the issues collaboratively with the physicians. On the contrary, in control group, pharmacists didn’t prepare for the nutri- tional report including other additional activities, so that physicians’ TPN prescriptions were processed mainly according to TPN dosing protocols and guidelines.
Whether pharmacists intervention was considered or not, for both groups, it was the physicians who deter- mine the composition of TPN formulations every morn- ing based on the individual’s daily serum chemistry results (sodium, potassium, BUN, creatinine, glucose, etc) and clinical status of the patients. The basic work- up of calculation of the solubility of Ca-P product and the osmolarity of TPN solution were performed by embedded instruments using TPN ordering computer based-program in both intervention and control group.
Data were collected from the medical records of each infant of the both groups and were compared. This included the chemical parameters of serum glucose (mg/dl), blood urine nitrogen (mg/dl), creatinine (mg/
ml), pH, bicarbonate, sodium, potassium, magnesium and ionized calcium. The safety outcomes were evalu- ated by investigating clinical prognosis records and lab results after the discontinuation of TPN, such as necrotizing enterocolitis ( ≥ stage 2b), intraventricular hemorrhage (≥
grade 3), proven sepsis, PN-induced hepatotoxicity, ALT (IU/L), AST (IU/L), ALP (IU/L) and direct bilirubin level (Table 2).
Statistical analysis
Data were analyzed using SPSS version 17 (SPSS Inc., Chicago, IL, USA). The program employed the unpaired student t-test to the data sets that were nor- mally distributed. Mann-Whitney test was used to ana- lyze the data sets that were non-normally distributed.
χ
2-test and Fisher’s exact tests were used for nominal
variables. Depending on distribution and the type of test, values are expressed as mean ±standard deviation, median (min-max), or percentage, respectively. Multi- ple variables were considered to be statistically signifi- cant at P<0.05.
RESULTS
Demographic and perinatal variables
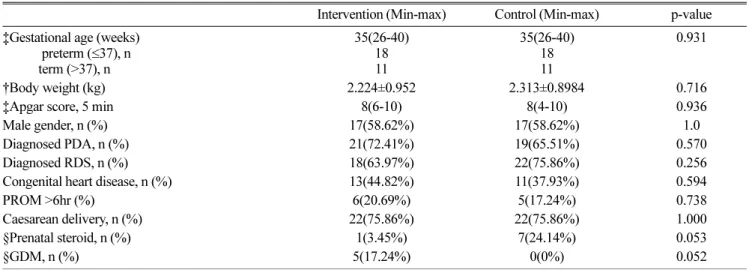
Matching the infants in the intervention with those in control groups based on GA was appropriate, as the median GA and the range (min-max) of both groups were not significantly different. Mean ±SD of the birth weight for both groups were similar (p=0.716). Besides, it didn’t show any significant differences between the two groups;
sex, delivery methods, 5-min APGAR score, percentage of congenital heart disease, the presence of heart functional disorder, respiratory distress syndrome, patent ductus arte- riosus, antenatal steroid medications and maternal diabe- tes. These variables were listed in Table 1.
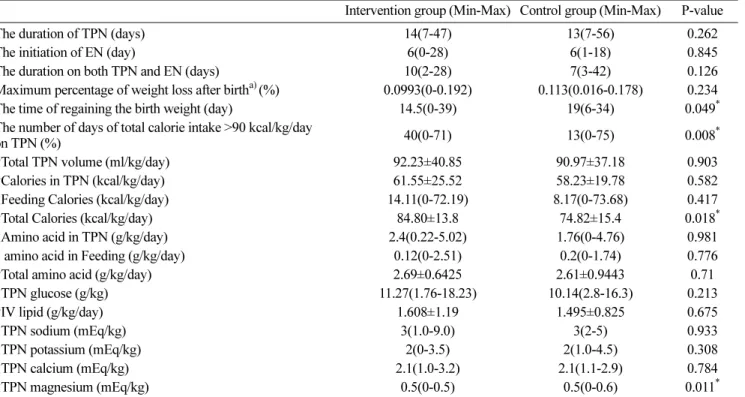
Nutrition composition during TPN
On the 7
thday of TPN administration, the composi- tions (fluid volume, caloric intake, amino acid, glucose,
sodium, potassium, calcium, magnesium) with or with- out EN were compared between intervention group and control group. There were no significant differences between both groups in; TPN composition, the rate of TPN administration, the initiation of the enteral feeding and treatment duration of both TPN and enteral nutri- tion. However, intervention group results were prefera- ble. The day of regaining birth weight was significantly shorter (14.5 days vs. 19 days, respectively, p=0.049) and the percentage of the number of days with total cal- ories >90 kcal/kg/day over the total duration of TPN administration was significantly higher (40% vs. 13%, respectively, p=0.008) in intervention group compared to the values in control group. In addition, the total mean daily caloric intakes (84.78 ±13.8 kcal/kg/day vs.
74.86±15.36 kcal/kg/day, respectively, p=0.018) were significantly higher in intervention group than those results in control group, that would be explained the adding effect of TPN and enteral feeding calories. A lower amount of the median magnesium was found in the intervention group (Table 2), which was explained by the impact of one of the pharmacist-interventions on magnesium content in TPN solution for the babies who showed hypermagensemia due to their mother use of
Table 1. Demographic and clinical characteristics of the infants in the study.
Intervention (Min-max) Control (Min-max) p-value
‡Gestational age (weeks) preterm (≤37), n term (>37), n
35(26-40) 18 11
35(26-40) 18 11
0.931
†Body weight (kg) 2.224±0.952 2.313±0.8984 0.716
‡Apgar score, 5 min 8(6-10) 8(4-10) 0.936
Male gender, n (%) 17(58.62%) 17(58.62%) 1.0
Diagnosed PDA, n (%) 21(72.41%) 19(65.51%) 0.570
Diagnosed RDS, n (%) 18(63.97%) 22(75.86%) 0.256
Congenital heart disease, n (%) 13(44.82%) 11(37.93%) 0.594
PROM >6hr (%) 6(20.69%) 5(17.24%) 0.738
Caesarean delivery, n (%) 22(75.86%) 22(75.86%) 1.000
§Prenatal steroid, n (%) 1(3.45%) 7(24.14%) 0.053
§GDM, n (%) 5(17.24%) 0(0%) 0.052
† Values are expressed as mean±SD and tested by t-test
‡ Values are expressed as median (min-max) and tested by Mann-Whitney test.
* Values are expressed as percentage and tested by χ2 test
§ Values are expressed as percentage and tested by Fisher’s exact test.
* Statistically significant; P<0.05
Abbreviation> RDS: respiratory distress syndrome, PDA: patent ductus arteriosus, PROM: premature rupture of membranes, GDM: gestational diabetes
magnesium sulfate during delivery.
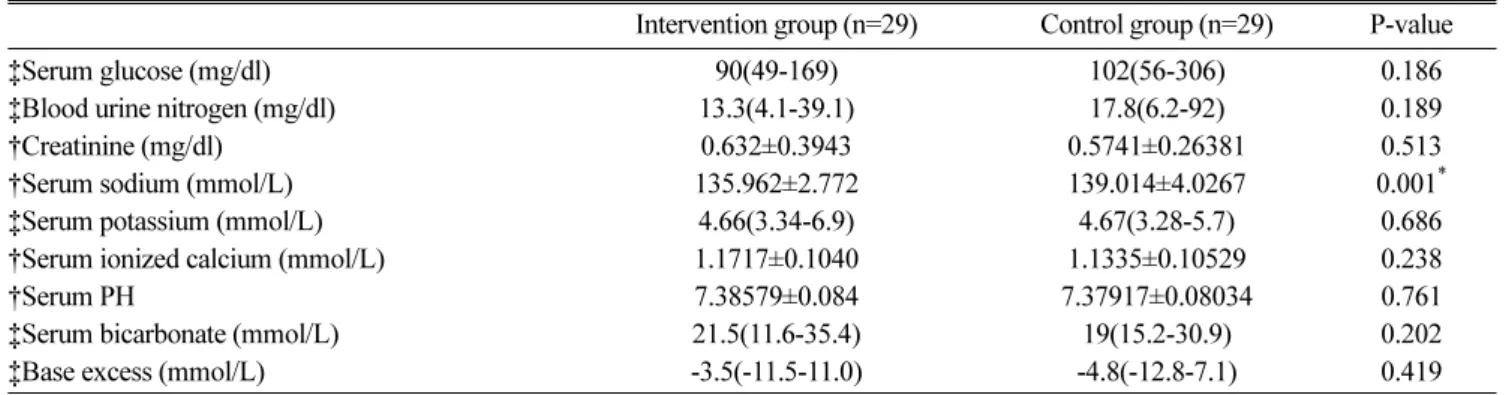
Mean serum biochemical parameters on the 7th day of TPN
Table 3 shows the mean values of serum biochemical parameters on the 7
thday of TPN. Compared to the control group, intervention group didn’t show signifi- cant differences in serum glucose, blood urine nitrogen, creatinine, serum sodium, serum potassium, serum ion- ized calcium, serum pH, serum bicarbonate and base excess. However, we found a significant decrease in the level of sodium in serum (135.96 ±2.77 mmol/L vs. 139.01±
4.03 mmol/L, p=0.001) in intervention group, although it was still in the normal range. Therefore the results may indicate that the pharmacist’s recommendation to increase the calorie supply, in many cases, didn’t cause
the metabolic complications.
Safety parameters
There were no significant differences in safety parameters between the two groups related to nutritional services of necrotizing enterocolitis ( ≥ stage 2b), intraventricular hem- orrhage ( ≥ grade 3), proven sepsis, and also PN-induced hepatotoxicity in the abnormal liver function enzymes level like AST, ALT and ALP (Table 4).
DISCUSSION
Preterm and sick-born neonates who cannot be fed with appropriate calories by oral and enteral routes within 3~5 days at birth are subjected to a high risk of development of malnutrition status due to the low nutri- Table 2. Nutritional composition during 7 days on TPN.
Intervention group (Min-Max) Control group (Min-Max) P-value
The duration of TPN (days) 14(7-47) 13(7-56) 0.262
The initiation of EN (day) 6(0-28) 6(1-18) 0.845
The duration on both TPN and EN (days) 10(2-28) 7(3-42) 0.126
Maximum percentage of weight loss after birth
a)(%) 0.0993(0-0.192) 0.113(0.016-0.178) 0.234
The time of regaining the birth weight (day) 14.5(0-39) 19(6-34) 0.049
*The number of days of total calorie intake >90 kcal/kg/day
on TPN (%) 40(0-71) 13(0-75) 0.008
*†Total TPN volume (ml/kg/day) 92.23±40.85 90.97±37.18 0.903
†Calories in TPN (kcal/kg/day) 61.55±25.52 58.23±19.78 0.582
‡Feeding Calories (kcal/kg/day) 14.11(0-72.19) 8.17(0-73.68) 0.417
†Total Calories (kcal/kg/day) 84.80±13.8 74.82±15.4 0.018
*‡Amino acid in TPN (g/kg/day) 2.4(0.22-5.02) 1.76(0-4.76) 0.981
‡ amino acid in Feeding (g/kg/day) 0.12(0-2.51) 0.2(0-1.74) 0.776
†Total amino acid (g/kg/day) 2.69±0.6425 2.61±0.9443 0.71
‡TPN glucose (g/kg) 11.27(1.76-18.23) 10.14(2.8-16.3) 0.213
†IV lipid (g/kg/day) 1.608±1.19 1.495±0.825 0.675
‡TPN sodium (mEq/kg) 3(1.0-9.0) 3(2-5) 0.933
‡TPN potassium (mEq/kg) 2(0-3.5) 2(1.0-4.5) 0.308
‡TPN calcium (mEq/kg) 2.1(1.0-3.2) 2.1(1.1-2.9) 0.784
‡TPN magnesium (mEq/kg) 0.5(0-0.5) 0.5(0-0.6) 0.011
*Values are expressed as median (min-max) and tested by Mann-Whitney test a) (Birth weight – minimum weight after birth)/birth weight
b) (Days of total calories >90 kcal/kg/day)/TPN duration, (%, percentage), if total calories didn’t reached to 90 kcal/kg/day over TPN duration, recorded “0”
†Values are expressed as mean±SD and tested by Student t-test
‡Values are expressed as median (min-max) and tested by Mann-Whitney test.
Nutritional and electrolyte composition of the solution was measured in units per kilogram
* Statistically significant; P<0.05
Abbreviation>TPN: total parenteral nutrition, EN: enteral nutrition
tional reserve. TPN is an essential nutritional supporting tool and it is indicated for the cases.
29)The energy used for the maintenance of the body metabolism and the growth in gestational age has to be obtained by nutritional support.
Calorie requirements in an infant should be carefully bal- anced not to be overfed which can result in hyperglyce- mia, hyperlipidemia, fatty liver, and PN-related liver toxicity, whereas malnutrition can cause an impaired immune function, an imbalance of nutrition, and a failure of catching up growth.
21,22)The design of the individual nutrition should consider the clinical status of the patients and the energy expenditure, while monitor con- tinuously the complications associated with TPN.
23)A numerous quantity of articles reporting the benefits of the involvement of a pharmacist as a member of the interdisciplinary team has been written. The clinical interventions of the pharmacists have played an impor-
tant role in identifying medication errors, increasing drug safety. Hence it is likely to be the most effective way of improving drug therapy.
17)The pharmacist in clinical nutritional support management, for example, advocates the safe use of nutritional therapy, the assess- ment of the nutritional and fluid requirements accu- rately with the actual nutrient intakes with adjusting the composition and compounding of parenteral feeding to avoid toxicities/complications.
25,26)That can highlight the pharmacist-managed nutritional service on NICU. However, there is only a minimum research proving the outcomes in Korea, yet.
Cox et al. investigated the application of the on-line TPN calculator on clinical practice and found that it prevented the medical errors and saved the working hours of the healthcare providers on TPN.
28)Another study also claimed that a nutritional program improved Table 3. Blood gas analysis and mean serum biochemical parameters on the 7th day of TPN.
Intervention group (n=29) Control group (n=29) P-value
‡Serum glucose (mg/dl) 90(49-169) 102(56-306) 0.186
‡Blood urine nitrogen (mg/dl) 13.3(4.1-39.1) 17.8(6.2-92) 0.189
†Creatinine (mg/dl) 0.632±0.3943 0.5741±0.26381 0.513
†Serum sodium (mmol/L) 135.962±2.772 139.014±4.0267 0.001
*‡Serum potassium (mmol/L) 4.66(3.34-6.9) 4.67(3.28-5.7) 0.686
†Serum ionized calcium (mmol/L) 1.1717±0.1040 1.1335±0.10529 0.238
†Serum PH 7.38579±0.084 7.37917±0.08034 0.761
‡Serum bicarbonate (mmol/L) 21.5(11.6-35.4) 19(15.2-30.9) 0.202
‡Base excess (mmol/L) -3.5(-11.5-11.0) -4.8(-12.8-7.1) 0.419
† Values are expressed as mean±SD and tested by Student t- test
‡Values are expressed as median (min-max) Statistically significant; P<0.05
Table 4. Complications and laboratory results related to TPN.
Intervention group (n=29) Control groups (n=29) P-value
Necrotizing enterocolitis (≥ stage 2b), n (%) 0/29(0%) 0/29(0%) NS
§Intraventricular hemorrhage ( ≥ grade 3), n(%) 4/29(13.79%) 5/29(17.24%) 1.0
†Proven sepsis, n(%) 10/29(34.48%) 7/29(24.14%) 0.387
†PN induced hepatotoxicity, n (%) 6/29(20.69%) 9/29(31.034%) 0.368
*AST (IU/L) 27(16-104) 35(17-203) 0.091
*ALT (IU/L) 13(6-86) 14(5-162) 0.427
*ALP (IU/L) 262(137-714) 283(115-868) 0.219
*d-bilirubin (mg/dl) 1.2(0.3-3.6) 0.9(0.2-4.9) 0.129
§ Values are expressed as No. of patients and percentage and tested by Fisher’s exact test
†
Values are expressed as No. of patients and percentage and tested by χ2 test* Values are expressed as median (min-max) and tested by Mann-Whitney test.
Statistically significant; P<0.05.