Copyright © 2020 The Korean Society for Bone and Mineral Research
This is an Open Access article distributed under the terms of the Creative Commons Attribution Non-Commercial Li- cense (https://creativecommons.org/licenses/by-nc/4.0/) which permits unrestricted non-commercial use, distribu- tion, and reproduction in any medium, provided the original work is properly cited.
Reference Intervals for Bone Turnover Markers in Korean Healthy Women
Dong Hyeok Cho1, Jin Ook Chung1, Min Young Chung1, Jeong-Ran Cho2, Dong Jin Chung1
1Division of Endocrinology and Metabolism, Department of Internal Medicine, Chonnam National University Hospital, Chonnam National University Medical School, Gwangju;
2Department of Health Administration, Kwangju Women’s University, Gwangju, Korea
Background: Adequate suppression of bone turnover rate is important to decrease frac- ture risk without mineralization defect due to oversuppression. This study was performed to determine reference intervals (RIs) for 2 bone turnover markers, serum C-terminal telopeptide of type I collagen (CTX) and osteocalcin, in Korean women. Methods: A to- tal of 461 Korean women (287 premenopausal and 174 postmenopausal) without any disease or drug history affecting bone metabolism was included. Serum CTX and osteo- calcin were measured after overnight fasting. Bone mineral density (BMD) was measured at the 1st to 4th lumbar vertebra using dual energy X-ray absorptiometry. Subjects with normal spinal BMD (T-score ≥-1.0) were included in this study. Results: After stable concentrations were maintained, both CTX and osteocalcin were abruptly increased in 50 to 59 years, and then decreased with increasing age. Median levels and interquartile range of serum CTX and osteocalcin in all subjects were 0.322 (0.212-0.461) ng/mL and 15.68 (11.38-19.91) ng/mL. RIs for serum CTX and osteocalcin in all subjects were 0.115 to 0.861 ng/mL and 6.46 to 36.76 ng/mL. Those were higher in postmenopausal women (CTX, 0.124-1.020 ng/mL, osteocalcin, 5.42-41.57 ng/mL) than in premenopausal wom- en (CTX, 0.101-0.632 ng/mL, osteocalcin, 6.73-24.27 ng/mL). If we use target reference levels as lower half of premenopausal 30 to 45 years in patients with antiresorptive drugs, those were 0.101 to 0.251 ng/mL and 6.40 to 13.36 ng/mL. Conclusions: We established RIs for serum CTX and osteocalcin in healthy Korean women with normal lumbar spine BMD. Premenopausal RIs for serum CTX and osteocalcin would be useful to monitor pa- tients with low bone mass using osteoporosis drugs.
Key Words: Bone remodeling · Osteocalcin · Osteoporosis · Reference values
INTRODUCTION
Bone mineral density (BMD) testing is very important for predicting fracture risk and monitoring of osteoporosis treatment response. However, bone turnover mark- ers (BTMs) reflect changes in bone metabolism earlier than BMD.[1,2] BTMs are useful in the monitoring of individual antiresorptive or anabolic therapy,[2-4] and early changes in BTMs represent the clinical efficacy of osteoporosis drugs.[4,5]
Most postmenopausal women with osteoporosis treated with effective antiresorp- tive drugs show a reduction in BTMs within a few weeks or months.[1,6] Moreover, BTMs could be used to monitor bone turnover when drug therapy is terminated, Corresponding author
Dong Jin Chung
Division of Endocrinology and Metabolism, Department of Internal Medicine, Chonnam National University Hospital, Chonnam National University Medical School, 42 Jebong-ro, Dong-gu, Gwangju 61469, Korea
Tel: +82-62-220-6500 Fax: +82-62-225-8578 E-mail: [email protected]
Received: January 17, 2020 Revised: February 3, 2020 Accepted: February 5, 2020
and to predict future fracture risk, or to monitor adherence to therapy.[3,4,7-12] Bone remodeling rates have been shown to increase dramatically after menopause and are maintained at approximately 3 times the rate seen in pre- menopausal women.[13] Thus a goal of antiresorptive ther- apy in postmenopausal women is to reduce bone remod- eling rates to those seen prior to menopause.[5] Inade- quate suppression of bone turnover has been associated with lack of significant fracture reduction in clinical trial.
[14] For use as treatment targets of BTMs in clinical field, we need to have appropriate reference interval (RI) for BTMs derived from healthy premenopausal women with no dis- ease or drugs that may affect bone metabolism. Once an appropriate RIs for BTMs in young premenopausal women has been determined, we can use those for evaluation and management in women with various metabolic bone dis- eases.
Bone turnover is high until skeletal maturity is reached, usually in the 3rd decade,[15] and some women aged more than 45 years show higher BTMs levels as bone turnover rate is increased in perimenopausal period prior to meno- pause.[16] Various premenopausal reference age ranges such as 30 to 45 years, 35 to 45 years, and 30 to 39 years and RIs for BTMs based on their data have been published in a number of studies.[5,17-24] It have been proposed in several studies that the target therapeutic goal of antiresorp- tive therapy is to reduce BTMs to lower half of the normal reference range of the premenopausal women.[2,8,11,25]
In this study, we determined the RI of 2 BTMs, serum C- terminal telopeptides of type I collagen (CTX) and osteo- calcin, in Korean healthy women with normal spinal BMD.
METHODS
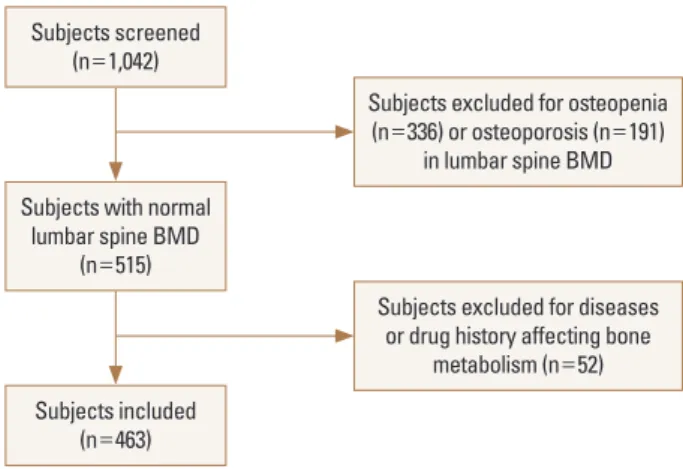
1. SubjectsA total of 1,042 women aged 20 to 80 years who visited Chonnam National University Hospital in Gwangju, Korea, from January 2005 to January 2011 for health check were retrospectively reviewed. To determine the RIs for BTMs, we included subjects with normal lumbar spine BMD (T- score ≥-1) according to World Health Organization crite- ria. The 527 women with low lumbar spine BMD (336 wom- en with osteopenia and 191 women with osteoporosis) were excluded from the study. Of the remaining 515 wom- en, 52 women were excluded based on medical record and
abnormal routine laboratory values. We excluded 36 wom- en with following diseases affecting bone metabolism;
Graves' disease (n=3), hypothyroidism (n=3), primary hy- perparathyroidism (n=1), hypoparathyroidism (n=4), os- teomalacia (n=1), Cushing's syndrome due to adrenal ad- enoma (n=1), Cushing's disease due to pituitary adenoma (n=1), hypopituitarism (n=8), acromegaly (n=1), menin- gioma (n=1), type 2 diabetes mellitus (n=8), liver cirrhosis (n=1), renal dysfunction (n=1), Crohn's disease (n=1), and breast cancer (n=1). Fifteen women who had received bis- phosphonates (n=9), raloxifene (n=1), hormone replace- ment therapy (n=3), tibolone (n=1), glucocorticoid (n=1) were also excluded. Patients with hypopituitarism men- tioned above also had received glucocorticoid and thyroid hormone. One more subject was also excluded due to se- vere degenerative change of lumbar spine. Altogether, af- ter excluding 579 women, 463 women (287 premenopaus- al and 176 postmenopausal) were included for the statisti- cal analysis (Fig. 1).
Participants were divided into age group by decade. The body mass index (BMI; in kg/m2) was calculated as the wei- ght (kg) divided by height (m) squared. BMD was measured at the 1st to 4th lumbar vertebra using dual energy X-ray absorptiometry (DXA; GE Lunar, Madison, WI, USA). All blood samples including complete blood count, blood glucose, liver function test, renal function test, total calcium, phos- phorus, and BTMs were collected between 08:00 a.m. and 10:00 a.m. after an overnight fast. This study was approved by Institutional Review Board of Chonnam National Uni- versity Hospital.
Fig. 1. Flow chart showing subject numbers at each stage of the study.
BMD, bone mineral density.
Subjects screened (n=1,042)
Subjects with normal lumbar spine BMD
(n=515)
Subjects included (n=463)
Subjects excluded for osteopenia (n=336) or osteoporosis (n=191)
in lumbar spine BMD
Subjects excluded for diseases or drug history affecting bone
metabolism (n=52)
2. BTMs
Serum CTX and osteocalcin were measured by Elecsys 2010 using β-Cross Laps/serum kit (Roche Diagnostics, Mannheim, Germany) and N-MID® Osteocalcin kit (Roche Diagnostics), respectively. The monthly based intra- and interassay coef- ficients of variation (CVs) for both BTMs were maintained below 5%.
3. Statistical analysis
Descriptive statistics were used to summarize both con- tinuous and discrete variables. Data were expressed as means and standard deviation (SD) for continuous vari- ables and as numbers for categorical variables. Far-out val- ues of BTMs in 2 subjects, that are smaller than the lower quartile minus 3 times the interquartile range (IQR), or larg- er than the upper quartile plus 3 times the IQR, were re- moved by Tukey method. Finally, serum CTX and osteocal- cin levels in 461 subjects were initially explored and as- sessed for normality by the Shapiro-Wilk or D'Agostino- Pearson test, and found to have distributions that were skewed to the right. Thus Logarithmic transformation was done to normalize the distribution before statistical analy- ses. Geometric mean was obtained from back transforma- tion from logarithmic transformation. Independent sample t-tests and analysis of variance were used for parametric analyses. For non-parametric analyses, Mann-Whitney U test or Kruskal-Wallis test were used. RIs calculated based on normally distributed transformed data are back trans- formed to original scale. RIs were determined as the cen- tral 95% range between the 2.5th and 97.5th percentiles of serum CTX and osteocalcin concentrations. The 90%
confidence intervals (CIs) for the upper and lower bounds of the RI were calculated. The arithmetic mean±SD, geo- metric mean, median, IQR, and 95% RI were calculated. All statistical analysis was carried out with SPSS version 25 (IBM Corp., Armonk, NY, USA) and MedCalc Version 19.1.3 (MedCalc® Software bvba, Ostend, Belgium). A P-value of less than 0.05 was considered statistically significant.
RESULTS
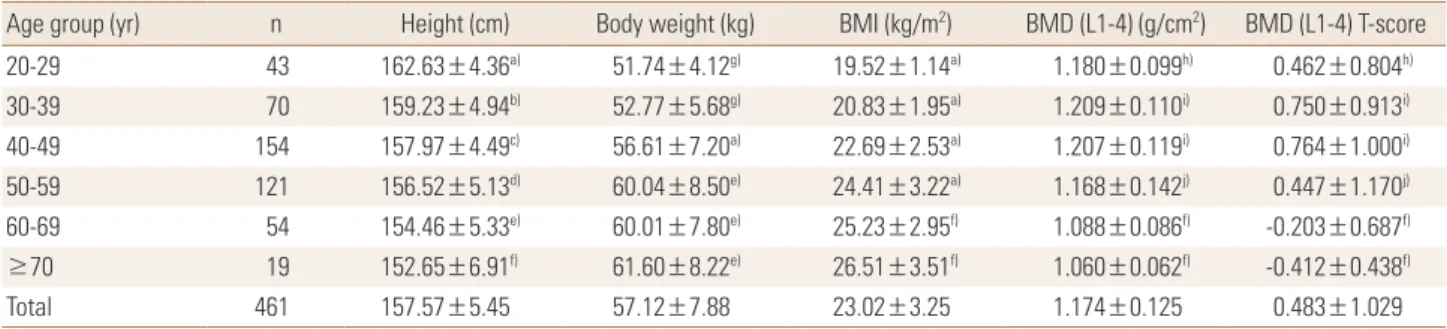
Anthropometric data and BMD are described in Table 1.
Height, body weight, BMI, lumbar spine BMD and T-score are described by age group of decade. As we expected, BMD was decreased with increasing age.
The median CTX value (IQR) was 0.322 (0.212-0.461) ng/
mL and median osteocalcin value (IQR) was 15.68 (11.38- 19.91) ng/mL in all subjects. Those were 0.258 (0.183-0.353) ng/mL and 13.38 (10.65-17.34) ng/mL in premenopausal women, and 0.463 (0.341-0.625) ng/mL and 20.25 (15.1- 27.2) ng/mL in postmenopausal women, respectively. BTMs values were significantly higher in postmenopausal wom- en than premenopausal women (P<0.01). RI for serum CTX and osteocalcin in all subjects were 0.115 to 0.861 ng/
mL, 6.46 to 36.76 ng/mL, respectively. The RIs were higher in postmenopausal women (CTX, 0.124-1.020 ng/mL; os- teocalcin, 5.42-41.57 ng/mL) than in premenopausal wom- en (CTX, 0.101-0.632 ng/mL; osteocalcin, 6.73-24.27 ng/mL) (Table 2).
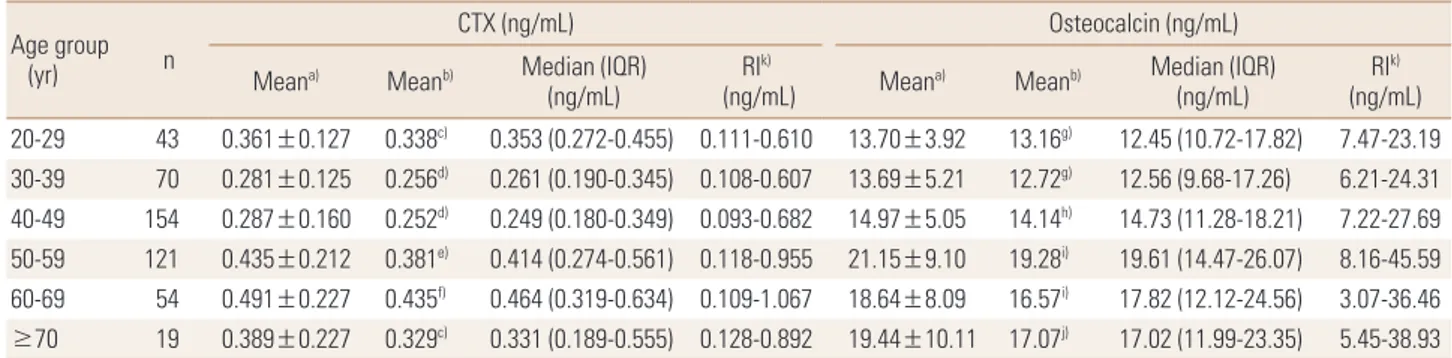
Table 3 shows the age range by decade specific RIs for the BTMs studied and includes the arithmetic means, geo- metric means, medians, IQR, and 95% RIs. Both BTM values
Table 1. Anthropometric characteristics and bone mineral density of all subjects by age group
Age group (yr) n Height (cm) Body weight (kg) BMI (kg/m2) BMD (L1-4) (g/cm2) BMD (L1-4) T-score
20-29 43 162.63±4.36a) 51.74±4.12g) 19.52±1.14a) 1.180±0.099h) 0.462±0.804h)
30-39 70 159.23±4.94b) 52.77±5.68g) 20.83±1.95a) 1.209±0.110i) 0.750±0.913i)
40-49 154 157.97±4.49c) 56.61±7.20a) 22.69±2.53a) 1.207±0.119i) 0.764±1.000i)
50-59 121 156.52±5.13d) 60.04±8.50e) 24.41±3.22a) 1.168±0.142j) 0.447±1.170j)
60-69 54 154.46±5.33e) 60.01±7.80e) 25.23±2.95f) 1.088±0.086f) -0.203±0.687f)
≥70 19 152.65±6.91f) 61.60±8.22e) 26.51±3.51f) 1.060±0.062f) -0.412±0.438f)
Total 461 157.57±5.45 57.12±7.88 23.02±3.25 1.174±0.125 0.483±1.029
The data is presented as mean±standard deviation.
a)P<0.05 compared with all the other age groups. b)P<0.05 compared with ≤29 years, and ≥50 years. c)P<0.05 compared with ≤29 years, and ≥60 years. d)P<0.05 compared with ≤39 years, and ≥70 years. e)P<0.05 compared with ≤49 years. f)P<0.05 compared with ≤59 years. g)P<0.05 compared with ≥40 years. h)P<0.05 compared with ≥60 years. i)P<0.05 compared with ≥50 years. j)P<0.05 compared with 30 to 49 years, and ≥60 years.
BMI, body mass index; BMD, bone mineral density; L, lumbar spine.
Table 2. Characteristics, bone mineral density, and reference intervals for bone turnover markers of all subjects by menopausal status Variables Premenopausal women (n=287) Postmenopausal women (n=174) All subjects (n=461)
Age (yr) 40.34±8.46 59.54±7.60a) 47.65±12.38
Years since menopause (year) - 9.63±8.24 -
Height (cm) 158.87±4.93 155.44±5.60a) 157.57±5.45
Body weight (kg) 55.23±6.89 60.19±8.42a) 57.12±7.88
BMI (kg/m2) 21.91±2.66 24.86±3.31a) 23.02±3.25
BUN (mg/dL) 12.72±3.73 16.50±6.99a) 14.62±5.91
Creatinine (mg/dL) 0.64±0.10 0.72±0.27a) 0.68±0.21
Total calcium (mEq/L) 4.46±0.23 4.63±0.99 4.59±0.87
Phosphorus (mg/dL) 3.51±0.39 3.90±0.61a) 3.71±0.55
BMD (L1-4) (g/cm2) 1.201±0.116 1.129±0.127a) 1.174±0.125
BMD (L1-4) T-score 0.700±0.968 0.131±1.032a) 0.483±1.029
Serum CTX (ng/mL)
Arithmetic mean 0.281±0.130 0.491±0.214a) 0.360±0.195
Geometric mean 0.253 0.441a) 0.312
Median (IQR) 0.258 (0.183-0.353) 0.463 (0.341-0.625)a) 0.322 (0.212-0.461)
Reference intervalb) 0.101-0.632 0.124-1.020 0.115-0.861
90% CI of lower limit 0.093-0.109 0.103-0.150 0.097-0.126
90% CI of upper limit 0.584-0.684 0.909-1.110 0.774-0.989
Serum osteocalcin (ng/mL)
Arithmetic mean 14.16±4.66 21.58±8.99a) 16.78±7.42
Geometric mean 13.40 19.56a) 15.32
Median (IQR) 13.38 (10.65-17.34) 20.25 (15.1-27.2)a) 15.68 (11.38-19.91)
Reference intervalb) 6.73-24.27 5.42-41.57 6.46-36.76
90% CI of lower limit 6.25-7.42 2.90-8.47 5.88-7.37
90% CI of upper limit 22.94-27.01 37.49-46.34 34.00-39.42
a)P<0.01 compared with premenopausal women. b)Reference intervals were determined as the 2.5th and 97.5th percentiles.
BMI, body mass index; BUN, blood urea nitrogen; BMD, bone mineral density; L, lumbar spine; CTX, C-terminal telopeptides of type I collagen; IQR, inter- quartile range; CI, confidence interval.
Table 3. Mean, median, and reference intervals for bone turnover markers according to age group by decade Age group
(yr) n
CTX (ng/mL) Osteocalcin (ng/mL)
Meana) Meanb) Median (IQR)
(ng/mL) RIk)
(ng/mL) Meana) Meanb) Median (IQR)
(ng/mL) RIk)
(ng/mL) 20-29 43 0.361±0.127 0.338c) 0.353 (0.272-0.455) 0.111-0.610 13.70±3.92 13.16g) 12.45 (10.72-17.82) 7.47-23.19 30-39 70 0.281±0.125 0.256d) 0.261 (0.190-0.345) 0.108-0.607 13.69±5.21 12.72g) 12.56 (9.68-17.26) 6.21-24.31 40-49 154 0.287±0.160 0.252d) 0.249 (0.180-0.349) 0.093-0.682 14.97±5.05 14.14h) 14.73 (11.28-18.21) 7.22-27.69 50-59 121 0.435±0.212 0.381e) 0.414 (0.274-0.561) 0.118-0.955 21.15±9.10 19.28i) 19.61 (14.47-26.07) 8.16-45.59 60-69 54 0.491±0.227 0.435f) 0.464 (0.319-0.634) 0.109-1.067 18.64±8.09 16.57i) 17.82 (12.12-24.56) 3.07-36.46
≥70 19 0.389±0.227 0.329c) 0.331 (0.189-0.555) 0.128-0.892 19.44±10.11 17.07j) 17.02 (11.99-23.35) 5.45-38.93
a)Arithmetic mean expressed as mean±standard deviation. b)Geometric mean. c)P<0.05 compared with 30 to 49 years, and 60 to 69 years. d)P<0.05 compared with 20 to 29 years, and ≥50 years. e)P<0.05 compared with 30 to 49 years. f)P<0.05 compared with ≤49 years, and ≥70 years, g)P<0.05 compared with ≥50 years. h)P<0.05 compared with 50 to 69 years. i)P<0.05 compared with ≤49 years. j)P<0.05 compared with ≤39 years. k)Refer- ence intervals were determined as the 2.5th and 97.5th percentiles.
CTX, C-terminal telopeptide of type I collagen; IQR, interquartile range; RI, reference interval.
were significantly different among age groups by decade.
Serum CTX level was decreased after 20 to 29 years, and maintained in stable concentration to 30 to 49 years, and
then abruptly increased in 50 to 59 years, and then decre- ased with age ≥70 years. Serum osteocalcin level was sig- nificantly lower in 20 to 49 years than other age group, and
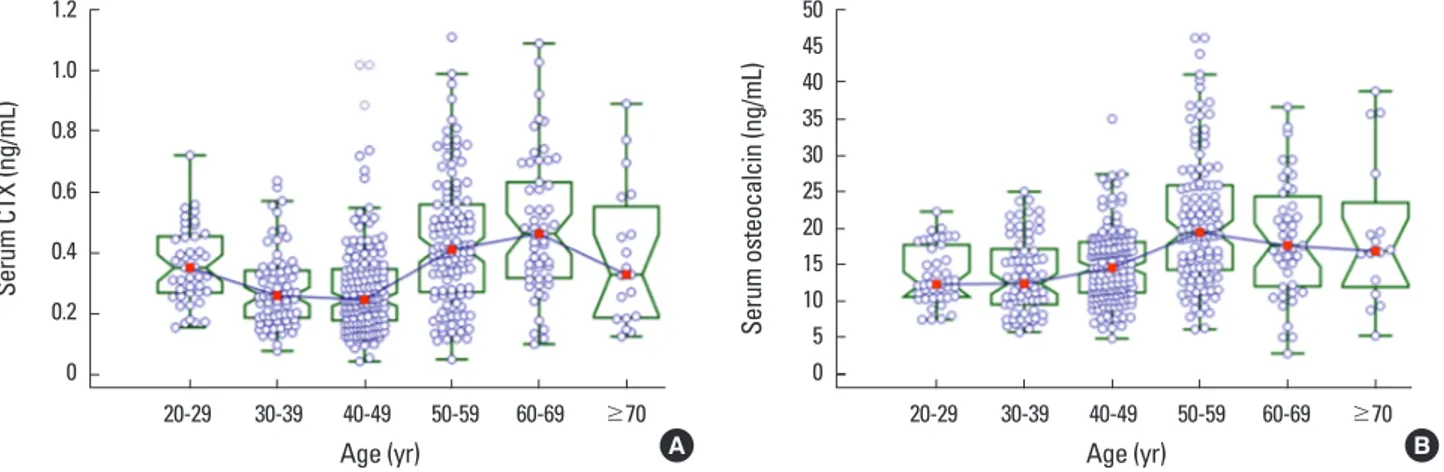
abruptly increased in 50 to 59 years, and then decreased with increasing age (Table 3). Age-related distribution of both BTMs were expressed in Figure 2A, B. Age-related RIs for both BTMs were depicted in Figure 3A, B.
As we expected, postmenopausal women with years
since menopause (YSM) ≤10 years shows higher bone turnover rate than those with YSM >10 years (Table 4).
Several studies suggest various age range for premeno- pausal RI for BTMs. We calculated this RIs from premeno- pausal women with 30 to 45 years, and they were 0.101 to
Table 4. Mean, median, and reference intervals for bone turnover markers according to years since menopause Group by
YSM (year) n
CTX (ng/mL) Osteocalcin (ng/mL)
Mean±SDa) Meanb) Median (IQR)
(ng/mL) RId)
(ng/mL) Mean±SDa) Meanb) Median (IQR)
(ng/mL) RId) (ng/mL) YSM ≤10 114 0.517±0.208 0.474c) 0.485 (0.375-0.634) 0.122-1.028 22.57±8.90 20.84 21.23 (16.25-27.39) 9.30-46.70 YSM >10 60 0.442±0.220 0.386 0.410 (0.283-0.602) 0.116-0.974 19.59±8.93 17.22 19.07 (13.26-25.72) 3.59-38.26
a)Arithmetic mean. b)Geometric mean. c)P<0.05 compared with YSM >10. d)Reference intervals were determined as the 2.5th and 97.5th percentiles.
YSM, years since menopause; CTX, C-terminal telopeptide of type I collagen; SD, standard deviation; IQR, interquartile range; RI, reference interval.
Fig. 2. Notched box-and-whisker plot for age-related distribution of serum (A) C-terminal telopeptides of type I collagen (CTX) and (B) osteocalcin levels in healthy Korean women. Boxes represent interquartile range. Middle horizontal line and square inside the box represent median. If the notches in the boxes about 2 medians do not overlap, the medians are significantly different at a±95% confidence interval.
1.2 1.0 0.8 0.6 0.4 0.2 0
Serum CTX (ng/mL)
20-29 30-39 40-49 50-59 60-69 ≥70 Age (yr)
50 45 40 35 30 25 20 15 10 5 0
Serum osteocalcin (ng/mL)
20-29 30-39 40-49 50-59 60-69 ≥70 Age (yr)
A B
Fig. 3. Age-related reference interval for serum (A) C-terminal telopeptides of type I collagen (CTX) and (B) osteocalcin levels in healthy Korean women.
1.2 1.0 0.8 0.6 0.4 0.2 0
Serum CTX (ng/mL)
20 30 40 50 60 70 80
Age (yr) A
Centiles 2.5th-97.5th 5th-95th 10th-90th
50 45 40 35 30 25 20 15 10 5 0
Serum Osteocalcin (ng/mL)
20 30 40 50 60 70 80
Age (yr) B
Centiles 2.5th-97.5th 5th-95th 10th-90th
0.619 ng/mL for serum CTX and 6.40 to 27.04 ng/mL for osteocalcin (Table 5). When we consider antiresorptive treatment target ranges of lower half of premenopausal RIs in this age group, it might be 0.101 to 0.251 ng/mL for serum CTX and 6.40 to 13.36 ng/mL for serum osteocalcin, respectively.
DISCUSSION
In this study, we established RIs for serum CTX and os- teocalcin in healthy Korean women with normal spinal BMD. In general, the RIs for serum CTX and osteocalcin in this study were similar to most of other previous results.
[3,5,17,18,26-29] After stable concentration until 40 to 49 years, both CTX and osteocalcin levels were abruptly in- creased in 50 to 59 years, and then decreased with increas- ing age. Women with YSM less than 10 years shows signifi- cantly higher BTMs levels than those with YSM greater than 10 years. These changes are due to abrupt increase of bone remodeling after menopause, and similar results are also reported in other studies.[21,23,27-31]
Although the RIs for BTMs in this study were similar to many other previous studies, there are some reports show- ing ethnic or geographic differences of BTMs. In a study of 637 women from 4 countries (UK, France, Belgium, and USA), serum CTX and N-terminal propeptide of type I col- lagen were significantly higher in France relative to other countries. However, after adjusting factors such as BMI, smoking habit, exercise, and alcohol consumption, any country differences were attenuated or removed.[17] BTM levels may differ in women of different ethnic origin be- cause many unknown factors may contribute the variabili- ty in bone marker levels.[17] There are data showing ethnic groups differ in fragility fracture risk, BMD, and the rate of bone turnover.[32-34] Black women have a lower incidence of vertebral and hip fractures than white women. African Americans are reported to have higher plasma parathyroid hormone (PTH) concentrations and a concomitant lower rate of bone turnover compared to white Americans,[33-36]
suggesting that there may be decreased skeletal sensitivity to PTH.[37,38] Therefore, RIs for BTMs need to be established for different geographic area and ethnicities.[3-5,17]
An abrupt elevation in the BTMs in association with meno- pause is widely accepted. Garnero et al. [39] reported 37%
and 79% higher levels of osteocalcin and CTX, respectively, Table 5. Premenopausal reference intervals for bone turnover markers in other studies ReferencesCountrynAge range (yr)CTX (ng/mL)Osteocalcin (ng/mL) Geometric mean (95% RI)Median (IQR)95% RIc)Geometric mean (95% RI)Median (IQR)95% RIc) Present studyKorea14730-450.2510.251 (0.180-0.343)0.101-0.61913.113.36 (10.19-17.38)6.40-27.04 Bae et al. [24]Korea32122-540.2790.036-0.899 Suk et al. [43]Korea1,16631-500.110-0.810a)8.00-31.46 Glover et al. [18] UK15335-450.2500.100-0.62013.46.8-26.5 19330-450.2700.110-0.69014.17.0-28.3 Gossiel et al. [23] UK, Germany, France15830-390.1900.050-0.63017.98.8-36.4 Guañabens et al. [42]Spain18435-450.137-0.484b) 0.109-0.544b)(8.0-23.0) Hu et al. [30]China40635-450.2410.2100.112-0.49715.0513.904.91-22.31 Li et al. [29]China17630-menopause0.2600.080-0.720 de Papp et al. [5]USA17828-450.2440.094-0.659 Glover et al. [17] UK, France, Belgium, USA63730-390.3170.2990.114-0.628 Jenkins et al. [27]Australia21530-39(0.100-0.700)0.264 (0.184-0.384)0.050-0.900 Michelsen et al. [28]Germany38230-540.230 (0.160-0.340)0.050-0.670 Eastell et al. [26] France, Denmark19430-390.2970.111-0.791 a)Menopausal status was not identified. b)5th and 95th percentiles. c)Reference intervals were determined as the 2.5th and 97.5th percentiles. CTX, C-terminal telopeptide of type I collagen; IQR, interquartile range; RI, reference interval.
in postmenopausal women with YSM <10 years than in premenopausal women. The corresponding differences in the present study were 59% and 93%, respectively, and in the Japanese study,[31] 71% and 138%, respectively. The BTMs levels of postmenopausal women in both present and Japanese studies were higher than those reported for Caucasians by Garnero et al. [39] and Bauer et al. [40]. How- ever, further studies in the different populations are neces- sary to determine if the racial differences in bone turnover exist.
Bauer et al. [41] proposed RIs for BTMs in older healthy population. They suggested age range of 60 to 75 years to exclude age ≤60 years to avoid the changes of early meno- pause or menopausal transition and age ≥75 years to ex- clude very elderly people who commonly have comorbidi- ties that accelerate bone loss. Michelsen et al. [28] reported postmenopausal RI for serum CTX as 0.080 to 0.990 ng/mL in age 60 to 75 years. Gossiel et al. [23] reported RI for se- rum CTX and osteocalcin in healthy postmenopausal wom- en with age range of 55 to 79 years as geometric mean 95% CI, 0.31 (0.10-1.00) ng/mL and 24.5 (12.7-47.4) ng/mL, respectively. In this study, we also calculated RIs for serum CTX and osteocalcin in age 60 to 75 years: they were 0.110 to 1.040 ng/mL and 3.8 to 38.0 ng/mL, respectively.
Several studies suggest appropriate reference age range for premenopausal RI for BTMs as described in Table 5.[5,17, 18,23,24,26-28,30,42,43] Most of them suggest these refer- ence age ranges based on their BTMs data that are main- tained to stable concentrations. During skeletal growth in young females, bone mass is accrued up until the third de- cade of life,[44] and bone turnover rate reaches a plateau.
Therefore, women under 30 years of age may have elevat- ed bone turnover rate. And there is a possibility of early in- crease of BTMs due to early menopause or perimenopaus- al status with age ≥45 years. In one study, they showed there is no significant bone change in 30 to 45 years in wom- en who were calcium balanced and of optimal bone health.
[45] However, there is also a suggestion that bone turnover rate might be still higher until 35 years of age due to skele- tal immaturity.[18,30] In our study, serum CTX level was somewhat higher in 20 to 29 years than 30 to 49 years.
Therefore, we determined premenopausal RIs for BTMs in subjects with 30 to 45 years. Premenopausal serum CTX median level in this study was 0.251 ng/mL, and it is simi- lar to several other previous reported levels such as 0.230
to 0.264 ng/mL.[5,27-29] Nearly all of the reported median CTX levels were between 0.2 to 0.3 ng/mL.[5,17,18,26-30]
Two other studies with Korean women show more wide RIs for serum CTX.[24,43] One study by Suk et al. [43] showed RI for serum CTX in women with 31 to 50 years without known information of menopausal status, therefore, there is a possibility of including early menopause or perimeno- pausal women with higher bone turnover rate. In another study by Bae et al. [24], they reported RI for serum CTX in premenopausal women with 22 to 54 years, therefore, there is a possibility of including early adolescent and perimeno- pausal women with higher bone turnover status. Hu et al.
[30] selected reference age range as 35 to 45 years, which were narrower than other studies, and reported lower me- dian level as 0.210 ng/mL. In their report, serum CTX level was still higher in 30 to 34 years, which may suggest that they had not yet reached skeletal maturity.[30] Glover et al. [18] also suggested that BTMs were higher under the age 35, and reported 0.250 ng/mL as geometric mean in 35 to 45 years [18]. We also analyzed serum CTX levels be- tween 30 to 34 years and 35 to 45 years. However, there was no statistical difference between these 2 age groups (data not shown), and geometric mean was similar to our result. Premenopausal serum osteocalcin median level in this study was 13.36 ng/mL, and it is similar to the level re- ported by Hu et al. [30]. Geometric mean 13.1 ng/mL in our study was similar to 2 other studies as 13.4 and 15.05 ng/mL.[18,30] In one study, serum CTX and osteocalcin levels determined as geometric mean were somewhat dif- ferent from other studies. However, they acquired non- fasting blood sample for BTMs and used narrower refer- ence age range of 30 to 39 years (Table 5).[23]
In several studies, the lower half of the premenopausal RI (values between the lower limit of the RI and the medi- an) has been proposed as a target for antiresorptive drug treatment.[23,25] From this point of view, when antire- sorptive drugs are used, we suggest the treatment target ranges of lower half of premenopausal RIs might be 0.101 to 0.251 ng/mL for serum CTX and 6.40 to 13.36 ng/mL for serum osteocalcin, respectively. When we considering the median levels and 95% RIs for serum CTX and osteocalcin, these treatment target ranges were similar to the results of other studies (Table 5).[5,17,18,23,26-28,30,42]
This study have several limitations. First, because the subjects in this study visited for health examination and
checked BMD only at the spine. So, there is a possibility that some subjects, especially with aged women, have low bone mass at the femur in spite of normal spine BMD. Sec- ond, dietary calcium intake was not analyzed in this study;
therefore, we could not identify the effect of calcium in- take on bone turnover. Third, vitamin D level was not avail- able. Because vitamin D is important for maintenance of bone mass, we could not examine the effect of vitamin D level for bone turnover rate. Fourth, all medical and drug history was obtained only by medical record. So, there is possible recall bias. However, we selected subjects with normal spinal BMD with T-score more than -1.0; therefore, the effects of these issues might not be great.
In conclusion, we determined RIs for serum CTX and os- teocalcin in healthy Korean women with normal spinal BMD.
Especially, RIs for 2 BTMs in premenopausal healthy wom- en with 30 to 45 years will contribute to the appropriate assessment and monitoring of bone turnover rate in the evaluation and management of osteoporosis.
DECLARATIONS
Ethics approval and consent to participate This study was approved by Institutional Review Board (IRB) of Chonnam National University Hospital.
Conflict of interest
No potential conflict of interest relevant to this article was reported.
ORCID
Dong Hyeok Cho https://orcid.org/0000-0001-5268-1483 Dong Jin Chung https://orcid.org/0000-0001-6562-2175
REFERENCES
1. Garnero P, Shih WJ, Gineyts E, et al. Comparison of new biochemical markers of bone turnover in late postmeno- pausal osteoporotic women in response to alendronate treatment. J Clin Endocrinol Metab 1994;79:1693-700.
2. Delmas PD, Hardy P, Garnero P, et al. Monitoring individual response to hormone replacement therapy with bone mark- ers. Bone 2000;26:553-60.
3. Park SY, Ahn SH, Yoo JI, et al. Clinical application of bone turnover markers in osteoporosis in Korea. J Bone Metab
2019;26:19-24.
4. Park SY, Ahn SH, Yoo JI, et al. Position statement on the use of bone turnover markers for osteoporosis treatment.
J Bone Metab 2019;26:213-24.
5. de Papp AE, Bone HG, Caulfield MP, et al. A cross-sectional study of bone turnover markers in healthy premenopaus- al women. Bone 2007;40:1222-30.
6. Gertz BJ, Shao P, Hanson DA, et al. Monitoring bone re- sorption in early postmenopausal women by an immuno- assay for cross-linked collagen peptides in urine. J Bone Miner Res 1994;9:135-42.
7. Vasikaran S, Eastell R, Bruyère O, et al. Markers of bone turnover for the prediction of fracture risk and monitoring of osteoporosis treatment: a need for international refer- ence standards. Osteoporos Int 2011;22:391-420.
8. Srivastava AK, Vliet EL, Lewiecki EM, et al. Clinical use of serum and urine bone markers in the management of os- teoporosis. Curr Med Res Opin 2005;21:1015-26.
9. Johansson H, Odén A, Kanis JA, et al. A meta-analysis of reference markers of bone turnover for prediction of frac- ture. Calcif Tissue Int 2014;94:560-7.
10. Glendenning P. Markers of bone turnover for the predic- tion of fracture risk and monitoring of osteoporosis treat- ment: a need for international reference standards: osteo- poros int 2011;22:391-420. Clin Biochem Rev 2011;32:45-7.
11. Garnero P, Sornay-Rendu E, Claustrat B, et al. Biochemical markers of bone turnover, endogenous hormones and the risk of fractures in postmenopausal women: the OFE- LY study. J Bone Miner Res 2000;15:1526-36.
12. Yoon BH, Yu W. Clinical utility of biochemical marker of bone turnover: Fracture risk prediction and bone healing.
J Bone Metab 2018;25:73-8.
13. Recker R, Lappe J, Davies KM, et al. Bone remodeling in- creases substantially in the years after menopause and re- mains increased in older osteoporosis patients. J Bone Miner Res 2004;19:1628-33.
14. Recker R, Stakkestad JA, Chesnut CH, 3rd, et al. Insufficient- ly dosed intravenous ibandronate injections are associat- ed with suboptimal antifracture efficacy in postmenopaus- al osteoporosis. Bone 2004;34:890-9.
15. Pi YZ, Wu XP, Liu SP, et al. Age-related changes in bone bio- chemical markers and their relationship with bone miner- al density in normal Chinese women. J Bone Miner Metab 2006;24:380-5.
16. Hoshino H, Kushida K, Takahashi M, et al. Changes in lev-
els of biochemical markers and ultrasound indices of Os calcis across the menopausal transition. Osteoporos Int 2000;11:128-33.
17. Glover SJ, Gall M, Schoenborn-Kellenberger O, et al. Estab- lishing a reference interval for bone turnover markers in 637 healthy, young, premenopausal women from the Unit- ed Kingdom, France, Belgium, and the United States. J Bone Miner Res 2009;24:389-97.
18. Glover SJ, Garnero P, Naylor K, et al. Establishing a refer- ence range for bone turnover markers in young, healthy women. Bone 2008;42:623-30.
19. Adami S, Bianchi G, Brandi ML, et al. Determinants of bone turnover markers in healthy premenopausal women. Cal- cif Tissue Int 2008;82:341-7.
20. Yoo JI, Park AJ, Lim YK, et al. Age-related reference inter- vals for total collagen-I-N-terminal propeptide in healthy Korean population. J Bone Metab 2018;25:235-41.
21. Wu XY, Zhang H, Xie H, et al. Reference intervals of bone turnover markers determined by using their curve-fitting valley for adult females in China. Osteoporos Int 2014;25:
943-52.
22. Ardawi MS, Maimani AA, Bahksh TA, et al. Reference inter- vals of biochemical bone turnover markers for Saudi Ara- bian women: a cross-sectional study. Bone 2010;47:804- 14.
23. Gossiel F, Finigan J, Jacques R, et al. Establishing reference intervals for bone turnover markers in healthy postmeno- pausal women in a nonfasting state. Bonekey Rep 2014;3:
573.
24. Bae SJ, Kim BJ, Lim KH, et al. Efficacy of intravenously ad- ministered ibandronate in postmenopausal Korean wom- en with insufficient response to orally administered bispho- sphonates. J Bone Miner Metab 2012;30:588-95.
25. Eastell R, Barton I, Hannon RA, et al. Relationship of early changes in bone resorption to the reduction in fracture risk with risedronate. J Bone Miner Res 2003;18:1051-6.
26. Eastell R, Garnero P, Audebert C, et al. Reference intervals of bone turnover markers in healthy premenopausal wom- en: results from a cross-sectional European study. Bone 2012;50:1141-7.
27. Jenkins N, Black M, Paul E, et al. Age-related reference in- tervals for bone turnover markers from an Australian ref- erence population. Bone 2013;55:271-6.
28. Michelsen J, Wallaschofski H, Friedrich N, et al. Reference intervals for serum concentrations of three bone turnover
markers for men and women. Bone 2013;57:399-404.
29. Li M, Li Y, Deng W, et al. Chinese bone turnover marker study: reference ranges for C-terminal telopeptide of type I collagen and procollagen I N-terminal peptide by age and gender. PLoS One 2014;9:e103841.
30. Hu WW, Zhang Z, He JW, et al. Establishing reference in- tervals for bone turnover markers in the healthy shanghai population and the relationship with bone mineral densi- ty in postmenopausal women. Int J Endocrinol 2013;2013:
513925.
31. Iki M, Akiba T, Matsumoto T, et al. Reference database of biochemical markers of bone turnover for the Japanese female population. Japanese Population-based Osteopo- rosis (JPOS) Study. Osteoporos Int 2004;15:981-91.
32. Kanis JA, Odén A, McCloskey EV, et al. A systematic review of hip fracture incidence and probability of fracture world- wide. Osteoporos Int 2012;23:2239-56.
33. Kleerekoper M, Nelson DA, Peterson EL, et al. Reference data for bone mass, calciotropic hormones, and biochemi- cal markers of bone remodeling in older (55-75) postmeno- pausal white and black women. J Bone Miner Res 1994;9:
1267-76.
34. Finkelstein JS, Sowers M, Greendale GA, et al. Ethnic varia- tion in bone turnover in pre- and early perimenopausal women: effects of anthropometric and lifestyle factors. J Clin Endocrinol Metab 2002;87:3051-6.
35. Aloia JF, Mikhail M, Pagan CD, et al. Biochemical and hor- monal variables in black and white women matched for age and weight. J Lab Clin Med 1998;132:383-9.
36. Bell NH, Greene A, Epstein S, et al. Evidence for alteration of the vitamin D-endocrine system in blacks. J Clin Invest 1985;76:470-3.
37. Cosman F, Morgan DC, Nieves JW, et al. Resistance to bone resorbing effects of PTH in black women. J Bone Miner Res 1997;12:958-66.
38. Fuleihan GE, Gundberg CM, Gleason R, et al. Racial differ- ences in parathyroid hormone dynamics. J Clin Endocrinol Metab 1994;79:1642-7.
39. Garnero P, Sornay-Rendu E, Chapuy MC, et al. Increased bone turnover in late postmenopausal women is a major determinant of osteoporosis. J Bone Miner Res 1996;11:
337-49.
40. Bauer DC, Sklarin PM, Stone KL, et al. Biochemical markers of bone turnover and prediction of hip bone loss in older women: the study of osteoporotic fractures. J Bone Miner
Res 1999;14:1404-10.
41. Bauer D, Krege J, Lane N, et al. National bone health alli- ance bone turnover marker project: Current practices and the need for US harmonization, standardization, and com- mon reference ranges. Osteoporos Int 2012;23:2425-33.
42. Guañabens N, Filella X, Monegal A, et al. Reference inter- vals for bone turnover markers in Spanish premenopausal women. Clin Chem Lab Med 2016;54:293-303.
43. Suk JH, Cho EH, Lee SY, et al. Laboratory evaluation of bone
metabolism index using elecsys 2010. Korean J Lab Med 2006;26:146-52.
44. Teegarden D, Proulx WR, Martin BR, et al. Peak bone mass in young women. J Bone Miner Res 1995;10:711-5.
45. Wu XP, Liao EY, Huang G, et al. A comparison study of the reference curves of bone mineral density at different skel- etal sites in native Chinese, Japanese, and American Cau- casian women. Calcif Tissue Int 2003;73:122-32.