Oral glucose tolerance test for preoperative assessment of liver function in liver resection
Saravanan Manickam Neethirajan1, and Raghavendra Rao Rachapoodivenkata2
1Department of Gastrointestinal Surgery, Govind Ballabh Pant Institute of Postgraduate Medical Education and Research, New Delhi, 2National Institute of Gastroenterology and Liver Diseases, Hyderabad, India
Backgrounds/Aims: We intended to determine the role of the Oral glucose tolerance test (OGTT), in addition to volume- try, in preoperative assessment of patients undergoing liver resection. Methods: This was a prospective study con- ducted at a tertiary care hospital, between February 2009 and February 2011. OGTT curve (parabolic/linear), linearity index (LI) and Parenchymal Hepatic Resection Rate (PHRR) were correlated with postoperative outcomes in terms of postoperative liver failure (PLF), by 50-50 criteria, morbidity, mortality and hospital stay. Results: Of the 33 patients included in the study, 23 (69.7%) patients underwent major liver resections. Hepatocellular carcinoma (30.3%) was the leading indication. The overall postoperative morbidity rate was 72.7%, but major complications occurred in 3 (9.1%) patients only. There was no 90-day mortality. The 50-50 criteria were met by 3 patients undergoing major resection.
Significant correlation was noted between the linear OGTT curve and the overall hospital stay (12.1 days vs. 9.6 days in parabolic; p=0.04). Patients with linear OGTT met the 50-50 criteria more often (18%) than those having a parabolic curve (4.5%; p=0.25). Although the OGTT was more often linear with occurrence of morbidity (41.7% vs 11.1%), major morbidity (66.7% vs 30%) and PLF by 50-50 criteria (66.7% vs 30%), it was not statistically significant. The linearity index was marginally lower (0.9 vs 1.2) in the presence of major morbidity and PLF by 50-50 criteria. Conclusions:
Linear OGTT affects the PLF and major morbidity, therein impacting the hospital stay. OGTT LI and PHRR can help predict postoperative outcome for a given extent of liver resection. (Ann Hepatobiliary Pancreat Surg 2017;21:1-10) Key Words: Oral glucose tolerance test; Volumetry; Postoperative liver failure; Liver resection; Hepatectomy
Received: July 7, 2016; Revised: August 22, 2016; Accepted: September 26, 2016 Corresponding author: Saravanan Manickam Neethirajan
Department of Gastrointestinal Surgery, Govind Ballabh Pant Institute of Postgraduate Medical Education and Research, New Delhi-110002, India
Tel: +91-9999871310, Fax: +91-040-27636882, E-mail: mnsaravanan@rediffmail.com Author contributions: Both the authors contributed equally to this manuscript.
Copyright Ⓒ 2017 by The Korean Association of Hepato-Biliary-Pancreatic Surgery
This is an Open Access article distributed under the terms of the Creative Commons Attribution Non-Commercial License (http://creativecommons.org/
licenses/by-nc/4.0) which permits unrestricted non-commercial use, distribution, and reproduction in any medium, provided the original work is properly cited.
Annals of Hepato-Biliary-Pancreatic Surgery ∙ pISSN: 2508-5778ㆍeISSN: 2508-5859
INTRODUCTION
During the last decade, technical improvements in liver surgery have resulted in an expansion of indications for major liver resections, especially in high-risk patients with various underlying liver conditions (fibrosis, steatosis, or chemotherapy-induced injury). However, the risks of post- operative liver failure (PLF) and fatal outcome have re- mained important concerns.1-3 The reported incidence of PLF ranges between 0.7% and 9.1%.1,2,4-6 Over the years, mortality after liver resection ranged from 0 to 5%, and although multifactorial, PLF seems to be the main cause (18-75%).7-9
Preoperative risk assessment ideally consists of clinical, biochemical, volumetric and functional factors. When
planning a major liver resection, evaluation of the liver remnant volume by computed tomogram (CT) volumetry is important. The most common test for functional evalua- tion is the indocyanine green retention test at 15 minutes (ICG-R15); it is widely used in eastern countries for cir- rhotic patients with hepatocellular carcinoma (HCC) re- quiring liver surgery.10 It accurately assesses the liver function reserve, and an ICG-R15 of 14% is considered as the safety limit for major liver resections.11,12 Various laboratory data, imaging techniques and complex func- tional assessment methods are used to complement the Child-Pugh score to predict PLF and to assess functional hepatic reserve, especially in the high risk group of cir- rhotic patients; however, these have not gained popularity.
We proposed to study the oral glucose tolerance test
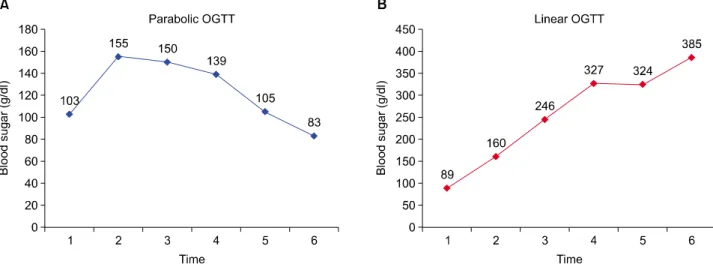
Fig. 1. Representative parabolic (A) and linear (B) oral glucose tolerance test (OGTT) curves.
(OGTT), a simple and easily performed test, for the pre- operative assessment of liver function in liver resection.
Ozawa et al.13 determined glucose tolerance in 14 patients with liver malignancy. They observed that patients with parabolic GTT patterns fared relatively better than those with linear GTT patterns. They had earlier suggested that the parabolic glucose tolerance pattern is indicative of compensated damage to the liver, while the linear glucose tolerance pattern shows critically decreased hepatic func- tional reserve.14 The 3-hour OGTT is preferred over the 2-hour OGTT, as the derivative of glucose concentration is better defined in the third hour of the OGTT, and the rate of glucose appearance is least variable at 120 minutes.15 The present study proposes to evaluate the util- ity of OGTT in addition to CT volumetry, for improving the outcomes of liver resection.
MATERIALS AND METHODS
At our tertiary care hospital, adults (both cirrhotic and non-cirrhotic) who had undergone hepatic resections over a period of 2 years, were studied using a prospective lon- gitudinal cohort study design. The management of liver lesions included in the study was as per the standard pro- tocols of the hepatopancreaticobiliary unit of the hospital.
A standard 3-hour 75-g OGTT was performed as per the 1999 World Health Organization (WHO) specifications.
Blood samples were collected at 0, 30, 60, 90, 120, and 180 minutes for the measurement of plasma glucose.16 The blood sugar curve was classified as having either a
parabolic or linear pattern. A parabolic pattern referred to the blood sugar curve in which the blood sugar value at 2 hours decreased with respect to the preloading value;
otherwise, it was classified as linear (Fig. 1).13 Linearity index (LI) was calculated from the ratio of the 60-minutes blood glucose to the 120-minutes blood glucose level in the peripheral blood after the 75-g OGTT.17 In diabetics, LI was calculated after glycemic control, and the decre- ment between 180-minutes and 120-minutes blood sugar in percentage was measured. In patients showing a linear pattern with no proven diabetes, glycosylated hemoglobin (HbA1C) was measured to exclude undetected diabetes causing glucose intolerance and the resultant linear curve.
The total liver, tumor and future remnant liver were de- lineated on every image, using the portal and hepatic veins as markers for segmental division on CT. Integrated software calculated the volume of the total liver, total tu- mors, and remnant liver volume (RLV) anticipated after surgery. All delineations were made by an experienced radiologist. Tumor volume (TV) was subtracted from total hepatic volume. Total hepatic volume (TLV) was cor- rected for weight and length differences and expressed as ml/BSA. The liver volume to be resected (including tu- mor) was designated as RV. The volume of the future remnant was expressed as a percentage of the total hepatic volume. Parenchymal hepatic resection rate (PHRR) was defined as the proportion of resected liver to the entire liver volume, after excluding the volume of tumor in both.
It was calculated as PHRR=(RV–TV)/(TLV–TV).18 Following were the exclusion criteria for the study: pa-
tients who did not undergo liver resection due to lack of medical fitness, inoperability because of vascular encase- ment, or advanced disease; patients who did not provide informed consent for the study (with no consequences on their clinical care); patients who could not be pre- operatively evaluated by CT volumetry or OGTT; when a linear curve of OGTT coexisted with deranged HbA1C in a previously undetected diabetic, and the linearity of the curve could not be attributed to liver function alone;
any patient who could not be followed up for a minimum period of 90 days after surgery.
The Brisbane 2000 terminology of liver anatomy and resections was used to define the extent and type of liver resection.19 Resections were considered extended when five or more segments were involved (extended right lo- bectomy and extended left hepatectomy), major when three or four segments were involved (right and left hep- atectomy), and minor when one or two segments were re- sected, or a non-anatomical resection was performed.20
Postoperative surveillance included clinical examination during hospitalization and laboratory tests during the first week, including prothrombin time (PT), international nor- malized ratio (INR), total and direct bilirubin, aspartate transaminase (AST), alanine transaminase (ALT) on post- operative day (POD) 1, 3, 5 and 7. Blood analysis after the first week was as per the clinical indications.
Abdominal ultrasound and/or computed tomography were performed in cases where postoperative intra-abdominal fluid collection was suspected.
The primary end points were mortality and post- operative complications. Postoperative mortality was de- fined as any death within 90 days of operation, or during the concurrent hospital stay.
Any deviation from the standard postoperative course other than normal sequelae (inherent to a specific surgical procedure), failure of therapy (goal of treatment not at- tained), or death, were considered as complications. They were classified as major when they resulted in organ failure, required another surgery or radiologic intervention, or re- quired a red blood cell transfusion for postoperative bleeding. These included major postoperative bleeding, any organic failure, intra-abdominal abscess, sepsis and portal vein thrombosis. Other complications with no fatal poten- tial were considered minor, and included pleural effusion, wound infection, urinary tract infection and atelectasis.21
As per the 50-50 criteria, postoperative liver failure is defined at the POD 5, with persistence of either PT
<50% or serum bilirubin (SB) >50 mmol/L on POD 5.
The value 50% of normal for PT corresponds to an INR of 1.7, and SB 50 mmol/L corresponds to 3 mg/dl.3 Secondary end points considered were intraoperative vari- ables such as operative time, blood loss and transfusion requirement. In addition, intensive care unit (ICU) and hospital stay was also recorded.
Liver resection specimens were evaluated for the pres- ence of steatosis using hematoxylin and eosin-stained sections. The degree of total steatosis was graded as mild (10%-30%), moderate (31%-60%), or severe (>60%), based on the percentage of hepatocytes with fat droplets.22 Liver fibrosis was quantified according to the Ishak score as follows - 0: no fibrosis; 1: fibrous expansion of some portal tract areas; 2: fibrous expansion of most portal tract areas; 3: fibrous expansion of portal tract areas with occa- sional portal-portal bridging; 4: fibrosis with portal-portal and portal-central bridging; 5: pronounced bridging with occasional nodules; 6: probable or definite cirrhosis.23
Statistics and ethics
Statistical analysis was performed using the SPSS ver- sion 16.0 (SPSS INC). The mean±standard deviation, me- dian and range of continuous variables, and frequency dis- tributions of categorical variables are presented. Categorical variables were compared using Fisher’s exact test or the chi-square test, and continuous variables were compared us- ing Student’s t-test or Wilcoxon test, as appropriate.
Significant variables (using a cutoff p<0.05) in a univariate analysis were considered for a multivariate analysis.
Analysis of variance test (ANOVA) and/or receiver op- erating characteristic (ROC) curve analysis was performed to identify variables affecting the outcomes of liver resection. Statistical significance was considered at p
<0.05. The study adhered to the tenets of the Declaration of Helsinki, and informed consent was sought from each subject prior to enrollment.
RESULTS
Patient characteristics
Demography: Mean age of the total 33 patients under- going liver resection was 48±15 years, ranging from 21
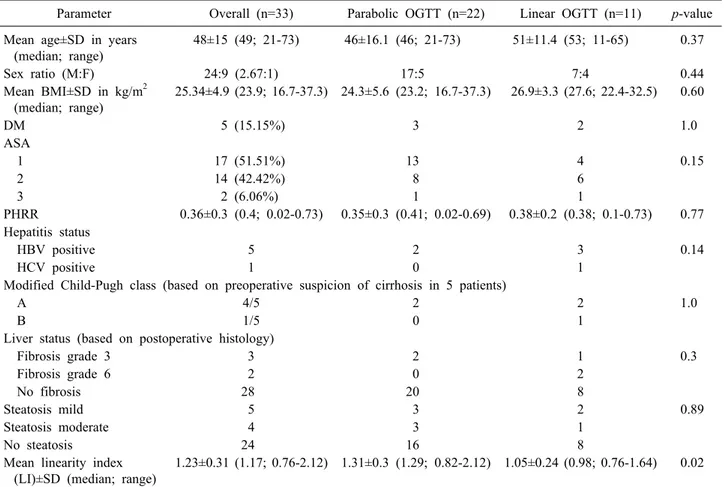
Table 1. Baseline patient characteristics
Parameter Overall (n=33) Parabolic OGTT (n=22) Linear OGTT (n=11) p-value Mean age±SD in years
(median; range)
48±15 (49; 21-73) 46±16.1 (46; 21-73) 51±11.4 (53; 11-65) 0.37
Sex ratio (M:F) 24:9 (2.67:1) 17:5 7:4 0.44
Mean BMI±SD in kg/m2 (median; range)
25.34±4.9 (23.9; 16.7-37.3) 24.3±5.6 (23.2; 16.7-37.3) 26.9±3.3 (27.6; 22.4-32.5) 0.60
DM 5 (15.15%) 3 2 1.0
ASA
1 17 (51.51%) 13 4 0.15
2 14 (42.42%) 8 6
3 2 (6.06%) 1 1
PHRR 0.36±0.3 (0.4; 0.02-0.73) 0.35±0.3 (0.41; 0.02-0.69) 0.38±0.2 (0.38; 0.1-0.73) 0.77 Hepatitis status
HBV positive 5 2 3 0.14
HCV positive 1 0 1
Modified Child-Pugh class (based on preoperative suspicion of cirrhosis in 5 patients)
A 4/5 2 2 1.0
B 1/5 0 1
Liver status (based on postoperative histology)
Fibrosis grade 3 3 2 1 0.3
Fibrosis grade 6 2 0 2
No fibrosis 28 20 8
Steatosis mild 5 3 2 0.89
Steatosis moderate 4 3 1
No steatosis 24 16 8
Mean linearity index (LI)±SD (median; range)
1.23±0.31 (1.17; 0.76-2.12) 1.31±0.3 (1.29; 0.82-2.12) 1.05±0.24 (0.98; 0.76-1.64) 0.02
OGTT, oral glucose tolerance test; BMI, body mass index; DM, diabetes mellitus; ASA, American Society of Anesthesiologists physical status classification; PHRR, parenchymal hepatic resection rate; HBV, hepatitis B virus; HCV, hepatitis C virus
to 73 years (median: 49 years). OGTT was parabolic in 22 (66.7%) patients and linear in 11 (33.3%) patients. The mean LI in those with parabolic curve was 1.31, while in the linear group it was 1.05. Known diabetic cases (5 patients), had good glycemic control prior to their under- going OGTT. HbA1c was normal in all patients with a linear curve. The distribution of age, gender, body mass index, diabetes status, ASA grade, PHRR, viral hepatitis serology status and modified Child-Pugh class strat- ification between the OGTT parabolic and linear groups was comparable (Table 1).
Background liver status: The non-tumor-bearing liver was histologically unremarkable in 21 patients (63.64%).
Of the 5 patients with evidence of cirrhosis on pre- operative workup, subsequent histopathology confirmed grade 6 fibrosis in 2 cases, and grade 3 fibrosis in 3 patients. Preoperative workup or subsequent histology did not reveal any evidence of cirrhosis in 1 patient with hep- atitis B.
Steatosis was evident in the histopathology of 9 patients. Both steatosis and fibrosis were positive in 2 patients. Stratification based on fibrosis grade and stea- tosis was comparable between the OGTT parabolic and linear groups.
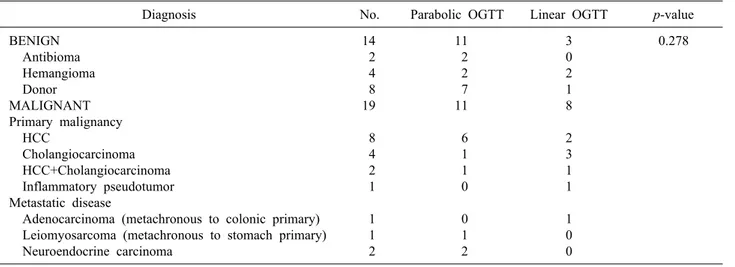
Indication: HCC was the leading indication for liver re- section in our study, attributing to 30.3% of all cases.
Nineteen (57.6%) patients underwent resection for malig- nant pathology. Liver resection as a part of meta- statectomy were all metachronous. No statistically sig- nificant difference was noted in the distribution of in- dications between the two OGTT groups (Table 2).
Major liver resections were carried out in 23 (69.7%) patients. The average duration of surgery was 6.3±2.1 hours. The types of resections and additional associated procedures, as well as the operative parameters (including duration of surgery and blood loss) did not differ between the two OGTT groups (Table 3).
Table 2. Indications of liver resection
Diagnosis No. Parabolic OGTT Linear OGTT p-value
BENIGN Antibioma Hemangioma Donor MALIGNANT Primary malignancy HCC
Cholangiocarcinoma HCC+Cholangiocarcinoma Inflammatory pseudotumor Metastatic disease
Adenocarcinoma (metachronous to colonic primary) Leiomyosarcoma (metachronous to stomach primary) Neuroendocrine carcinoma
14 2 4 8 19 8 4 2 1 1 1 2
11 2 2 7 11 6 1 1 0 0 1 2
3 0 2 1 8 2 3 1 1 1 0 0
0.278
OGTT, oral glucose tolerance test; HCC, hepatocellular carcinoma
Table 3. Extent of liver resection and intraoperative variables
Operative procedure No. Parabolic OGTT Linear OGTT p-value
Major
Right hemihepatectomy Extended right hepatectomy Left hemihepatectomy Extended left hepatectomy Minor
Left lateral sectionectomy Right posterior sectionectomy Bisegmentectomy
Monosegementectomy/non-anatomical wedge Mean duration of surgery±SD in hours (median; range) Mean blood loss±SD in ml (median; range) Pringle’s maneuver used
Additional procedure
Diaphragmatic cuff resection Partial resection of Gerota's fascia Appendectomy
Ovarian cystectomy
23 18 1 2 2 10 4 2 2 2 6.3±2.1 (6; 2-11)
907.6±656.1 (800; 150-3500)
12 5 3 1 1 1
17 14 0 2 1 5 2 0 1 2 5.9±1.8 (6; 2-8.5)
884.1±749.3 (775; 150-3500)
7 3 2 1 0 0
6 4 1 0 1 5 2 2 1 0 6.9±2.5 (7; 3-11)
954.6±441.2 (1000; 400-1800)
5 2 1 0 1 1
0.24
0.196 0.776 0.471 1.0
OGTT, oral glucose tolerance test
Postoperative outcomes
There was no mortality either during the hospital stay or within 90 days after surgery. Overall morbidity was ob- served in 24 (72.7%) patients; however, major complica- tions occurred in only 3 (9.1%) patients.
Two patients had bile leak, of which one was self-limit- ing, while the other needed percutaneous drainage. One patient was re-explored for primary hemorrhage. Overall morbidity and major morbidity was higher in the linear OGTT group (90.9% and 18.2%, respectively) compared to the parabolic group (63.6% and 4.6%, respectively), but
it did not reach statistical significance (Table 4).
OGTT curve correlated with the overall hospital stay;
this association was statistically significance (p=0.04).
Only 3 (9.1%) patients met the 50-50 criteria used to de- fine PLF. The patients with a linear OGTT curve met 50-50 criteria more often (18.2% vs 4.5% in parabolic), but did not reach statistical significance (p=0.25).
To determine factors affecting outcomes of liver re- section (overall morbidity, major morbidity and PLF by 50-50 criteria), none of the demographic, perioperative (including steatosis or fibrosis in background liver) or
Table 4. Postoperative outcomes
Parameter Parabolic OGTT
(n=22)
Linear OGTT
(n=11) p-value
Mortality Morbidity Overall (%) Major (%)
PLF by 50-50 criteria Intra-abdominal collection Bile leak
Percutaneous intervention No intervention
Hemorrhage Re-exploration
Mean hospital stay±SD in days (median; range) Mean ICU stay±SD in days (median; range)
0
24 (72.72%) 3 (9.09%)
3 1 2 1 1 1 1
10.4±3.5 (10; 7-25) 2.9±1.3 (3; 1-6 )
0
14 (63.6%) 1 (4.6%) 1 (4.6%)
0 1 0 1 1 1 9.6±1.9 (9; 7-15) 2.6±1.3 (2; 1-5)
0
10 (90.9%) 2 (18.2%) 2 (18.2%)
1 1 1 0 0 0
12.1±5.1 (11; 7-25) 3.5±1.3 (3; 2-6)
-
0.212 0.252 0.252
0.048 0.070 OGTT, oral glucose tolerance test; PLF, postoperative liver failure; ICU, intensive care unit
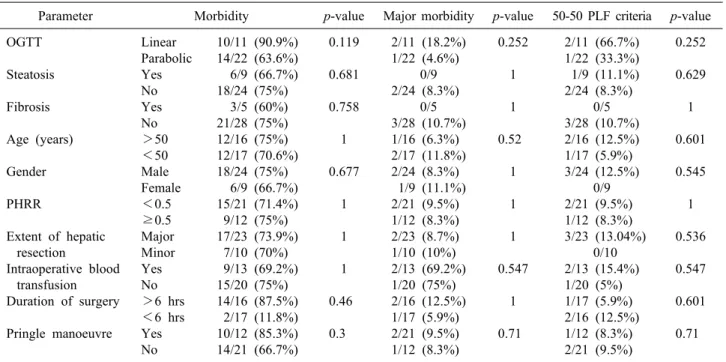
Table 5. Univariate analysis of factors affecting overall morbidity, major morbidity and PLF by 50-50 criteria
Parameter Morbidity p-value Major morbidity p-value 50-50 PLF criteria p-value OGTT
Steatosis Fibrosis
Age (years) Gender
PHRR
Extent of hepatic resection
Intraoperative blood transfusion Duration of surgery Pringle manoeuvre
Linear Parabolic Yes No Yes No
>50
<50 Male Female
<0.5
≥0.5 Major Minor Yes No
>6 hrs
<6 hrs Yes No
10/11 (90.9%) 14/22 (63.6%) 6/9 (66.7%) 18/24 (75%)
3/5 (60%) 21/28 (75%) 12/16 (75%) 12/17 (70.6%) 18/24 (75%) 6/9 (66.7%) 15/21 (71.4%) 9/12 (75%) 17/23 (73.9%)
7/10 (70%) 9/13 (69.2%) 15/20 (75%) 14/16 (87.5%) 2/17 (11.8%) 10/12 (85.3%) 14/21 (66.7%)
0.119 0.681 0.758
1 0.677
1 1 1
0.46 0.3
2/11 (18.2%) 1/22 (4.6%)
0/9 2/24 (8.3%)
0/5 3/28 (10.7%) 1/16 (6.3%) 2/17 (11.8%) 2/24 (8.3%) 1/9 (11.1%) 2/21 (9.5%) 1/12 (8.3%) 2/23 (8.7%) 1/10 (10%) 2/13 (69.2%) 1/20 (75%) 2/16 (12.5%) 1/17 (5.9%) 2/21 (9.5%) 1/12 (8.3%)
0.252 1 1
0.52 1
1 1 0.547
1 0.71
2/11 (66.7%) 1/22 (33.3%) 1/9 (11.1%) 2/24 (8.3%)
0/5 3/28 (10.7%) 2/16 (12.5%) 1/17 (5.9%) 3/24 (12.5%)
0/9 2/21 (9.5%) 1/12 (8.3%) 3/23 (13.04%)
0/10 2/13 (15.4%) 1/20 (5%) 1/17 (5.9%) 2/16 (12.5%) 1/12 (8.3%) 2/21 (9.5%)
0.252 0.629 1
0.601 0.545
1 0.536 0.547
0.601 0.71
PLF, postoperative liver failure; OGTT, oral glucose tolerance test; PHRR, parenchymal hepatic resection rate
Table 6. Frequency of linear oral glucose tolerance test (OGTT) and linearity index (LI) according to outcomes
Parameter Morbidity Major morbidity 50-50 Postoperative liver
failure criteria Present (24) Absent (9) Present (3) Absent (30) Present (3) Absent (30) Frequency of
linear OGTT (%) p-value
Mean LI±SD (median; range) p-value
10 (41.7%)
0.212 1.26±0.34 (1.2; 0.76-2.12)
0.37
1 (11.1%)
1.15±0.18 (1.17; 0.82-1.43)
2 (66.7%)
0.252 0.99±0.27 (0.91; 0.76-1.29)
0.16
9 (30%)
1.25±0.3 (1.2; 0.82-2.12)
2 (66.7%)
0.252 0.91±0.03 (0.91; 0.88-0.94)
0.06
9 (30%)
1.26±0.3 (1.24; 0.76-2.12)
volumetric parameters were found to significantly affect outcomes on univariate analysis (Table 5); hence, a multi- variate analysis was not necessitated.
The OGTT was more often linear in presence of mor- bidity (41.7% vs 11.1%), major morbidity (66.7% vs 30%) and PLF by 50-50 criteria (66.7% vs 30%), but did not reach statistical significance. While the linearity index was comparable in the presence or absence of overall morbidity, it was insignificantly lower in presence of ma- jor morbidity (0.9 vs 1.2) and PLF by 50-50 criteria (0.9 vs 1.2). These linearity indices did not differ statistically (Table 6).
DISCUSSION
Recent advances in hepatic surgery and perioperative care, and refinements in patient-selection criteria and in- dications, have enabled an increasing number of patients to undergo liver resections. The past decade has seen re- duced mortality after hepatic resection to less than 5%, and although the cause of death after hepatic resection is multifactorial, PLF seems to be the main cause.8 A great number of hepatic resection have been mainly reported from the Western countries and the Far East. Besides, a North Indian single-center study analyzed 241 consecutive cases of hepatic resections to define the risk factors asso- ciated with postoperative morbidity and mortality. Very few studies have been reported from South Asia.24 Further, the studies on objective preoperative quantitative and qualitative functional assessment prior to liver re- section, have rarely been reported from the Indian subcontinent.
Among the various tests for functional evaluation, ICG-R15 is widely used in the Eastern countries for cir- rhotic patients with HCC requiring liver surgery.10 It is considered to be accurate for assessment of liver function reserve in cirrhotic patients undergoing hepatectomy.12 However, there is a known risk of complications reported due to anaphylactoid reactions, including death.25-27 The results of ICG-R15 depend on the hepatic blood flow, and regional variations can alter the retention value.28 Also, acute cholestasis directly influences the ICG test and should be taken into account while interpreting the ICG test in jaundiced patients.29
A close association exists between glucose intolerance
and the decrease in hepatic energy charge and the de- rangement of mitochondrial function.30-34 This formed the basis for utilizing OGTT in preoperative assessment for liver resection. The linear index of OGTT is related to the mitochondrial activity of the hepatocytes. Especially in cirrhosis, shunting occurs in portal vein blood, reducing the blood supply to the liver parenchyma, leading to in- sulin resistance and a lowered glucose tolerance.16,35,36 In clinical application, the assessment of hepatic functional reserve by oral glucose tolerance test was shown to pro- vide a predictive postoperative prognosis in post hep- atectomy patients.13 In the study by Yamanaka et al.,37 the oral glucose tolerance test pattern was linear in 80% of the non-survivors compared with 20% of the survivors, in patients who underwent liver resection for HCC and meta- static tumor (p<0.05). Linear OGTT was found to be one of the 4 variables that significantly affect mortality, fol- lowing resection for biliary malignancies. These variables, along with liver resection rate, were used to validate a dis- criminant formula to predict postoperative liver failure.38 More recently, OGTT LI was incorporated with 5 other parameters to construct a complex score for preoperative functional evaluation for resection in HCC.16
In our study, we observed a statistically significant cor- relation of the type of OGTT curve with the overall hospi- tal stay. In patients who experienced overall morbidity and major morbidity, the OGTT was linear in 42%
(10/24) and 67% (2/3) respectively, compared to 13%
(1/8) in the absence of morbidity. Patients with linear GTT met the 50-50 criteria of POLF more often (18%) than those with a parabolic curve (4.5%), but this differ- ence was statistically not significant. The linearity index was marginally lower in patients with major morbidity and POLF by 50-50 criteria. A larger sample size powered adequately in a prospective cohort study, can highlight the difference between linear and parabolic OGTT groups, if any.
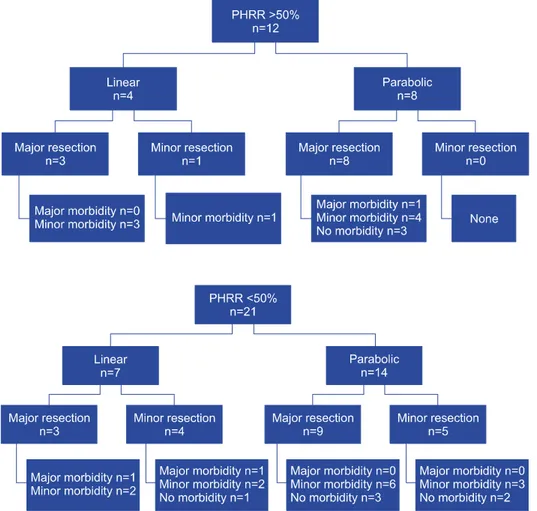
The main preoperative factors affecting outcomes in- clude the presence of impaired preoperative liver function, extent of liver resection, and the presence of a small rem- nant liver.3 To analyze OGTT along with volumetric eval- uation by PHRR, we subcategorized the study group into four subgroups: 1) PHRR >50% with a. Linear OGTT and b. Parabolic OGTT; 2) PHRR <50% with a. Linear OGTT and b. Parabolic OGTT (Figs. 2 and 3). None of
Fig. 2. Outcomes in group with parenchymal hepatic resection rate (PHRR) >50%.
Fig. 3. Outcomes in group with parenchymal hepatic resection rate (PHRR) <50%.
the patients with a parabolic OGTT and PHRR less than 0.5 experienced any major morbidity. Minor morbidity was observed in all patients with a linear OGTT and a PHRR greater than 0.5, who underwent resections.
Caution may need to be exercised when considering a ma- jor resection in a patient with linear OGTT and PHRR
>50%.
OGTT was found to be an efficient tool for the prog- nosis of cirrhotic patients.39,40 It was found to be effective in our study group which was predominantly non-cir- rhotic, and its predictive value may improve in a cohort of predominant cirrhotic resections, wherein the concern of PLF is greater and the resections are more challenging.
However, in view of the small sample size, our study stands underpowered to detect factors affecting mortality, morbidity and severe postoperative liver insufficiency. We did not perform a direct comparison of OGTT and ICGR 15. While it may be argued that OGTT did not fare well in predicting the 50-50 criteria for liver failure, this may not be the failure of OGTT, but the fallacy of the 50-50
criteria. The 50-50 criteria were developed in a rather het- erogeneous cohort rather than a predominantly non-cir- rhotic group like ours. It was defined based on fatal liver failure, while none of our patients experienced mortality.
However, on applying the International Study Group of Liver Surgery (ISGLS) definition of liver failure, the grades did not differ significantly between parabolic and linear OGTT (data not shown). In addition to its efficacy in predicting outcomes, OGTT is advantageous due to its simplicity, standard technique, easy interpretation and low cost.15
In conclusion, our study paves the way for designing a prospective study to assess OGTT, compared to a vali- dated preoperative method like ICGR 15, in future. OGTT is a relatively cheap, safe, simple and effective test, hav- ing the potential to substitute ICGR 15 and predict out- comes reliably. In a larger cohort with utilization of ap- propriate statistical tools, it should be possible to in- corporate OGTT LI and PHRR into a simplified formula with a relevant cutoff, to help guide the extent of re-
section and anticipate postoperative liver insufficiency and morbidity, and to consider preoperative augmentation or for early postoperative prophylactic and therapeutic measures.
ACKNOWLEDGEMENTS
Sridhar Chappidi MD (Consultant Radiologist, Global hospital) for volumetric analysis. The statistical methods of this study were reviewed by Praveen K Nirmalan MD MPH (Prashasa Health Consultants) who specializes in public health. This work was carried out in HPB & Liver Transplant unit, Global Hospital, Hyderabad, India during the tenure of the authors there.
REFERENCES
1. Jarnagin WR, Gonen M, Fong Y, DeMatteo RP, Ben-Porat L, Little S, et al. Improvement in perioperative outcome after hep- atic resection: analysis of 1,803 consecutive cases over the past decade. Ann Surg 2002;236:397-406; discussion 406-407.
2. Imamura H, Seyama Y, Kokudo N, Maema A, Sugawara Y, Sano K, et al. One thousand fifty-six hepatectomies without mor- tality in 8 years. Arch Surg 2003;138:1198-1206.
3. Balzan S, Belghiti J, Farges O, Ogata S, Sauvanet A, Delefosse D, et al. The "50-50 criteria" on postoperative day 5: an accurate predictor of liver failure and death after hepatectomy. Ann Surg 2005;242:824-828, discussion 828-829.
4. Shoup M, Gonen M, D'Angelica M, Jarnagin WR, DeMatteo RP, Schwartz LH, et al. Volumetric analysis predicts hepatic dys- function in patients undergoing major liver resection. J Gastrointest Surg 2003;7:325-330.
5. Schindl MJ, Redhead DN, Fearon KC, Garden OJ, Wigmore SJ;
Edinburgh Liver Surgery and Transplantation Experimental Research Group (eLISTER). The value of residual liver volume as a predictor of hepatic dysfunction and infection after major liver resection. Gut 2005;54:289-296.
6. Poon RT, Fan ST, Lo CM, Liu CL, Lam CM, Yuen WK, et al. Improving perioperative outcome expands the role of hep- atectomy in management of benign and malignant hepatobiliary diseases: analysis of 1222 consecutive patients from a pro- spective database. Ann Surg 2004;240:698-708; discussion 708-710.
7. Detroz B, Sugarbaker PH, Knol JA, Petrelli N, Hughes KS.
Causes of death in patients undergoing liver surgery. Cancer Treat Res 1994;69:241-257.
8. Bolder U, Brune A, Schmidt S, Tacke J, Jauch KW, Löhlein D.
Preoperative assessment of mortality risk in hepatic resection by clinical variables: a multivariate analysis. Liver Transpl Surg 1999;5:227-237.
9. Simmonds PC, Primrose JN, Colquitt JL, Garden OJ, Poston GJ, Rees M. Surgical resection of hepatic metastases from colorectal cancer: a systematic review of published studies. Br J Cancer 2006;94:982-999.
10. McCormack L, Capitanich P, Quiñonez E. Liver surgery in the presence of cirrhosis or steatosis: Is morbidity increased? Patient Saf Surg 2008;2:8.
11. Nonami T, Nakao A, Kurokawa T, Inagaki H, Matsushita Y, Sakamoto J, et al. Blood loss and ICG clearance as best prognostic markers of post-hepatectomy liver failure. Hepatogastroenterology 1999;46:1669-1672.
12. Fan ST. Methods and related drawbacks in the estimation of sur- gical risks in cirrhotic patients undergoing hepatectomy. Hepato- gastroenterology 2002;49:17-20.
13. Ozawa K, Ida T, Yamada T, Honjo I. Significance of glucose tolerance as prognostic sign in hepatectomized patients. Am J Surg 1976;131:541-546.
14. Ozawa K, Ida T, Yamada T, Yamaoka Y, Takasan H. Oral glu- cose tolerance in patients with jaundice. Surg Gynecol Obstet 1975;140:582-588.
15. Mari A, Pacini G, Murphy E, Ludvik B, Nolan JJ. A mod- el-based method for assessing insulin sensitivity from the oral glucose tolerance test. Diabetes Care 2001;24:539-548.
16. Nolan JJ, Ludvik B, Baloga J, Reichart D, Olefsky JM.
Mechanisms of the kinetic defect in insulin action in obesity and NIDDM. Diabetes 1997;46:994-1000.
17. Uchiyama K, Mori K, Tabuse K, Ueno M, Ozawa S, Nakase T, et al. Assessment of liver function for successful hepatectomy in patients with hepatocellular carcinoma with impaired hepatic function. J Hepatobiliary Pancreat Surg 2008;15:596-602.
18. Okamoto E, Kyo A, Yamanaka N, Tanaka N, Kuwata K.
Prediction of the safe limits of hepatectomy by combined volu- metric and functional measurements in patients with impaired hepatic function. Surgery 1984;95:586-592.
19. Strasberg SM. Nomenclature of hepatic anatomy and resections:
a review of the Brisbane 2000 system. J Hepatobiliary Pancreat Surg 2005;12:351-355.
20. Maeda Y, Nishida M, Takao T, Mori N, Tamesa T, Tangoku A, et al. Risk factors for postoperative liver failure after hep- atectomy for hepatocellular carcinoma. Hepatogastroenterology 2004;51:1792-1796.
21. Belghiti J, Hiramatsu K, Benoist S, Massault P, Sauvanet A, Farges O. Seven hundred forty-seven hepatectomies in the 1990s: an update to evaluate the actual risk of liver resection.
J Am Coll Surg 2000;191:38-46.
22. Hwang SJ, Luo JC, Chu CW, Lai CR, Lu CL, Tsay SH, et al.
Hepatic steatosis in chronic hepatitis C virus infection: preva- lence and clinical correlation. J Gastroenterol Hepatol 2001;16:
190-195.
23. Ishak K, Baptista A, Bianchi L, Callea F, De Groote J, Gudat F, et al. Histological grading and staging of chronic hepatitis.
J Hepatol 1995;22:696-699.
24. Marwah S, Khan MM, Chaudhary A, Gupta S, Negi SS, Soin A, et al. Two hundred and forty-one consecutive liver resections:
an experience from India. HPB (Oxford) 2007;9:29-36.
25. Garski TR, Staller BJ, Hepner G, Banka VS, Finney RA Jr.
Adverse reactions after administration of indocyanine green.
JAMA 1978;240:635.
26. Speich R, Saesseli B, Hoffmann U, Neftel KA, Reichen J.
Anaphylactoid reactions after indocyanine-green administration.
Ann Intern Med 1988;109:345-346.
27. Benya R, Quintana J, Brundage B. Adverse reactions to in- docyanine green: a case report and a review of the literature.
Cathet Cardiovasc Diagn 1989;17:231-233.
28. Schneider PD. Preoperative assessment of liver function. Surg Clin North Am 2004;84:355-373.
29. Stockmann M, Malinowski M, Lock JF, Seehofer D, Neuhaus P. Factors influencing the indocyanine green (ICG) test: addi- tional impact of acute cholestasis. Hepatogastroenterology 2009;
56:734-738.
30. Irie R, Kono Y, Aoyama H, Nakatani T, Yasuda K, Ozawa K,
et al. Impaired glucose tolerance related to changes in the energy metabolism of the remnant liver after major hepatic resection.
J Lab Clin Med 1983;101:692-698.
31. Nakatani T, Yasuda K, Ozawa K, Tobe T. Changes in blood glu- cose levels in relation to blood ketone body ratio following hy- pertonic glucose infusion in 70% hepatectomized rabbits. Eur Surg Res 1984;16:303-311.
32. Yasuda K, Nakatani T, Ozawa K. Glucose intolerance and amino acid imbalance in relation to changes in blood ketone body ratio in hepatectomized rabbits. Eur Surg Res 1986;18:19-27.
33. Uchida K, Jikko A, Yamato T, Kamiyama Y, Ozawa K.
Relationship of glucose intolerance and indocyanine green clear- ance to respiratory enzyme levels in human cirrhotic liver. Am J Med Sci 1985;290:19-27.
34. Mori K, Ozawa K, Yamamoto Y, Maki A, Shimahara Y, Kobayashi N, et al. Response of hepatic mitochondrial redox state to oral glucose load. Redox tolerance test as a new predictor of surgical risk in hepatectomy. Ann Surg 1990;211:438-446.
35. Sasaya S, Yagi H, Yamaguchi M, Kigawa G, Nakano H, Midorikawa T, et al. Liver function assessed by increased rate of portal venous blood flow after oral intake of glucose. Eur J
Surg 2000;166:112-118.
36. Huo TI, Lui WY, Huang YH, Chau GY, Wu JC, Lee PC, et al. Diabetes mellitus is a risk factor for hepatic decompensation in patients with hepatocellular carcinoma undergoing resection:
a longitudinal study. Am J Gastroenterol 2003;98:2293-2298.
37. Yamanaka N, Okamoto E, Oriyama T, Fujimoto J, Furukawa K, Kawamura E, et al. A prediction scoring system to select the surgical treatment of liver cancer. Further refinement based on 10 years of use. Ann Surg 1994;219:342-346.
38. Nagino M, Nimura Y, Hayakawa N, Kamiya J, Kondo S, Sasaki R, et al. Logistic regression and discriminant analyses of hepatic failure after liver resection for carcinoma of the biliary tract.
World J Surg 1993;17:250-255.
39. Nishida T, Tsuji S, Tsujii M, Arimitsu S, Haruna Y, Imano E, et al. Oral glucose tolerance test predicts prognosis of patients with liver cirrhosis. Am J Gastroenterol 2006;101:70-75.
40. Wen T, Zheng G, Meng X, Chen L. Evaluation of oral glucose tolerance test in the assessment of reserved function of liver for patients with hepatocellular carcinoma. Hua Xi Yi Ke Da Xue Xue Bao 1997;28:197-200.