Printed in the Republic of Korea
http://dx.doi.org/10.5012/jkcs.2014.58.3.258
Crystal Growth, Spectral, Magnetic, Antibacterial and Antifungal Studies of Co(II) and Ni(II) Complexes of 4-Nitrobenzoic Acid
Sunalya M. Roy, M. R. Sudarsanakumar*, V. S. Dhanya, S. Suma†, and M. R. Prathapachandra Kurup‡ Department of Chemistry, Mahatma Gandhi College, Thiruvananthapuram 695 004, Kerala, India
*E-mail: [email protected]
†Department of Chemistry, Sree Narayana College, Chempazhanthy, Thiruvananthapuram 695 587, Kerala, India
‡Department of Applied Chemistry, Cochin University of Science and Technology, Kochi 682 022, Kerala, India (Received January 14, 2014; Accepted March 12, 2014)
ABSTRACT: Single crystals of cobalt(II) and nickel(II) complexes of 4-nitrobenzoic acid have been successfully grown by gel diffusion technique. The grown crystals were characterized by elemental analysis, FT-IR and UV-Visible spectroscopy. The structure of the grown crystals was elucidated using single crystal X-ray diffraction studies. The title compounds [Co(Pnba)2(H2O)4]·
2H2O 1 and [Ni(Pnba)2(H2O)4]·2H2O 2 where PnbaH=4-nitrobenzoic acid, crystallize in centrosymmetric triclinic space group P-1.
Magnetic susceptibility measurements reveal that the compounds are paramagnetic in nature. The mechanical strength of the grown crystals was determined by Vicker’s microhardness studies. The ligand (4-nitrobenzoic acid) and the complexes have been screened for their biological activity against various bacteria and fungi. The activity data show that the biological activity of the complexes is higher than that of the ligand.
Key words: Gel diffusion, X-ray diffraction, IR spectra, Microhardness, Biological activity INTRODUCTION
Metal carboxylates play an important role in inorganic and bioinorganic chemistry. The fascinating structural fea- tures of metal carboxylates can be attributed to the ver- satile ligational behaviour of the carboxylate group which can function as a monodentate or bidentate or bridging type of ligand.1−3 The study of coordination complexes have gained importance during the recent years especially due to the slow release or long acting drugs in nutrition and in the study of metabolism.4 Transition metal aromatic carboxylates have shown promising results when screened against several pathogenic bacteria and fungi.5−7 There- fore the transition metal complexes were studied for their antibacterial and antifungal activity. Moreover cobalt and copper ions have been used to inhibit the growth of harm- ful microbes for centuries. 4-Nitrobenzoic acid is used as a raw material for the synthesis of benzocaine, folic acid and benzoyl glutamic acid. Eventhough the crystal struc- ture of the title compounds have been reported earlier,8−10 we have grown the crystals by a different method. The compounds crystallize in a triclinic space group P-1. The grown crystals are characterized by elemental analysis, FT-IR spectroscopy and UV-Visible spectroscopy. Powder X-ray diffraction study was conducted to confirm the crystalline nature of the compound. Magnetic susceptibility measurement of the complexes was also carried out. The mechanical
strength of the compounds was determined by Vicker’s microhardness studies. The antibacterial and antifungal activity of the compounds was studied using agar-well dif- fusion method.
EXPERIMENTAL PROCEDURE Growth Procedure
All commercial reagents were of analytical grade and used without further purification. Single crystals of the title compounds were grown by single gel diffusion technique.
Sodium metasilicate (Na2SiO3·9H2O) was used to prepare the gel. The apparatus for crystallization consists of boro- silicate glass tubes of length 20 cm and diameter 2.5 cm.
The gel was prepared by mixing 4-nitrobenzoic acid in sodium metasilicate solution of varying density (1.03− 1.05 gcm−3) with continuous stirring to avoid local ion concentration which may cause premature local gelling and make the final solution inhomogeneous.11 The pH of the gel was adjusted using glacial acetic acid. The gel solutions of different pH ranging from 5.5 to 7 were trans- ferred to several glass tubes. These glass tubes were well sealed to eliminate surface contamination. Sufficient time was given to the gel to set. Once gelled, an aqueous solu- tion of metal solution was poured along the walls of the tubes without tampering the meniscus of the gel, so that the ligand to metal stochiometry is 2:1. The open end of
the test tubes was again covered to avoid evaporation of the solution and contamination.
Characterization
The carbon, nitrogen and hydrogen contents in the obtained crystals were determined using Elementar Vario-EL 111 CHNS analyzer. Single crystal XRD analysis of the crys- tals was carried out using a Bruker AXS Kappa Apex2 CCD diffractometer, with graphite monochromated Mo Kα (λ=0.71073Å) radiation. The powder X-ray diffrac- tion experiment was carried out in a Bruker AXS D8 advance X-ray powder diffractometer using Cu Kα radiation (λ=
1.54056Å). The FT-IR spectra were recorded in the range 4000−400 cm−1 using Thermo Nicolet, Avatar 370 spec- trometer in KBr pellets. UV-Visible absorption spectrum was recorded using Varian Cary 5000 UV-Vis-NIR spec- trometer in the range 200−1200 nm. Magnetic measure- ments were carried out on a Sherwood Scientific MK1 magnetic balance using Gouy method. Vicker’s microhardness measure- ments were taken using Shimadzu HMV-2TAW micro- hardness tester, fitted with a diamond indenter.
Antimicrobial Activity
The ligand and the title compounds were screened against three Gram positive (Staphylococcus aureus, Bacillus sub- tilis and Klebsiella pneumonia) and two Gram negative (Escherichia coli and Streptococcus mutans) bacteria using agar-well diffusion method. The activity of the com- pounds was found out by measuring the diameter of the zone of inhibition in millimeters. In vitro antibacterial activity of the ligands and compounds has been evaluated and compared with the standard antibiotic, Gentamycin.
The Muller Hinton agar and the nutrient broth were pre- pared and poured in the petriplates and allowed to cool.
These petriplates were seeded with the tested bacterial strains such as Staphylococcus aureus, Bacillus subtilis, Streptococcus mutans, Klebsiella pneumoniae and Escherichia coli. After seeding, wells of approximately 10 mm was bored using a well cutter and different concentrations (25, 50,100 µg/ml) of the investigated compounds were added.
The plates were incubated at 37oC for 24 hours. The diameter of the zone of inhibition was measured in millimeters after overnight incubation.
Antifungal Activity
The antifungal activity of the ligand and the complexes has been investigated by agar-well diffusion method. Aspergil- lus niger and Candida albicans were employed for testing the antifungal activity of both ligand and the complexes.
Muller Hinton agar was prepared and overnight grown fungi were swabbed. Wells of approximately 10 mm was bored using a well cutter and samples of different con- centrations (50, 100 µg/ml) was added. After the completion of overnight incubation, the diameter of the zone of inhibi- tion was measured in millimeters and compared with the standard antibiotic, Clotrimazole.
RESULTS AND DISCUSSION Crystal Growth
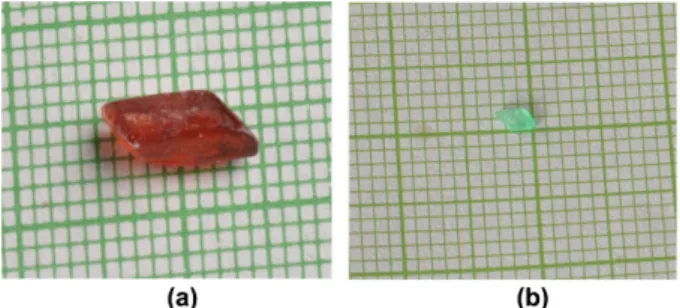
Block shaped transparent crystals of the title compounds were grown by single gel diffusion technique as described above. Crystals suitable for single crystal X-ray diffraction appeared at the gel interface within two weeks, under the conditions of gel density 1.05 gcm−3 and pH 6.5. This was the optimum condition for growth of the crystals. The photo- graphs of the as grown crystals are shown in Figs. 1a and 1b.
Elemental Analysis
The chemical composition of the compounds was deter- mined by elemental analysis. In compound 1, the experimen- tal and calculated percentages of carbon, nitrogen and hydrogen are %C=34.77 (calc.=34.79), %N=3.89 (calc.=3.72) and %H=5.65 (calc. 5.79) and in compound 2, they are
%C=33.65 (calc.=33.55), %H=4.72 (calc.=3.99) and %N=5.64 (calc.=5.59). The experimental and calculated values are in good agreement with each other within the acceptable limits. The calculated values agree with the formulae [M(Pnba)2(H2O)4]·2H2O where M=Co(II) and Ni(II).
Powder X-ray Diffraction Studies
To confirm the crystalline nature of the title compounds, powder X-ray diffraction studies were carried out and the crystalline nature of the grown crystals has been revealed from the well defined Bragg’s peaks at the specific 2θ angles. The experimental powder X-ray diffraction pat- terns was compared with the X-ray diffraction patterns
Figure 1. (a) Photograph of the grown crystal of compound 1.
(b) Photograph of the grown crystal of compound 2.
obtained from the single crystal XRD data using Mercury software in order to check the phase purity of the com- pounds. The peaks observed at specific 2θ angles in the experimental powder X-ray diffractograms are in good agreement with the simulated XRD patterns obtained from
single crystal XRD data which indicates that the compounds possess bulk phase purity.12 The simulated and experi- mental powder X-ray diffraction patterns of compounds 1 and 2 are shown in Figs. 2a and 2b.
Figure 2. (a) Powder X-ray diffraction patterns (experimental and simulated) of 1. (b) Powder X-ray diffraction patterns (experimental and simulated) of 2.
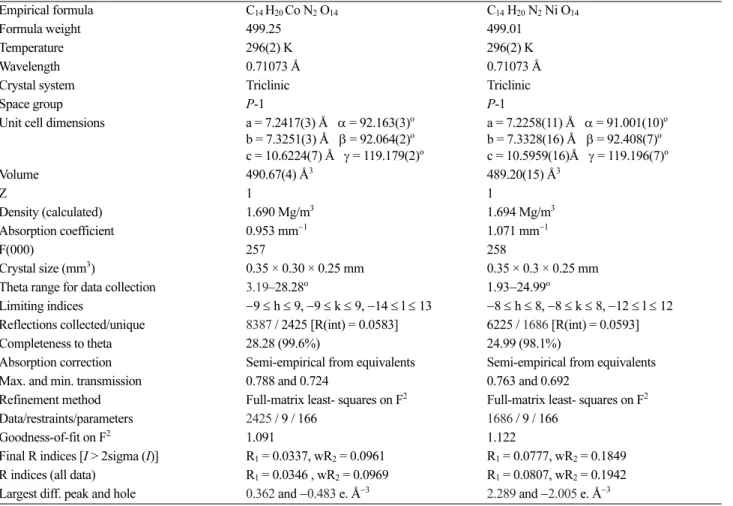
Table 1. Crystal refinement parameters for compounds 1 and 2
Empirical formula C14 H20 Co N2 O14 C14 H20 N2 Ni O14
Formula weight 499.25 499.01
Temperature 296(2) K 296(2) K
Wavelength 0.71073 Å 0.71073 Å
Crystal system Triclinic Triclinic
Space group P-1 P-1
Unit cell dimensions a = 7.2417(3) Å α = 92.163(3)o b = 7.3251(3) Å β = 92.064(2)o c = 10.6224(7) Å γ = 119.179(2)o
a = 7.2258(11) Å α = 91.001(10)o b = 7.3328(16) Å β = 92.408(7)o c = 10.5959(16)Å γ = 119.196(7)o
Volume 490.67(4) Å3 489.20(15) Å3
Z 1 1
Density (calculated) 1.690 Mg/m3 1.694 Mg/m3
Absorption coefficient 0.953 mm−1 1.071 mm−1
F(000) 257 258
Crystal size (mm3) 0.35 × 0.30 × 0.25 mm 0.35 × 0.3 × 0.25 mm
Theta range for data collection 3.19–28.28o 1.93−24.99o
Limiting indices −9 ≤ h ≤ 9, −9 ≤ k ≤ 9, −14 ≤ l ≤ 13 −8 ≤ h ≤ 8, −8 ≤ k ≤ 8, −12 ≤ l ≤ 12 Reflections collected/unique 8387 / 2425 [R(int) = 0.0583] 6225 / 1686 [R(int) = 0.0593]
Completeness to theta 28.28 (99.6%) 24.99 (98.1%)
Absorption correction Semi-empirical from equivalents Semi-empirical from equivalents
Max. and min. transmission 0.788 and 0.724 0.763 and 0.692
Refinement method Full-matrix least- squares on F2 Full-matrix least- squares on F2
Data/restraints/parameters 2425 / 9 / 166 1686 / 9 / 166
Goodness-of-fit on F2 1.091 1.122
Final R indices [I > 2sigma (I)] R1 = 0.0337, wR2 = 0.0961 R1 = 0.0777, wR2 = 0.1849 R indices (all data) R1 = 0.0346 , wR2 = 0.0969 R1 = 0.0807, wR2 = 0.1942 Largest diff. peak and hole 0.362 and −0.483 e. Å−3 2.289 and −2.005 e. Å−3
X-ray Crystallography
The single crystal X-ray diffraction data of the compounds were collected using a Bruker AXS Kappa Apex2 CCD diffractometer, with graphite monochromated Mo Kα (λ=0.71073Å) radiation. The unit cell dimensions and inten- sity data were recorded at 296 K. The structures was solved with direct methods using SIR9213 and refinement was carried out by full-matrix least squares on F2 using SHELXL- 97.14 All non-hydrogen atoms were refined anisotropically.
The hydrogen atoms were located from the difference Fourier maps and refined isotropically. Molecular graphics tool used was DIAMOND Version 3.1f15 and MERCURY.16 The technical details of data collection and some selected refinement parameters of compounds 1 and 2 are given in Table 1. Selected bond lengths and bond angles of com- pounds 1 and 2 are summarized in Tables 2 and 3 respec- tively.
Crystal structures of [Co(Pnba)2(H2O)4]·2H2O (1) and [Ni(Pnba)2(H2O)4]·2H2O (2)
To the best of our knowledge, this is first report of the crystal growth of the compounds 1 and 2 by single gel dif- fusion technique. The compounds 1 and 2 crystallize in a triclinic space group P-1 and are having a centrosymmet- ric crystal structure. In compound 1, the monomeric mol- ecule consists of a Co(II) ion at the center which is six coordinated. The carboxylate group (O3) of each PnbaH ligand binds the Co(II) ion in a monodendate manner sat- isfying two coordination position. The other four coordi- Table 2. Selected bond lengths (Å) and bond angles (°) for com-
pound 1 Bond lengths
Co(1)–O(3) 2.1296(11)
Co(1)–O(2w) 2.0803(13)
Co(1)–O(3w) 2.0891(14)
O(3)–C(7) 1.269(2)
O(4)–C(7) 1.245(2)
O(2w)–H(5A) 0.833(17)
O(2w)–H(5B) 0.886(18)
O(3w)–H(6A) 0.875(17)
O(3w)–H(6B) 0.838(19)
O(1w)–H(1A) 0.824(17)
O(1w)–H(1B) 0.832(17)
Bond angles
O(2w)–Co(1)–O(3)#1 88.71(5) O(2w)#1–Co(1)–O(3)#1 91.29(5) O(3)–Co(1)–O(4) 54.96(5) O(2w)#1–Co(1)–O(2w) 180.00(1) O(3)#1–Co(1)–O(3) 180.00 O(3w)#1–Co(1)–O(3w) 180.00
O(3w)#1–Co(1)–O(3) 85.92(6)
O(3w)–Co(1)–O(3) 94.08(6) O(2w)–Co(1)–O(3w) 93.83(8) O(2w)–Co(1)–O(3w)#1 86.17(8) Co(1)–O(2w)–H(5A) 126(2)
Co(1)–O(2w)–H(5B) 100(2)
Co(1)–O(3w)–H(6A) 115(2)
Co(1)–O(3w)–H(6B) 139(3)
Symmetry transformations used to generate equivalent atoms: #1
−x+1, −y+1, −z+2 Figure 3. Molecular structure of 1 with atom numbering scheme.
Hydrogen atoms of water molecules are omitted for clarity.
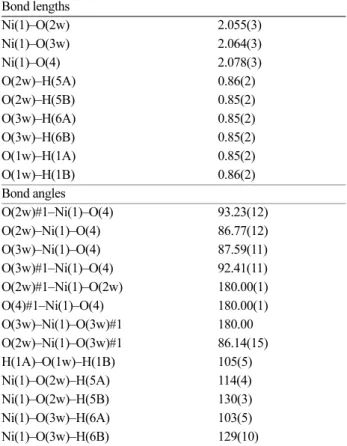
Table 3. Selected bond lengths (Å) and bond angles (°) for com- pound 2
Bond lengths
Ni(1)–O(2w) 2.055(3)
Ni(1)–O(3w) 2.064(3)
Ni(1)–O(4) 2.078(3)
O(2w)–H(5A) 0.86(2)
O(2w)–H(5B) 0.85(2)
O(3w)–H(6A) 0.85(2)
O(3w)–H(6B) 0.85(2)
O(1w)–H(1A) 0.85(2)
O(1w)–H(1B) 0.86(2)
Bond angles
O(2w)#1–Ni(1)–O(4) 93.23(12)
O(2w)–Ni(1)–O(4) 86.77(12)
O(3w)–Ni(1)–O(4) 87.59(11)
O(3w)#1–Ni(1)–O(4) 92.41(11)
O(2w)#1–Ni(1)–O(2w) 180.00(1)
O(4)#1–Ni(1)–O(4) 180.00(1)
O(3w)–Ni(1)–O(3w)#1 180.00
O(2w)–Ni(1)–O(3w)#1 86.14(15)
H(1A)–O(1w)–H(1B) 105(5)
Ni(1)–O(2w)–H(5A) 114(4)
Ni(1)–O(2w)–H(5B) 130(3)
Ni(1)–O(3w)–H(6A) 103(5)
Ni(1)–O(3w)–H(6B) 129(10)
Symmetry transformations used to generate equivalent atoms: #1 –x+1, –y+2, –z+2
nation positions are satisfied by oxygen atoms (O2w &
O3w) of each of the four water molecules. The Co–O bond distances are found to be Co1–O3 (2.1296(11) Å), Co1–O2w (2.0803(13) Å) and Co1–O3w (2.0891(14) Å). The lattice site also contains two water molecules. The molecular structure with atom numbering scheme is shown in Fig. 3.
In the molecule, the coordinated as well as the lattice water molecules are involved in hydrogen bonding linking the complex into a chain. The oxygen atoms, O(1) and O(2) connected to the nitrogen atom are hydrogen bonded to the lattice and coordinated water molecules of the adjacent molecule. The coordinated water is also involved in intramo- lecular hydrogen bonding. The intermolecular and intramo- lecular hydrogen bonding contributes to the stability of the compound thereby forming a supramolecular network.
The hydrogen bonding interactions are shown in Table 4.
The supramolecular arrangement of the molecule is shown in Fig. 4.
The compound 2 comprises of a Ni(II) ion at the center coordinated to six oxygen atoms, two oxygen atoms each from the carboxylic group of PnbaH ligand and four oxy- gen atoms (O2w & O3w) each from four water molecules
and the bond lengths are Ni1–O2w (2.055(3) Å) and Ni1–
O3w (2.064(3) Å). The carboxylic oxygen atoms (O4) coordinate to the Ni(II) ion in a monodentate fashion and the Ni1–O4 bond length is (2.078(3) Å). Two water mol- ecules are also present in the lattice site of the compound.
The asymmetric unit with atom numbering scheme is shown in Fig. 5.
The compound 2 undergoes extensive hydrogen bond- ing due to the presence of coordinated and lattice water molecules. The hydrogen bonding interactions are shown in Table 5. The compound forms both intermolecular and intramolecular hydrogen bonds thereby generating a supramo- lecular network. The supramolecular network with well defined channels can be qualitatively viewed along a-axis (Fig. 6).
FT-IR Spectroscopy
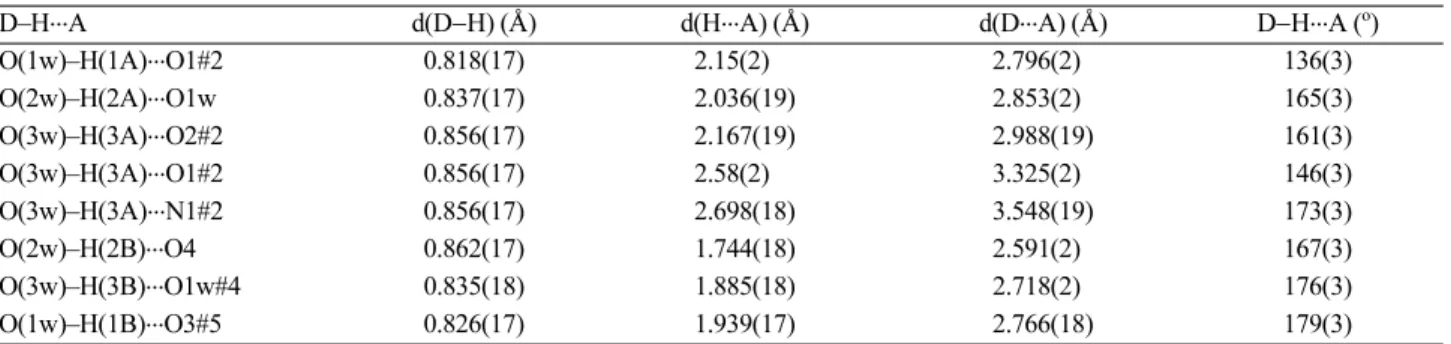
FT-IR spectroscopic method is used to determine the molecular structure and to identify the functional groups in the grown crystals. The IR spectra of the compounds exhibit several sharp bands in the mid-infrared region, many of which are due to the vibrations of organic moiety.17,18 The free acids do not exhibit any significant signals above 3100 cm−1 in the FT-IR spectra indicating that the –OH group of the carboxylic acid is strongly H-bonded to the nitro substituent in the solid state.18 The vibrational bands observed Table 4. Hydrogen bonding interactions [Å & °] of compound 1
D–H...A d(D−H) (Å) d(H...A) (Å) d(D...A) (Å) D−H...A (o)
O(1w)–H(1A)...O1#2 0.818(17) 2.15(2) 2.796(2) 136(3)
O(2w)–H(2A)...O1w 0.837(17) 2.036(19) 2.853(2) 165(3)
O(3w)–H(3A)...O2#2 0.856(17) 2.167(19) 2.988(19) 161(3)
O(3w)–H(3A)...O1#2 0.856(17) 2.58(2) 3.325(2) 146(3)
O(3w)–H(3A)...N1#2 0.856(17) 2.698(18) 3.548(19) 173(3)
O(2w)–H(2B)...O4 0.862(17) 1.744(18) 2.591(2) 167(3)
O(3w)–H(3B)...O1w#4 0.835(18) 1.885(18) 2.718(2) 176(3)
O(1w)–H(1B)...O3#5 0.826(17) 1.939(17) 2.766(18) 179(3)
Symmetry transformations used to generate equivalent atoms: #1 −x+1, −y+2, −z+2 #2 x+1, y, z #3 −x+2, −y+1, −z+2 #4 –x+1, −y, −z+2
#5 x+1, y, z
Figure 4. Supramolecular arrangement of the 1 viewed along a-axis.
Figure 5. Molecular structure of 2 with atom numbering scheme.
Hydrogen atoms of water molecule are omitted for clarity.
between 3200 and 3600 cm−1 in the FT-IR spectra of 1 and 2 indicate the presence of water in it. The carbonyl absorp- tion, observed at 1692 cm−1 in the FT-IR spectrum of PnbaH is absent in the complexes indicating that the ligand coordinates to the metal ion through the carboxylate group after deprotonation.19,20 The asymmetric and symmetric stretching vibrations of the carboxylate groups observed at 1514 and 1378 cm−1 in 1 and 1518 and 1347 cm−1 in 2 support this observation. The asymmetric and symmetric stretching vibrations of the nitro group in the aromatic ring observed at 1543 and 1350 cm−1 in FT-IR spectrum of the ligand does not show appreciable change in the complexes indicating that the nitro group is not involved in bonding.
The FT-IR spectra of 1 and 2 are shown in Figs. S1 and S2 in the supplementary information.
UV-Vis Spectral Studies
The absorbance spectra of the compounds were recorded in solid state, due to their low solubility in common solvents.
The absorption band observed between 250 and 300 nm, in the compounds 1 and 2 can be attributed to intraligand transitions of the PnbaH ligand.21 A broad band observed at 503 nm in compound 1 can be attributed to 4T1g(F)→4A2g
transitions which suggests the octahedral geometry of the
Co(II) complexes.22,23 The absorbance spectrum of com- plex 1 and 2 is shown in Figs. S3 and S4 (supplementary information). The absorption spectrum of compound 2 shows a broad band at 707 nm corresponding to the 3A2g
(F)→3T1g (F) indicating that the compound possess a six coordinate octahedral geometry.24
Micro Hardness Studies
Hardness can be defined as a measure of the resistance to deformation. Vicker’s micro hardness measurements were done on the grown crystals using a Shimadzu HMV- 2TAW micro hardness tester fitted with a diamond pyra- midal indenter. The diamond pyramidal indenter was used with a constant indentation time of 14 seconds. The load applied was 25 g. Hardness value is calculated from the relation:
Hv = 1.8544 P/d2 Kg/mm2
where P is the applied load in Kg and d is the average diagonal length of the indented impression in millimeter.
The micro hardness value was taken as the average of sev- eral indentations made. The value of hardness was found to be 39.49 Kg/mm2 for compound 1 and 42.16 Kg/mm2 for compound 2. The hardness may be attributed to the stress required for the homogeneous nucleation in the small dislocation free region indented.25
Magnetic Susceptibility
Magnetic susceptibility of the powdered compounds was determined using a Sherwood scientific MK1 balance at room temperature. The magnetic susceptibility measure- ments showed that the compound was paramagnetic in nature. After applying suitable diamagnetic corrections, the effective magnetic moment of the compound, µeff was calculated using the relation:
µeff = 2.828(χmcorr T)1/2
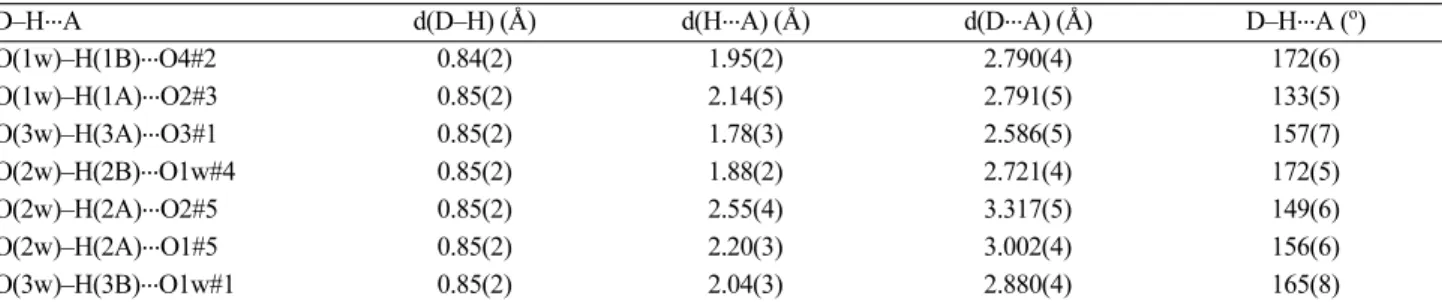
where χmcorr is the molar magnetic susceptibility corrected Table 5. Hydrogen bonding interactions [Å & °] of compound 2
D–H...A d(D–H) (Å) d(H...A) (Å) d(D...A) (Å) D–H...A (o)
O(1w)–H(1B)...O4#2 0.84(2) 1.95(2) 2.790(4) 172(6)
O(1w)–H(1A)...O2#3 0.85(2) 2.14(5) 2.791(5) 133(5)
O(3w)–H(3A)...O3#1 0.85(2) 1.78(3) 2.586(5) 157(7)
O(2w)–H(2B)...O1w#4 0.85(2) 1.88(2) 2.721(4) 172(5)
O(2w)–H(2A)...O2#5 0.85(2) 2.55(4) 3.317(5) 149(6)
O(2w)–H(2A)...O1#5 0.85(2) 2.20(3) 3.002(4) 156(6)
O(3w)–H(3B)...O1w#1 0.85(2) 2.04(3) 2.880(4) 165(8)
Symmetry transformations used to generate equivalent atoms: #1 −x+1, −y+2, −z+2 #2 x+1, y, z #3 x+1, y, z+1 #4 x, y+1, z #5 −x, −y+2, −z+1
Figure 6. Supramolecular arrangement of the 2 viewed along a-axis.
using Pascal’s constants for diamagnetism of all atoms in the compound and T is the absolute temperature. The effective magnetic moment of the compound 1 was found to be 4.61 BM which suggests a high spin octahedral geometry for the complex.26,27 Compound 2 has an effective mag- netic moment of 2.77 BM indicating that the compound possesses an octahedral geometry.28
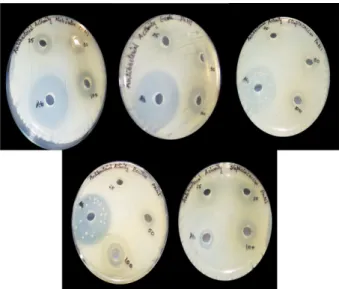
Antibacterial Studies
The antibacterial activity of the ligand, PnbaH and the complexes were determined by agar-well diffusion method as described above. Gentamycin was used as the standard.
The growth inhibition of Gentamycin for Staphylococcus aureus, Bacillus subtilis, Streptococcus mutans, Klebsiella pneumoniae and Escherichia coli was found to be 22, 35, 35, 30 and 38 mm respectively. The diameter of the zone of inhibition formed around the wells by the ligand and the complexes was calculated for three different concen- trations and the photograph showing the antibacterial activity of the compounds 1 and 2 are shown in Fig. 7 and 8 respectively. It was found that the complexes are more active compared to the free ligand, but less active when compared with the standard Gentamycin in the case of all bacterias except Staphylococcus aureus. The diameter of zone of inhibition in millimeters is shown in Table 6. From the table, it was found that the compound 1 is more active compared to the ligand and the compound 2. The inhibition zones of the ligand as well as the complexes were found to increase with increase in concentration. The increased
antimicrobial activity of the metal complexes over ligands is favored by five factors namely a) the chelate effect, b) the nature of coordinated ligands, c) the total charge of the complex, d) the nature of the ion neutralizing the ionic com- plex and d) the nuclearity of the metal center in the com- plex.29,30 On chelation the polarity of the metal ion will be reduced to a greater extent due to overlap of ligand orbital and partial sharing of the positive charge of the metal ion with donor groups. The delocalization of the π-electrons over the whole chelate ring also increases which enhances the lipophilicity of the complexes.31 The increased lipo- philicity enhances the penetration of the complexes into lipid membranes and blocking of the metal binding sites in the enzymes of microorganisms. The respiration pro- cess of the cell is also disturbed by the complexes thereby blocking the synthesis of the proteins that restricts further growth of the organism.32
Antifungal Activity
The antifungal activity of the ligand and the complexes are determined using agar-well diffusion method as described above. The standard used for the antifungal study was Clotri- mazole. The growth inhibition of Clotrimazole for Can- dida albicans and Aspergillus niger was found to be 17 and 20 mm. The ligand and the complexes were found to be more active compared to the standard. The activity of the investigated samples was found to increase with the con- centrations of the samples. The diameter of zone of inhibition in millimeters for the ligand and the complexes is shown in Figure 7. Antibacterial activity of 1 against Streptococcus mutans,
Klebsiellla pneumoniae, E. coli, Bacillus subtilis, Staphylococcus aureus.
Figure 8. Antibacterial activity of 2 against Klebsiellla pneumo- niae, E. coli, Streptococcus mutans, Bacillus subtilis, Staphylo- coccus aureus.
Table 7 and the photograph of antifungal activity of the com- pounds 1 and 2 are shown in Figs. 9 and 10 respectively.
CONCLUSION
X-ray quality single crystals of Co(II) and Ni(II) com- plexes of 4-nitrobenzoic acid were successfully grown by gel diffusion technique. The composition of the complexes was obtained from elemental analysis and was found to be [Co(Pnba)2(H2O)4]·2H2O and [Ni(Pnba)2(H2O)4]·2H2O.
The presence of water in the compounds 1 and 2 was con- firmed from FT-IR spectral studies. Powder X-ray diffraction studies confirmed the crystalline nature of the complexes and on comparison with the simulated X-ray diffraction patterns from single crystal X-ray diffraction data, the bulk purity of the crystals were confirmed. Single crystal X-ray dif- fraction studies showed that the monomeric compounds 1 and 2 crystallized in centrosymmetric triclinic space group P-1. The UV-visible spectral data and the magnetic moment values confirmed the octahedral geometry of the complexes.
The mechanical strength of the grown crystals was confirmed by Vicker’s microhardness studies. The complexes show good antifungal and antibacterial activity compared to the free ligand.
Acknowledgments. Publication cost of this paper was supported by the Korean Chemical Society. The authors thank the authorities of SAIF, Cochin University of Science and Technology (CUSAT), Kochi, Sree Chitra Tirunal Institute for Medical Sciences and Technology, Thiruva- nanthapuram, Department of Chemistry, Government Women’s College, Thiruvananthapuram and Biogenix research cen- ter, Thiruvananthapuram, Kerala, India for the analytical facilities. And the publication cost of this paper was sup- ported by the Korean Chemical Society.
REFERENCES
1. Regulska, E.; Samsonowicz, M.; Swislocka, R.; Lewand- owski, W. J. Phys. Org. Chem. 2007, 20, 93.
2. Mehrotra, R. C.; Bohra, R. Metal Carboxylates; Academic Press: London, 1983.
3. Mehrotra, R. C.; Singh, A. Prog. Inorg. Chem. 1997, 46, 239−454.
Figure 10. Antifungal activity of 2 towards Aspergillus niger and Candida albicans.
Table 7. Antifungal activity of ligand (PnbaH) and the complexes 1 and 2
Compound
Diameter of zone of inhibition (mm) Fungi
Aspergillus niger Candida albicans 50 µg/ml 100 µg/ml 50 µg/ml 100 µg/ml
PnbaH 12 17 19 21
1 14 26 25 30
2 − 12 9 12
(−): no activity observed against the fungal species
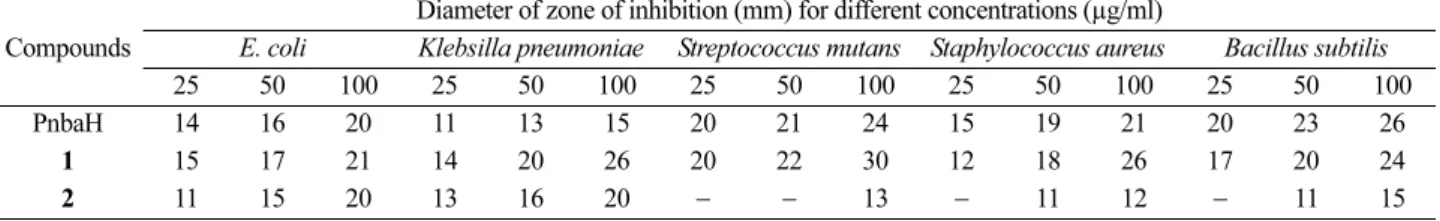
Table 6. Antibacterial activity of the ligand (PnbaH) and the complexes 1 and 2 at different concentrations (25, 50, 100 µg/ml)
Compounds
Diameter of zone of inhibition (mm) for different concentrations (µg/ml)
E. coli Klebsilla pneumoniae Streptococcus mutans Staphylococcus aureus Bacillus subtilis
25 50 100 25 50 100 25 50 100 25 50 100 25 50 100
PnbaH 14 16 20 11 13 15 20 21 24 15 19 21 20 23 26
1 15 17 21 14 20 26 20 22 30 12 18 26 17 20 24
2 11 15 20 13 16 20 − − 13 − 11 12 − 11 15
(−): no activity observed against the bacterial species.
Figure 9. Antifungal activity of 1 towards Aspergillus niger and Candida albicans.
4. Bharti, N.; Maurya, R. M.; Bhattacharya, A.; Bhattacharya, S.; Azam, A. Eur. J. Med. Chem. 2000, 35, 481.
5. ST NIL , Andreea; BRAICU, Cornelia; ST NIL , Sorin;
POP, M. Raluca. Not. Bot. Horti. Agrobo. 2011, 39, 124.
6. Stuhlmeier, K. M.; Li, H.; Kao, J. J. Biochem. Pharmacol.
1999, 57, 313.
7. Dendrinou-Samara, C.; Tsotsou, G.; Ekateriniadou, L. V.;
Kortsaris, A. H.; Raptopoulou, C. P.; Terzis, A.; Kyriakidis, D. A.; Kessissoglou, D. P. J. Inorg. Biochem. 1998, 71, 171.
8. Nadzhafov, G. N.; Shnulin, A. N.; Mamedov, Kh, S. Zh.
Strukt. Khim. 1981, 22, 124.
9. Srinivasan, B. R.; Sarvesh, C. Sawant Indian J. Chem.
2004, 43A, 1066.
10. Kristiansson, O. Z. Kristallogr New Cryst. Struct. 2001, 216, 86.
11. Dhanya, V. S.; Sudarsanakumar, M. R.; Suma, S.; Prasanna, S.; Rajendra Babu, K.; Sureshkumar, B.; Sunalya, M. Roy J.
Cryst. Growth 2011, 319, 96.
12. Sunalya, M. Roy; Sudarsanakumar, M. R.; Suma, S.;
Prathapachandra Kurup, M. R.; Dhanya, V. S. J. Inorg.
Organomet. Polym. 2013, 23, 608−615.
13. Altornare, A.; Cascarano, G.; Giacovazzo, C.; Guagliardi, A. J. Appl. Cryst. 1993, 26, 343.
14. Sheldrick, G. M. Acta Crystallogr. Sect. A 2008, 64, 112.
15. Brandenburg, K. DIAMOND, version 3.1f; Crystal Impact GbR: Bonn, Germany 2008.
16. Mercury 1.4.1, Copyright Cambridge Crystallographic Data Center, Cambridge (2001/2005).
17. Srinivasan, B. R.; Rane, G. K. J. Chem. Sci. 2009, 121, 145.
18. Srinivasan, B. R.; Sawant, S. C. Thermochimic. Acta 2003, 402, 45.
19. Nakamoto, K. Infrared and Raman Spectra of Inorganic and Coordination Compounds, 4th ed.; Wiley: New York, 1986.
20. Regulska, E.; Samsonowicz, M.; Swislocka, R.; Lewand- owski, W. J. Phys. Org. Chem. 2007, 20, 93.
21. Srinivasan, B. R.; Shetgaonkar, S. Y.; Nather, C.; Bensch, W. Polyhedron 2009, 28, 534.
22. Lever, A. B. P. Inorganic electronic spectroscopy, 2nd ed.; Elsevier: Amsterdam, 1984; pp 376.
23. Figgis B. N.; Lewis J. Progr. Inorg. Chem. 1964, 6, 37.
24. Hassaan, A. M. A. Trans. Met. Chem. 1990, 15, 283.
25. Dhanya, V. S.; Sudarsanakumar, M. R.; Suma, S.; Prathapachan- dra Kurup, M. R.; Sithambaresan, M.; Sunalya, M. Roy Specrochim. Acta A 2012, 93, 295.
26. Aly, M. A. Hassan, J. Islamic Acad. Sci. 1991, 4, 271.
27. Cotton F. A., Wilkinson G. Advanced Inorganic Chemis- try; Wiley Interscience: New York, 1962.
28. Figgis, B. N. An Introduction to Ligand Fields; Wiley Eastern:
New Delhi, 1976.
29. Dendrinou-Samara, C.; Psomas, G.; Raptopoulou, C. P.;
Kessissoglou, D. P. J. Inorg. Biochem. 2001, 83, 7.
30. EL-Shwiniy, W. H.; EL-Attar, M. S.; Sadeek, S. A. J. Korean Chem. Soc. 2013, 57, 52.
31. Raman, N.; Sakthivel, A.; Rajasekaran, K. Mycobiology 2007, 35(3), 150.
32. Imran, M.; Iqbal, S.; Ijaz, N. Turk. J. Biol. 2007, 31, 67.
A˘ A˘ A˘ A˘