• 검색 결과가 없습니다.

Nexus Between Social Media and Brand Preference of Smart Mobile Phones: An Empirical Study in Sri Lanka

N/A
N/A
Protected

Academic year: 2021

Share "Nexus Between Social Media and Brand Preference of Smart Mobile Phones: An Empirical Study in Sri Lanka"

Copied!
9
0
0

로드 중.... (전체 텍스트 보기)

전체 글

(1)

Print ISSN: 2288-4637 / Online ISSN 2288-4645 doi:10.13106/jafeb.2021.vol8.no8.0241

Nexus Between Social Media and Brand Preference of Smart Mobile Phones: An Empirical Study in Sri Lanka*

Vasanthakumar KUMARADEEPAN

1

Received: April 10, 2021 Revised: June 26, 2021 Accepted: July 04, 2021

Abstract

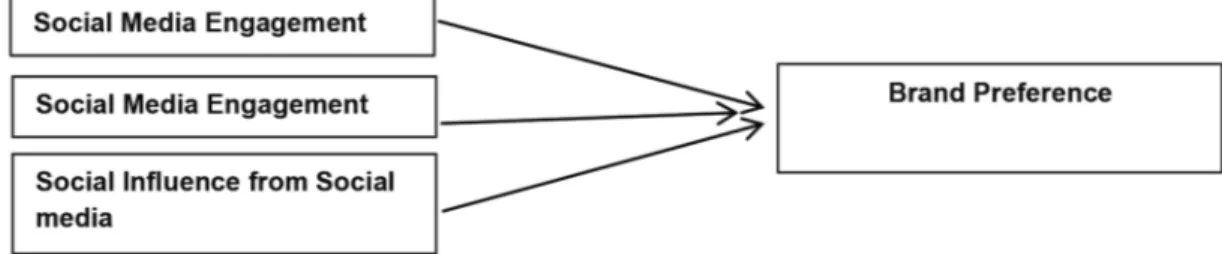
The aim of the research is to evaluate the impact of social media marketing (with special reference to Facebook) on the brand preference of customers with regard to smart mobile phones. Since Facebook has become very popular today and a trend has arisen to use social media as a marketing tool, the researcher intended to evaluate the impact of social media marketing on brand preference, as the findings would provide valuable insight for future businesses. Social media as measured social media visibility, social media engagement, and social media influencewas the independent variableand brand preference was the dependent variable. The convenience sampling method was used where the sample was taken from a group of people easy to contact or to reach. A sample of 186 young males and females was selected. Factor loading and factor analysis were used to analyze the data and find the most influencing factors on brand preference. Reliability analysis, validity analysis, and regression analysiswere performed to analyze the data. The R

2

value is 0.320 implying that 32.00% of the variance in brand preference is explained by social media influence, social media engagement, and social media visibility. The findings show thatsocial media visibility, social media engagement, and social media influencehave a positive impact on brand preference.

Keywords: Social Media, Facebook, Brand Preference, Social Media Visibility, Social Media Engagement, Sri Lanka JEL Classification Code: D11, M31, M37, M51, L82

Windows Mobile are among the most common mobile operating systems. Since many brands are constantly innovating and upgrading their products, the smartphone market has become extremely competitive. Leading smartphone manufacturers such as Apple, Samsung, and Huawei together own a large market share. There are more than three billion smartphone users worldwide, with that number expected to rise in coming years.

Sri Lanka has more than 23 million mobile connections and more than five million active Internet users, according to the “Telecommunication Regulation Commission of Sri Lanka”. According to GSMA Intelligence, as of 2020, Sri Lanka had 24.7 million mobile links. According to the study of “Asia-Pacific Digital, Social, and Mobile 2015” released by ‘We Are Social’ and “IAB Singapore”, in 2015, Sri Lanka had 27.4 million mobile connections and 4.79 million active Internet users. Social networking has grown in popularity and influence as the use of the Internet and mobile phones have increased. Facebook, Flickr, Google+, Instagram, LinkedIn, MySpace, Snap Chat, Twitter, WeChat, WhatsApp, and YouTube are only a few of the well-known social media platforms. According to a study conducted by the Pew Research Center in the

*Acknowledgements:

It’s my privilege to thanks the respondents who have shared their opinion on data collection and to everyone who has supported completing this task.

1

First Author and Corresponding Author. Senior Lecturer, Department of Marketing, Faculty of Management Studies and Commerce, University of Jaffna, Sri Lanka [Postal Address:

Thirunelveli, Jaffna, Northern Province, 040000, Sri Lanka]

Email: kumaradeepan@univ.jfn.ac.lk

© Copyright: The Author(s)

This is an Open Access article distributed under the terms of the Creative Commons Attribution Non-Commercial License (https://creativecommons.org/licenses/by-nc/4.0/) which permits unrestricted non-commercial use, distribution, and reproduction in any medium, provided the original work is properly cited.

1. Introduction

Smartphone use is increasingly growing in both developed and developing countries, such as Sri Lanka.

A smartphone is a mobile phone that includes advanced

functionality beyond making phone calls and sending text

messages. A standard smartphone has key features such as

a high-resolution touch screen display, Wi-Fi access, Web

browsing capability, and the ability to accept sophisticated

applications. Android, Symbian, iOS, BlackBerry OS, and

(2)

United States, 72% of US adults use Facebook and 62%

use the Internet. There are 2.7 million social media users and over 2.2 million social media users on mobile devices.

The use of social media has increased by 40% and active social media users account for 14% of the country’s overall population. Since January 2020, the number of active mobile social users has increased by 53%.

Social media plays a vital role in marketing and creating relationships with customers. Most businesses are beginning to use social media as a means of marketing. Social media is an emerging phenomenon in business marketing and public relations (PR).With the rise in popularity of social media, businesses are increasingly turning to social media for marketing purposes. Many businesses have created fan pages for their products, and social media is used for many advertising campaigns. Apart from promotions, some businesses have built their entire business model around social media, with product displays and orders taking place there as well.

Organizations have also found social media to be successful marketing tools. Organizations can now connect directly with their customers and participate in one-on-one interactions. Internet users have a more favorable opinion of businesses that use social media (Akar & Topçu, 2011).

According to a survey conducted in Sri Lanka, 45% of respondents are satisfied with getting information about a brand from its Facebook page rather than visiting its website.

As a result, social media marketing has become increasingly important as more businesses adopt it.

In recent years, the role of social media has become a focus for researchers, and the researcher aims to assess the impact of social media marketing on brand preference.

Smartphone manufacturers are now using social media to promote and market their products.

According to a recent report, small and medium-sized businesses will grow globally if they use social media (Onyango, 2016). According to Da Costa (2003),71% of small-to-mid-sized businesses use social media to market themselves, and of those who do so, 52% post at least daily.63% of customers actually expect companies to offer customer service through their social media – and 90% of social media users have already connected with a brand or business through their chosen platform. According to another research, 66% of companies use Facebook to sell their goods locally. Since the smartphone market is projected to expand even further, marketers have a big opportunity to use social media as a marketing tool. In Sri Lanka, Facebook is the most prominent social media platform (Kengatharan, 2017). Facebook is also the most popular social media site among marketers. According to a research, there are over 3.5 million Facebook users and roughly half of the population uses a cell phone. According to a report, 42% of Facebook users communicate in two

languages, and 38% check their account 8 times per day.

On average, a Sri Lankan spends 34 minutes on Facebook per day. Facebook users visit 17 pages a day on average and follow local brands, with 35% following more than 15 brands. As a result, it’s critical to determine if these Facebook pages have a direct effect on customers.

In Sri Lanka, youth make up the majority of smartphone and Facebook users. Youth, on the other hand, are more technologically advanced and are interested in purchasing the latest smartphones to hit the market. The majority of smartphone brands advertise on Facebook, so it’s worthwhile to assess the effect of social media marketing, with a focus on Facebook, on smartphone brand preference.

2. Literature Review

On a global scale, social networking sites and social media have grown in popularity in recent years (Kengatharan, 2017). After its inception in 2004, Facebook is said to have more than 1.5 billion active users as of April 2016 (www.

facebook.com). A social networking service is an online platform that people use to build social networks or social relationships with other people who share similar personal or career interests, activities, backgrounds, or real-life connections. Social networking services vary in format and the number of features (Trusov et al. 2009). Indeed, online social networks have fundamentally altered knowledge dissemination by making it extremely simple to exchange and ingest information over the Internet (Vinerean et al. 2013).

The peculiar characteristics of social media, as well as its enormous success, have revolutionized marketing strategies like advertisement and promotion. Consumer attitudes, from knowledge acquisition to post-purchase behavior, such as disappointing comments or behaviors (Ioanăs & Stoica, 2014), and Internet use habits, have all been affected by social media (Laroche et al. 2012).

Kaplan (2015) defined social media as “a group of Internet-based applications that build on the ideological and technological foundations of Web 2.0, and that allow the creation and exchange of user-generated content. As Kaplan discovered, social media has many benefits in that it lets companies engage with customers, establish relationships, and maintain those relationships in a timely and cost- effective manner.

According to Sedeke (2012) social media is a group of Internet-based applications that build on the ideological and technical foundations of Web 2.0., and allow the creation and exchange of user-generated content.Social media is a broad term that describes software tools that create user-generated content that can be shared(Paquette, 2013).

Other social media features include impacting and shaping beliefs, behaviors, and end actions (Bianchi &

Andrews, 2018), as well as bringing like-minded people

(3)

together. In today’s online world, Laroche et al. (2013) stated that people like the concept of contributing to, building, and entering groups to meet needs for belonging, social connection, and recognition, or simply enjoying interactions with other like-minded members.

The Internet and social media have drastically changed the way people all over the world interact and communicate.

Social media networks allow us the opportunity to share opinions with a far wider audience. Hence, market leaders have declared that businesses must engage in Facebook, Twitter, MySpace, and other social media sites to compete in online environments (Kaplan, 2015). Companies should use social media websites to connect and communicate with future and current customers, promote a greater sense of closeness in customer relationships, and create positive relationships with customers (Sahai et al., 2018).), which is particularly important in today’s market climate where customer loyalty can be lost with the slightest mistake (Hudson et al., 2016), and can also result in the online dissemination of their negative experience with a specific product, service, brand, or business.

In today’s technology-driven world, social networking sites have become an avenue where retailers can extend their marketing campaigns to a wider range of consumers.

Some businesses are starting to recognize the value of social media. In today’s technologically advanced world, social networking platforms have become a way for brands to reach a broader audience with their marketing campaigns.

Social media marketing is a “connection between brands and consumers, [while] offering a personal channel and currency for user-centered networking and social interaction.

The tools and approaches for communicating with customers have changed greatly with the emergence of social media;

therefore, businesses must learn how to use social media in a way (Vijay &Srivastava, 2019).

With the advent of social media, the tools and methods for engaging with consumers have changed dramatically;

as a result, companies must learn how to use social media in a way that is compatible with their business strategy (Mangold & Faulds, 2009).A retailer must understand every aspect of social media before using it as a marketing tool. Social media cannot be understood without first defining Web 2.0: a term that describes a new way in which end users use the World Wide Web, a place where content is continuously altered by all operators in a sharing and collaborative way (Kaplan, 2015). “It is more to do with what people are doing with the technology than the technology itself, for ratherthan merely retrieving information, users are now creating and consuming it, and hence adding value to the websites that permit them to do so”.Web 2.0 has evolved from simple information retrieval to interactivity, interoperability, and collaboration (Verma et al., 2017). From basic information processing through

interactivity, interoperability, and collaboration, Web 2.0 has progressed.

The phrase social networking sites’ is often used interchangeably with social media. However, social media is different because it allows participants to unite by generating personal information profiles and inviting friends and colleagues to have access to those profiles. Thus, social media is the environment in which social networking takes place and has altered how consumers gather information and make buying decisions (Wang et al., 2017).Social media has advanced from simply providing a platform for individuals to stay in touch with their family and friends. Now it is a place where consumers can learn more about their favorite companies and the products they sell. Marketers and retailers are utilizing these sites as another way to reach consumers and provide a new way to shop. Technology- related developments such as the rise of powerful search engines, advanced mobile devices and interfaces, peer-to- peer communication vehicles, and online social networks have extended marketers’ ability to reach shoppers through new touchpoints.

Taylor and Costello (2017) described major theoretical perspectives that have been used in fashion advertising.

Key sub-areas of the field which are discussed include what factors lead to effective advertisements; how different types of models affect consumers and influence the effectiveness of ads; how consumers can be segmented potentially across nations; how social media advertising can be used to produce positive marketing outcomes; and how controversial fashion advertising impacts consumers.

Gautam and Sharma (2017) investigated the direct and indirect impacts of social media marketing activities (entertainment, customization, interaction, word of mouth, and trend) on consumers’ purchase intentions in luxury fashion brands.They found positive significant impacts of social media marketing and customer relationships on consumers’ purchase intentions. In addition, their study model confirmed the full mediation of customer relationships in the relationship between social media marketing and consumers’ purchase intentions. Based on their research findings, they strongly recommended that marketers of luxury fashion brands engage in social media marketing activities to provide value to customers.

Laksamana (2018) explored the impact of social media marketing on purchase intention and brand loyalty.

He found that social media marketing leads to purchase intention and brand loyalty. Hence, brand loyalty was affected by purchase intention.

Gupta et al. (2021), proposes a direct relationship

between CSR-S and purchase intention with a mediating

effect of brand admiration.The results revealed that CSR-S

is positively related to purchase intention. The results

further showed that brand admiration partially mediates this

(4)

relationship. The survey respondents confirmed that their bank’s CSR communication helps enhance their purchase likelihood and their feelings of admiration for their bank.

These findings will help policymakers at banking institutions better understand the importance of CSR communication on different social media platforms to achieve consumer- related outcomes. Nur (2021) examined the effect of social media on oil and gas firms’ value.Based on the analysis, the social media account of the firm had a positive effect on firm value. It indicated that social media give advantages for oil and gas firms to give a signal of business prospect, make use of opportunities related to industry alliances, and recruit employees globally.

According to Dulek and Aydin (2020), social media can be used at any time of the day and the easy accessibility of social media thanks to mobile devices offers marketers great opportunities to reach consumers using social media.

The impact of social media on brand loyalty, E-WOM, and intention to purchase is undoubtedly important. They investigatedthe effect of social media marketing on brand loyalty, electronic word of mouth communication, and purchase intention, as well as the effect of brand loyalty and E-WOM on purchase intention. Results showed that social media marketing had a positive effect on brand loyalty and E-WOM. According to the findings, social media marketing will increase purchase intention because it has a positive effect on brand loyalty. According to the findings, social media marketing is very important for businesses.

Kim and Ko (2012) set out to identify attributes of SMM activities and examine the relationships among those perceived activities, value equity, relationship equity, brand equity, customer equity, and purchase intention through a structural equation model. Five constructs of perceived SSM activities of luxury fashion brands are entertainment, interaction, trendiness, customization, and word of mouth.

Their effects on value equity, relationship equity, and brand equity are significantly positive. For the relationship between customer equity drivers and customer equity, brand equity has a significant negative effect on customer equity while value equity and relationship equity show no significant effect. As for purchase intention, value equity

and relationship equity had significant positive effects, while relationship equity had no significant influence.

Finally, the relationship between purchase intention and customer equity has significance. The findings of this study can enable luxury brands to forecast the future purchasing behavior of their customers more accurately and provide a guide to managing their assets and marketing activities as well.

Situmorang et al. (2021) examined the moderating effect of attitude toward green brand on green brand positioning and repurchase intention of environmentally friendly products, product knowledge on attitude toward the green brand, and the effect of green product knowledge on green repurchase intention. The results showed that green brand positioning has a significant effect on repurchase intention.

Attitude toward green brands has a positive effect in mediating the relationship between green brand positioning and repurchase intention. Similarly, green brand knowledge has a positive effect on attitudes, although green knowledge has no positive effect on repurchase intention. Product positioning in the minds of consumers is important in shaping attitudes. It is important for companies to continue to develop environmentally friendly products so that product positioning can be distinguished from competitors’ products.

In this regard, the conceptual framework of this study is depicted in Figure 1.

3. Research Methods and Results 3.1. The Kaiser–Meyer–Olkin (KMO)

The Kaiser–Meyer–Olkin (KMO) sampling adequacy tests, as well as Bartlett’s test of sphericity and the inspection of correlation coefficients, were used to assess the data’s suitability for factor analysis. As a caveat, each individual variable’s KMO should be at least 0.5, otherwise, they should be excluded from the factor analysis. The Kaiser’s criterion (eigenvalue rule) is the most widely used technique for maintaining a large number of variables. The Kaiser rule is to drop all components with eigenvalues under 1.0 – this being the eigenvalue equal to the information accounted for by an average single item.

Figure 1: Research Model

(5)

Another useful tool for demonstrating the appropri- ateness of data for factor analysis is the Kaiser-Meyer-Olkin (KMO) sampling adequacy metric. Statistics for KMO range from 0 to 1. It is recommended that the KMO value be greater than 0.5, with values ranging from 0.5 to 0.7 being moderate, 0.7 to 0.8 being decent, and 0.8 to 0.9 being superior. The value of KMO for the overall matrix in this study is 0.906, implying that the sample used for factor analysis is statistically important. This test must be important, with a significance value of less than 0.05.

The test value of chi-square 1513.228 (P = 0.0000.05) is highly important.As seen in the table above that the data is appropriate for the factor analysis in the study.

3.2. Factor Analysis

Factor analysis was used to validate the variables in the analysis (Table 1). It is obvious that the sample size of 186 (used in this study) is sufficient for a suitable factor solution as 15 commonalities have values greater than 0.5.The number of variables derived and the variance described are shown in Table 1. The eigenvalue for the first three factors is greater than 1, so these three factors account for 91.435 for the overall variance.Principal Component Analysis (PCA) is accompanied by Varimax rotation when the original measurements are analyzed by PCA. The first part, extracted

with an eigenvalue greater than one, explained 53.755 percent of the variance. The second component, derived with an Eigenvalue greater than one, explained 19.780 percent of the variance. The third component, derived with an eigenvalue greater than one,explained 17.900 percent of the variance.

Finally, the study revealed that three components accounted for 91.435 percent of the overall variance. Table 2 shows the factor structure that resulted from the factor study.

Each of the three components listed in the table, social media visibility, social media engagement, and social media influences, is labeled with the name of the value that loaded the most for those variables. The first factor is social media visibility, which is explained by seven variables with factor loadings ranging from 0.966 to 0.981, accounting for 53.755 percent of the variance. The second factor is social media engagement, which is explained by five variables with factor loadings ranging from 0.877 to 0.9970, accounting for 19.780 percent of the variance. The third factor issocial media influence, whichis explained by three variables with factor loadings ranging from 0.725 to.866, accounting for 17.900 percent of the variance.

Following the factor analysis, the instruments’ reliability was investigated. The factors are powerful, theoretically significant, and easy to interpret. Confirmatory factor analysis was used next to ensure that the model fit and psychometric properties were established.

Table 1: Factor Analysis Total Variance Explained

Component Initial Eigenvalues Extraction Sums of Squared Loadings Rotation Sums of Squared

Loadings

a

Total % of Variance Cumulative % Total % of Variance Cumulative % Total

1 9.138 53.755 53.755 9.138 53.755 53.755 6.825

2 3.363 19.780 73.535 3.363 19.780 73.535 5.412

3 3.043 17.900 91.435 3.043 17.90 91.435 6.927

4 0.777 4.568 96.004

5 0.321 1.886 97.890

6 0.092 0.539 98.429

7 0.080 0.471 98.900

8 0.072 0.426 99.325

9 0.055 0.323 99.648 `

10 0.026 0.155 99.803

11 0.018 0.106 99.909

12 0.012 0.071 99.981

13 0.003 0.019 100.000

14 8.790E-16 5.171E-15 100.000

15 8.285E-17 4.873E-16 100.000

(6)

Table 2: Factor Structure (Pattern Matrix)

a

Indicators Component

Factor 01 Factor 02 Factor 03

V1 0.974

V2 0.974

V3 0.969

V4 0.966

V5 0.966

V6 0.981

V7 0.981

E1 0.970

E2 0.953

E3 0.898

E4 0.886

E5 0.877

S1 0.876

S2 0.866

S3 0.725

Eigen value 9.138 3.363 3.043

Proportion of Variance

Explained (%) 53.755 19.780 17.900

Cumulative

Percentage Explained 53.755 73.535 91.435 Cronbach’s alpha –

Reliability of the Factors

0.815 0.817 0.960

3.3. Reliability Test

Cronbach’s alpha was used to assess the reliability.

The degree to which an evaluation method produces stable and accurate results is known as reliability. The Cronbach alpha is a well-known method for determining reliability.

Cronbach alpha values less than 0.6 are considered low, those in the 0.7 range are suitable, and those over 0.8 are considered fine. Cronbach’s Alpha values are both greater than and equal to 0.7. Therefore, the above measurements are reliable. According to the Pearson correlation review, social media visibilityhas a favorable relationship with brand preference (r = 0.418, p = 0.01). This means if the social media visibility variable (independent variable) increases, the brand preference (dependent variable) variable increases as well. The significance value is 0.000, which is less than the chosen degree of significance of 1%. (0.01). This shows that an increase or decrease in social media visibility of brand preference has a direct impact on brand preference increase or decrease. According to Table 3, the Pearson correlation

is 0.418. This demonstrates a positive relationship between brand preference and social media exposure.

According to the Pearson correlation review, social media engagement has a favorable relationship with brand preference (r = 0.371, p = 0.01). Thismeans if the social media engagement variable (independent variable) increases, the brand preference (dependent variable) variable increases as well. The significance value is 0.000, which is less than the chosen degree of significance of 1%. (0.01). This shows that an increase or decrease in social media engagementof brand preference has a large impact on brand preference increase or decrease. According to Table 3, the Pearson correlation is 0.371. This shows a positive relationship between social media engagement and brand preference.

According to the Pearson correlation review, social media engagement has a favorable relationship with brand preference(r = 0.333, p = 0.01). This means if the social media influencevariable (independent variable) increases, the brand preference (dependent variable) variable increases as well.The significance value is 0.000, which is less than the chosen degree of significance of 1%. (0.01). This shows that an increase or decrease in social media influenceof brand preferencehas a large impact on brand preference increase or decrease.

According to Table 3, the Pearson correlation is 0.371.

The significance value is 0.000, which is less than the chosen degree of significance of 1%. (0.01). This shows that an increase or decrease in social media influence of brand preferencehas a large impact on brand preference increase or decrease. The Pearson correlation has a value of 0.333, as seen in the table above. This demonstrates that social media influence and brand preference have a positive relationship (Table 4).

3.4. Regression Analysis

The objective is to build a regression model or prediction equation. Regression is Y = a + bx, which can be used to describe, predict and control. One model was developed to test the hypotheses. This indicates that social media influence and brand preference have a positive relationship (Table 5).

Table 3: Reliability of the Data

Variables Cronbach’s

Alpha No. of Items

Social Media Visibility 0.815 07

Social Media Engagement 0.817 05

Social Media Influence from

Social Media 0.960 03

Brand Preference 0.857 05

(7)

The model has explained a large amount of variation in brand preference, as seen in the table above. The R

2

of 0.320 indicates that social media influence, social media engagement, and social media visibility account for 32.00 percent of the variation in brand preference. The researchers used multiple regression analysis to see whether social media visibility, social media engagement, and social media influence were all important predictors of brand preference.

The regression results revealed that three predictors explained 32.00 percent of the variance (R

2

= 0.32.00, F = 0.32.00) (27.564). Brand preference was found to be substantially predicted by social media exposure (R

2

= 0.337, p = 0.000) and social media influence (β = 0.747, p < 0.000). All of the hypotheses established within the conceptual framework are clearly supported by robust statistical methods.

4. Conclusion and Limitations

The goal is to provide additional insights into how to improve brand loyalty for fashion retailer brands through social media activities. It is recommended to carefully handle user feedback and reviews. Complaints and negative feedback should be handled with care and speed. It is suggested that to improve interaction by producing more useful and appealing content. It is suggested to react rapidly to consumer messages and requests on social media.

An important variation in brand preference has been clarified by the model. The R

2

of.320 indicates that social media influence, social media engagement, and social media visibility account for 32.00 percent of the variance in brand preference. Principal Component Analysis (PCA) is accompanied by Varimax rotation when the original measurements are analyzed by PCA. The first part, extracted with an eigenvalue greater than one, explained 53.755 percent of the variance. The second component, derived with an Eigenvalue greater than one, explained 19.780 percent of the variance. The third component, derived with an eigenvalue greater than one, explained 17.900 percent of the variance.

Each of the three components listed in the table, social media visibility, social media engagement, and social media influences, is labeled with the name of the value that loaded the most for those variables. The first factor is social media visibility, which is explained byseven variables with factor loadings ranging from 0.966 to 0.981, accounting for 53.755 percent of the variance. The second factor is social media engagement, whichis explained by five variables with factor loadings ranging from 0.877 to 0.9970, accounting for 19.780 percent of the variance. The third factor issocial media influence, whichis explained by three variables with factor loadings ranging from 0.725 to.866, accounting for 17.900 percent of the variance. The factors are powerful, Table 4: Correlation Analysis

Social Media

Visibility Social Media

Engagement Social Media

Influence Brand

Preference Social Media Visibility Pearson Correlation

Sig. (2-tailed)

N 186

Social Media

Engagement Pearson Correlation 0.417**

Sig. (2-tailed) 0.000

N 186 186

Social Media

Influence Pearson correlation 0.106 −0.043

Sig. (2-tailed) 0.0158 0.563

N 186 186 186

Brand Preference Pearson correlation 0.418** 0.371** 0.333**

Sig. (2-tailed) 0.000 0.000 0.000

N 186 186 186 186

Table 5: Regression Analysis

Model R R

2

Adjusted R

2

Std. Error of the Estimate

1 0.565

a

0.320 0.308 0.40806

(8)

theoretically significant, and easy to interpret. Confirmatory factor analysis was used next to ensure that the model fit and psychometric properties were established.

Due to unavoidable circumstances during the study, the research has been restricted. The convenience sampling approach was used in this analysis. The information gathered does not possibly reflect the entire population. Anuradhapura was chosen as the location for the study. When you perform a survey, the intention is to get a representative image of a number of variables or statements within a certain target group or population. Due to practical reasons (too large, too expensive, too time-consuming, etc) it is often difficult to interrogate the total population. In that case, a sample is used. This is a selection of respondents chosen in such a way that they represent the total population as well as possible.

It is very important to use the correct sample size. Due to a lack of resources such as time, money, and distance, research is limited to Anuradhapura. If the study had been performed in other areas of Sri Lanka, the findings may have been different. Respondents are not autonomous, and they do not express their true feelings or opinions because of a variety of external factors such as the respondent’s mental state, language barriers, and ability to complete the questionnaire.

Due to the limitations of this study, a few suggestions for future research have been made. This research was performed in a limited time period, with limited resource availability, and with a limited scope level of undergraduate research.

The implication for academics and researchers is that more quantitative analysis is needed to classify social media components. The brand choice was significantly predicted by social media engagement and social media influence. The research should concentrate on evaluating the relationships between various demographic groups, such as age, gender, and income levels. Future research may also be performed to determine the effects of social media components.

References

Akar, E., & Topçu, B. (2011). An examination of the factors influ- encing consumers’ attitudes toward social media marke ting.

Journal of Internet Commerce, 10(1), 35–67. https://doi.org/

10.1080/15332861.2011.558456

Bianchi, C., & Andrews, L. (2018). Consumer engagement with retail firms through social media: an empirical study in Chile.

International Journal of Retail & Distribution Management, 46(4), 364–385. https://doi.org/10.1108/ijrdm-02-2017-0035 Budiman, S. (2021). The effect of social media on brand image and

brand loyalty in generation Y. The Journal of Asian Finance, Economics, and Business, 8(3), 1339–1347. https://doi.org/

10.13106/jafeb.2021.vol8.no3.1339

Da Costa, E. (2003). Global e-commerce strategies for small businesses. Cambridge, MA: MIT Press.

Dulek, B., & Aydin, İ. (2020). Effect of social media marketing on E-WOM, brand loyalty and purchase intent. Bingöl Üniversi tesiSosyalBilimlerEnstitüsüDergisi, 20, 271–288. http://busbed.

bingol.edu.tr/en/download/article-file/1094154

Gautam, V., & Sharma, V. (2017). The mediating role of customer relationship on the social media marketing and purchase intention relationship with special reference to luxury fashion brands. Journal of Promotion Management, 23(6), 872–888.

https://doi.org/10.1080/10496491.2017.1323262

Gupta, S., Nawaz, N., Alfalah, A. A., Naveed, R. T., Muneer, S.,

& Ahmad, N. (2021). The relationship of CSR communication on social media with consumer purchase intention and brand admiration. Journal of Theoretical and Applied Electronic Commerce Research, 16(5), 1217–1230. https://doi.org/

10.3390/ jtaer16050068

Hudson, S., Huang, L., Roth, M. S., & Madden, T. J. (2016). The influence of social media interactions on consumer-brand relationships: A three-country study of brand perceptions and marketing behaviors.International Journal of Research in Marketing, 33(1), 27–41. https://doi.org/10.1016/j.ijresmar.

2015.06.004

Ioanăs, E., & Stoica, I. (2014). Social media and its impact on consumers’ behavior. International Journal of Economic Practices and Theories, 4(2), 295–303.

Kaplan, A. M. (2015). Social media, the digital revolution, and the business of media. International Journal on Media Management, 17(4), 197–199. https://doi.org/10.1080/142412 77.2015.1120014

Kengatharan, N. (2017). Does he or she make a difference? Social network usage among employees. Journal of Business and Management Research, 5(1), 207–215.

Kim, A. J., & Ko, E. (2012). Do social media marketing activities enhance customer equity? An empirical study of luxury fashion brands.Journal of Business Research, 65(10), 1480–1486.

https://doi.org/10.1016/j.jbusres.2011.10.014

Laksamana, P. (2018). Impact of social media marketing on purchase intention and brand loyalty: Evidence from Indonesia’s banking industry. International Review of Management and Marketing, 8(1), 13–18. https://www.

econjournals.com/index.php/irmm/article/view/5838

Laroche, M., Habibi, M. R., & Richard, M. O. (2013). To be or not to be in social media: How brand loyalty is affected by social media?International Journal of Information Management, 33(1), 76–82. https://doi.org/10.1016/

j.ijinfomgt.2012.07.003

Laroche, M., Habibi, M. R., Richard, M. O., & Sankaranarayanan, R. (2012). The effects of social media-based brand communities on brand community markers, value creation practices, brand trust, and brand loyalty. Computers in Human Behavior, 28(5), 1755–1767. https://doi.org/10.1016/j.chb.2012.04.016

Mangold, W. G., & Faulds, D. J. (2009). Social media: The

new hybrid element of the promotion mix.Business Horizons,

52(4), 357–365. https://doi.org/10.1016/j.bushor.2009.03.002

(9)

Nur, D. P. E. (2021). The impact of social media on firm value:

A case study of oil and gas firms in Indonesia. The Journal of Asian Finance, Economics, and Business, 8(3), 987–996.

https://doi.org/10.13106/jafeb.2021.vol8.no3.0987

Onyango, K. (2016). Influence of digital marketing strategies on performance of cutflowers exporting firms in Kenya [MBA Research Project, University of Nairobi].

E-Repository. http://erepository.uonbi.ac.ke/bitstream/

handle/11295/98646

Paquette, H. (2013). Social media as a marketing tool: A literature review. http://digitalcommons.uri.edu/cgi/viewcontent

Sahai, S., Goel, R., Malik, P., Krishnan, C., Singh, G., & Bajpai, C.

(2018). Role of social media optimization in digital marketing with special reference toTrupay. International Journal of Engineering & Technology, 7(2), 52–59. https://doi.org/

10.14419/ijet.v7i2.11.11007

Sedeke, K. (2012). Effective fashion blogs and their impact on the current fashion industry. Erasmus University. https://thesis.eur.

nl/pub/12317/Sedeke.pdf

Situmorang, T. P., Indriani, F., Simatupang, R. A., & Soesanto, H.

(2021). Brand positioning and repurchase intention: The effect of attitude toward the green brand. The Journal of Asian Finance, Economics, and Business, 8(4), 491–499. https://doi.

org/10.13106/jafeb.2021.vol8.no4.0491

Taylor, C. R., & Costello, J. P. (2017). What do we know about fashion advertising? A review of the literature and suggested research directions. Journal of Global Fashion Marketing, 8(1), 1–20. https://doi.org/10.1080/20932685.2016.1255855 Trusov, M., Bucklin, R. E., & Pauwels, K. (2009). Effects of

word-of-mouth versus traditional marketing: Findings from an Internet social networking site.Journal of Marketing, 73(5), 90–102. https://doi.org/10.1509/jmkg.73.5.90

Verma, A., Mathur, S., & Goyal, K. (2017). Role of social media in modern marketing communication strategy. ASM Business Review, 6(1), 33. https://asmbusinessreview.in/wp-content/

uploads/2019/06/2017

Vijay, A., & Srivastava, A. (2019). Exploring the dynamic linkages between social media and present marketing practices.

International Journal on Customer Relations, 7(1), 26.

Vinerean, S., Cetina, I., Dumitrescu, L., & Tichindelean, M. (2013).

The effects of social media marketing on online consumer behavior. International Journal of Business and Management, 8(14), 66–81. https://doi.org/10.5539/ijbm.v8n14p66

Wang, S. W., Kao, G. H. Y., & Ngamsiriudom, W. (2017).

Consumers’ attitude of endorser credibility, brand, and intention with respect to celebrity endorsement of the airline sector.

Journal of Air Transport Management, 60, 10–17. https://doi.

org/10.1016/j.jairtraman.2016.12.007

수치

Figure 1: Research Model
Table 1: Factor Analysis Total Variance Explained
Table 3: Reliability of the Data
Table 5: Regression Analysis

참조

관련 문서

This study aimed to speculate on the relations between self-resilience, euphoria and social support of early childhood teachers and mediating effects of

This study confirmed that the characteristics of cyberspace, hypermedia and multi-sensory experience of new media in the fourth industrial revolution era can

In particular the earlier the first exposure time of obscene media is the higher labeling type, depressive type, aggressive type, and socialized type

The purpose of this study is to examine the relationship between the social support and mental health of university taekwondo athletes, and clearly clas sify

Children's experience of life sdtress: The role of family social support and social problem-solving skills as protective factors.. “Social competence: An

The purpose of this study is to verify whether The mediating effects of planned happenstance skills on the relationship between perceived social support

As a result, the development of Internet media allowed netizens to participate in Internet journalism, which is limited through media convergence, but can

The purpose of this study is to examine the effects of flow experience through the dance sports media, a dance sports image, and identification on