SNR Analysis for Practical Electro-Optical Camera System
Youngsun Kim*, Jong-Pil Kong, Haeng-Pal Heo, Jong-Euk Park and Young-Jun Chang
Korea Aerospace Research Institute, Eun-Dong 45, Yusung-Gu, Daejon, Korea
*[email protected] [email protected] [email protected]
[email protected] [email protected] ABSTRACT:
An electro-optical camera system consists of many subsystems such as the optics, the detector, and the electronics and so on. They may create variations in the processed image that were not present original scene. The performance analysis of the electro-optical camera system is a mathematical construct that provides an optimum design through appropriate trade off analysis. The SNR(Signal to Noise Ratio) is one of the most important performance for the electro-optical camera system. The SNR analysis shown in this paper is performed based on the practical high resolution satellite camera design. For the purpose of the practical camera design, the analysis assumes that the defined radiance, which is calculated for the Korean peninsula, reached directly to the telescope entrance. In addition, the actual operation concept such as integration time and the normal operation altitude is assumed. This paper compares the SNR analysis results according to the various camera characteristics such as the optics, the detector, and the camera electronics. In detail, the optical characteristics can be split into the focal length, F#, transmittance, and so on. And the system responsivity, the quantum efficiency, the TDI stages, the quantization noise and the analogue noise can be used for the detector and the camera electronics characteristics. Finally this paper suggests the optimum design to apply the practical electro-optical system.
KEY WORDS: SNR, Electro-optical System, Satellite Camera, Detector
1. Electro-Optical System Performance Analyses Electro-optical imaging system analysis is a mathe- matical construct that provides an optimum design through appropriate tradeoff analyses. A comprehensive model includes the target, background, the properties of the intervening atmosphere, the optical system, the detec- tor, the electronics, the display, and the human interpreta- tion of the displayed information. Finding the optimum design is an iterative decision process. Every step in the design process that has conflicting needs requires a tradeoff analysis. Many performance parameters can only be increased at the expense of another[1].
The performance of the electro-optical system such as a dark noise, a residual photo response non-uniformity, a non-linearity, a MTF(Modulation Transfer Function) and a SNR(Signal to Noise Ratio) affects direclty to camera system. Among these performance, the SNR, which is defined simply as signal level comparing to noise level, is one of the most important performance.
The SNR analysis shown in this paper is performed based on the design of the practical LEO high-resolution camera. For the practical camera design, the analysis assumes that the radiance calculated for the Korean pen- insula reached directly to the camera entrance. And the actual operation concept such as the integration time and the nominal operation altitude are assumed. This paper compares the respective SNR analyses results according to the optics, the detector and the electronics based on the practical LEO electro-optical system. In detail, the elec-
tro-optical characteristics is split into the focal length, the F#, the transmittance, the responsivity, the quantum effi- ciency, the TDI(Time Delay and Integration) stages, the quantization noise and the analog noise, and so on. In addition, this paper separates a panchromatic system and a multi-spectral system for the analysis of the band char- acteristics.
2. SNR Analysis Method and Basic Assumption The SNR depends on the various characteristics of the system and the environmental condition such as the F#
the optical transmittance, the characteristics of the detec- tor, the quantization noise of electronics and the radiance from ground, and so on. In these characteristics, some characteristics cannot be increased by the design, some can be. For example, the radiance from ground and the integration time cannot be increased by the design, but the characteristics of the optics and the electronics can be increased by design. Especially, the design or the selec- tion of the detector is the main key to increase the SNR.
2.1 SNR Analysis Method
The SNR in the electro-optical camera is defined as following;
2 2
) ( ) ( ) (
EN SN
TI OT SR Radiance
SNR +
⋅
⋅
= λ ⋅ λ λ (1)
Where SR is system the responsivity, OT is the optics transmittance, TI is the time integration, SN is the shot noise and EN is the electronics noise.
In the Eq. (1), the system responsivity relies on the de- tector pixel size, the focal length, the mirror diameter, the detector quantum efficiency and so on. The optical trans- mittance is determined by the optics design, and the time integration is decided by the operation line-rate and the TDI stages. In the noise part, the electronics noise is de- rived by the detector noise, the ADC quantization noise and the analog noise, and the shot noise is determined directly by input radiance.
Eq. (2) explains Eq. (1) in detail.
TI OT SR
Radiance
SN(λ)= (λ)⋅ (λ)⋅ (λ)⋅
) ( ) (
λ λ Energy Photon
Width and B C Efficiency Quantum
R= ⋅ ⋅
]
# [ 4
2
2 cm
F Area Pixel
C ⋅
=π⋅
2 2 2
2 RN AN QN
DN
EN= + + +
12 Noise lsb
Quant = (2)
As shown in Eq. (1), the optics design is charge of making the signal higher and the electronics design is charge of decreasing the noise. That is to say in detail, when the optics system transmits much quantity of light to the detector and the electronics decreases noise to- gether, the SNR results can be higher.
2.2 Basic Assumption for Analyses
As shown in Eq (1), the SNR depends on the radiance from the earth and the integration time. It means that the SNR can be higher when the camera is imaging the bright area comparing to the dark area. In other words, if the camera covers wider spectral bands even if the cam- era looks at the same area, the SNR can be higher. Table 1 shows the spectral bands for the panchromatic camera and the multi-spectral camera assumed in these SNR analyses. As shown in Table 1, the panchromatic camera has wider spectral bandwidth than that of each multi- spectral camera. Therefore, we can guess that the SNR of the panchromatic system will be higher than that of the multi-spectral system in the point of spectral bands.
Table 1. Panchromatic and multi-spectral bands Camera Spectral Range[nm] Center[nm]
Panchromatic
Camera 500-900 700
450-520 485 Multi-Spectral
Camera
520-600 560
630-690 660 760-900 830 When it come to the integration time, it is assumed that the line-rate for the panchromatic camera and the multi-spectral camera are 10000 lines/sec and 2000 lines/sec respectively. It means that the integration time for the multi-spectral camera is four times bigger than the panchromatic camera. Thus, the SNR for the multi- spectral camera has a benefit in the point of integration time. Table 2 summarized the basic assumption for the GSD and the line-rate used in following analyses.
Table 2. GSD and Line-rate
Camera GSD Line-rate
Panchromatic Camera 0.7m 10000 lines/sec Multi-Spectral Camera 2.8m 2500 lines/sec
Even if the radiance and the integration time are the dominant factors in the SNR calculation as explained in Eq (1), these do not have the big meaning in the system design. This is why these two items are fixed automati- cally when the system requirement is determined. In the point of the system design, it is important rather to design the optics to increase the system response and the trans- mittance and to design the electronics to decrease the electronics noise.
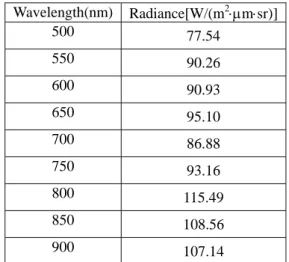
For the purpose of the practical camera system analy- ses, the analyses assume that the defined radiance shown in Table 3 shall be directly arrived to the camera tele- scope.
Table 3. Nominal radiance of Korean peninsula Wavelength(nm) Radiance[W/(m2⋅μm⋅sr)]
500 77.54
550 90.26
600 90.93
650 95.10
700 86.88
750 93.16
800 115.49
850 108.56
900 107.14
3. SNR Analysis for Practical Satellite Camera For the analysis of the practical electro-optical system, it is a key-point the assumption of the realistic optics, the electronics and the detector. The design parameter appli-
cable to the high-resolution satellite camera and the de- tector characteristics purchasable for space program are assumed for the analyses in this paper.
3.1 SNR Analyses of Panchromatic Camera
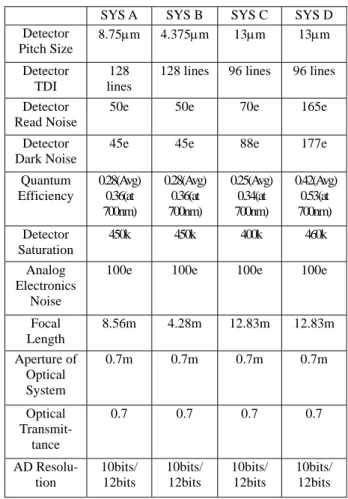
For the panchromatic system analyses, four detector samples, which are applicable to the LEO satellite cam- era design, are chosen. Furthermore, the practical optics and the electronics characteristics are applied for the high resolution satellite camera. Specially, the 10 bits or the 12 bits AD resolutions are used separately to analyze quanti- zation error effect in detail.
Table 4. Characteristics of panchromatic camera SYS A SYS B SYS C SYS D Detector
Pitch Size
8.75μm 4.375μm 13μm 13μm
Detector TDI
128 lines
128 lines 96 lines 96 lines
Detector Read Noise
50e 50e 70e 165e
Detector Dark Noise
45e 45e 88e 177e
Quantum Efficiency
0.28(Avg) 0.36(at 700nm)
0.28(Avg) 0.36(at 700nm)
0.25(Avg) 0.34(at 700nm)
0.42(Avg) 0.53(at 700nm) Detector
Saturation
450k 450k 400k 460k
Analog Electronics
Noise
100e 100e 100e 100e
Focal Length
8.56m 4.28m 12.83m 12.83m
Aperture of Optical System
0.7m 0.7m 0.7m 0.7m
Optical Transmit-
tance
0.7 0.7 0.7 0.7
AD Resolu- tion
10bits/
12bits
10bits/
12bits
10bits/
12bits
10bits/
12bits
In Table 4, the focal length can be calculated by the pitch size of the selected detector, the GSD and the alti- tude as shown in Eq. (3).
GSD Range pitch Pixel Length
Focal = ⋅ / (3)
As shown in Table 4, the same detector characteristics are used in the SYS A and the SYS B, except the differ- ence of the detector pitch size. The pitch size of the SYS B is a half of SYS A’s. When we compare the SYS C and the SYC D, the detector pitch size and the TDI stage are same, but the noise characteristics and the quantum effi- ciency are different.
Table 5 shows the SNR analyses results of panchro-
matic camera. In most of systems, the SNR results are more than 300 which looks quite good. The main reasons the SNR is lowest in the SYS C are the low quantum efficiency and the lower TDI stages. When we compare the SYS A and the SYS B, we can know that the pitch size is independent of SNR results. That is why the focal length also decreases in the condition of the fixed GSD and the altitude the as the pitch size becomes smaller. If the AD resolution is increased the 10 bits to the 12 bits, the SNR is increased, but it looks small.
As the resolution of satellite camera is increased and the integration time decreased, it is expected to the sys- tem SNR shall be decreased. But, in step with the camera performance increment, the adjustable detector TDI level also is increased by the advanced detector manufacturing techniques. So, if the detector is designed or selected prudently considering the SNR performance, we can de- sign the system, as shown in Table 5, without any SNR loss even if the integration time is decreased.
Table 5. SNR analyses results of panchromatic camera SYS A SYS B SYS C SYS D
Signal 156ke 156ke 98ke 160ke
Noise 432e 432e 364e 495e
AD 10bits
SNR 361 361 270 322
Noise 414e 414e 347e 479e
AD 12bits
SNR 376 376 284 333
3.2 SNR Analyses of Multi-spectral Camera
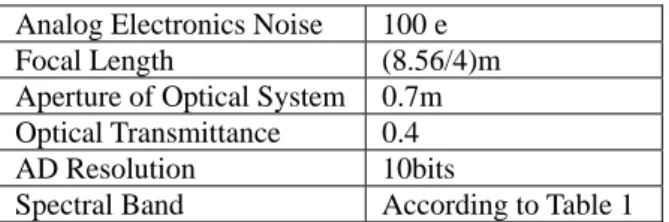
Only one detector sample, which is same to the pan- chromatic camera SYS A, is used for the multi-spectral camera system analysis. For the analysis, the bi-focal optics is considered and the focal length is a quarter of that of the panchromatic camera because the GSD is four times of the panchromatic system as shown in Table 2.
And the low optical transmittance is assumed comparing to the panchromatic system because the multi-spectral camera needs the additional optical structure such as the beam splitter. For the multi-spectral analyses, the AD resolution is fixed as the 10 bits in order to focus on the analysis for the band characteristics. Table 6 shows the characteristics of the multi-spectral camera assumed for the SNR analysis.
Table 6. Characteristics of multi-spectral camera
SYS E
Detector Pitch Size 8.75μm
Detector TDI Maximum 128 lines Detector Read Noise 50e
Detector Dark Noise 45e Detector saturation 450k
Quantum Efficiency 0.28(average) 40.36(at 700nm)
Analog Electronics Noise 100 e
Focal Length (8.56/4)m
Aperture of Optical System 0.7m Optical Transmittance 0.4
AD Resolution 10bits
Spectral Band According to Table 1 Table 7 shows the SNR analyses results of the multi- spectral camera. The SNRs, except MS1, are more than 500 which looks quite better than that of the panchromatic camera.
As shown in Table 7, the detector TDI level should be adjusted in order to prevent the detector saturation. Espe- cially, in the case of MS4, we can select only 16 TDI lines in the normal radiance condition shown in Table 3.
Generally speaking, even if the multi-spectral camera has the narrow bandwidth, the multi-spectral camera can have higher SNR results because the multi-spectral cam- era has big benefits in the time integration and in the fo- cal length. The primary reasons that MS1 has much lower SNR result comparing to other bands are the small band width in shown as Table 1 and the small radiance coming to the detector as shown in Table 3.
Table 7. SNR analysis result of multi-spectral camera
Band TDI Signal Noise SNR
MS1 128 53k 289 183
128 475k(satu) 711 668 MS2
96 357k 622 573
128 771k(satu) 895 861 MS3
64 385k 645 598
128 2381k(satu) 1692 1674 MS4
16 620k 620 571
3. Conclusion
The SNR depends on the various system characteris- tics and the environmental condition such as the F# and the optical transmittance, the detector, the ADC quantiza- tion noise and the radiance from ground, and so on. In this paper, the SNR analyses were performed based on the practical satellite camera design for the panchromatic camera and the multi-spectral camera assuming that the defined radiance reached directly to the camera entrance.
The design parameters applicable to the LEO high- resolution camera were assumed for the analyses.
The analyses of the panchromatic camera show that the SNRs of most cameras are more than 300 which looks quite good. The analyses also show that the pitch size is independent of the SNR result and the SNR is in- creased a little if the AD resolution is increased the 10 bits to the 12 bits. We can design the system without any SNR loss if the detector is designed or selected prudently considering the SNR performance in spite of the integra- tion time decrement resulted from the ground resolution increment. The SNRs of the multi-spectral camera, ex- cept MS1, are more than 500 which looks quite better
than that of the panchromatic camera. From the multi- spectral camera analysis, we can know that the detector TDI level, under the nominal radiance condition, should be adjusted in order to prevent the detector saturation.
The analysis result shows that the multi-spectral camera can have higher SNR results even if the multi-spectral camera has the narrow bandwidth. That is why the multi- spectral camera has big benefits in the time integration and in the focal length. The primary reasons that MS1 has much lower SNR result are the relative small band width and the small radiance coming to the detector.
As the further work, the SNR analyses shall be per- formed with the more accurate model as the system de- sign stage.
References
[1] G.C. Holst, 2002, Electro-Optical Imaging System Per- formance, JCD Publishing
[2] MIL-STD-454 Standard General Requirements for Elec- tronic Equipment.
[3] MIL-HDBK-454 General Guidelines for Electronic Equipment.
[4] A. P. Malvino, 1995, Electronic Principles, Los Angeles:
McGraw-Hill.
[5] EOS EGSE Software Requirement Specification.
[6] EOS EGSE Requirement Specification.
[7] EOS Specification.