http://dx.doi.org/10.7840/kics.2016.41.8.877
인지 라디오 네트워크를 위한 안전한 협력 센싱 기법
김 태 운, 최 우 열°
Secure Cooperative Sensing Scheme for Cognitive Radio Networks
Taewoon Kim, Wooyeol Choi°
요 약
본 논문에서는 인지 라디오 네트워크를 구성하는 기본요소와, 그를 위협하는 공격 유형에 대하여 살펴본다. 특 히, SSDF (Spectrum Sensing Data Falsification) 공격에 대하여 자세히 살펴보고, 이를 극복하기 위한 해법을 제 시한다. SSDF 공격은 실현하기 쉬운 반면, 이를 탐지하고 대응하기 위하여 많은 노력이 필요하다. 본 논문에서 제안하는 기법은 악의적인 사용자와 그들의 센싱 리포트를 구분해 내기 위하여 이상 탐지 (Anomaly Detection) 기술을 사용 한다. 제안하는 기법의 유효성을 검증하기 위하여 시뮬레이션을 수행 하였으며, 그 결과 비정상적인 센싱 리포트를 효과적으로 구분해 내고 활성화 된 주 사용자(Primary User)를 정확히 탐지해 내는 것을 확인 할 수 있었다.
Key Words : Cooperative Sensing, Security, Spectrum Sensing, Cognitive Radio, Wireless Network
ABSTRACT
In this paper, we introduce the basic components of the Cognitive Radio Networks along with possible threats.
Specifically, we investigate the SSDF (Spectrum Sensing Data Falsification) attack which is one of the easiest attack to carry out. Despite its simplicity, the SSDF attack needs careful attention in order to build a secure system that resists to it. The proposed scheme utilizes the Anomaly Detection technique to identify malicious users as well as their sensing reports. The simulation results shows that the proposed scheme can effectively detect erroneous sensing reports and thus result in correct detection of the active primary users.
※ 본 연구는 2016년도 정부(미래창조과학부)의 재원으로 한국연구재단의 지원을 받아 수행된 연구임(No. 2016R1C1B2009034).
※ 본 연구는 2016년 해양수산부 재원으로 한국해양과학기술진흥원의 지원을 받아 수행된 연구임(해양개발용 수중건설로봇 사업단, PJT200539).
First Author : Iowa State University, [email protected], 학생회원
° Corresponding Author : Korea Institute of Ocean Science and Technology (KIOST), [email protected], 정회원 논문번호:KICS2016-06-136, Received June 29, 2016; Revised July 19, 2016; Accepted August 19, 2016
Ⅰ. Introduction
We have seen an explosive increase in wireless devices during the last decade. In many countries, the distribution rate of WiFi-accessible smartphones
is getting higher and higher, and this trend is expected to keep going on. In addition, the success of the handheld devices has introduced a variety of applications specialized for mobile devices. A few of the most widely-used application consume the
majority of the bandwidth, such as YouTube and Netflix. Besides, the wireless services as well as devices are also used for many other purposes, such as public safety, education, manufacturing and academia.
Without a doubt, the unlicensed bands (for example the industrial, scientific and medical radio bands, also known as ISM) play a key role in this system because these bands are free from the radio regulations. In other words, the unlicensed bands are open to anyone who wants to develop applications working on the bands. However, the unlicensed bands are definitely limited, yet the demands for use are tremendously increasing. Although experts from industry and academia are looking for ways to further increase the utilization of the frequency resources, the overall demands already reached the capacity limit. To satisfy the ever-increasing bandwidth demands, the Federal Communications Commission (FCC) made more frequent bands available.
Cognitive Radio (CR) is seen as the enabler for the decision, because it can utilize a part of the bands that are already allocated to another purpose without causing much interference. FCC selected the TV bands for this purpose because these bands are largely unoccupied in many parts of the U.S., since most households and business uses cable and satellite TV services. In addition, the frequency bands dedicated for TV channels have a much favorable propagation feature that allows faraway users to be served.
In December 2003, FCC issued a Notice of Proposed Rule-Making that identifies CR as the candidate for implementing opportunistic spectrum sharing. The IEEE then formed the 802.22 Working Group to develop a standard for wireless regional area networks (WRAN)[1], which is an alternative broadband access scheme operating in unused VHF/UHF TV bands. By doing so, it is required that no interference is caused to the licensed devices, such as TV users and the FCC part 74 microphones.
Along with the development of CRN technology, the security issues in CRNs have drawn more and
more attention. In this work, we first summarize the basics of CRNs as well as some well-known security threats. Also, we propose a secure cooperative sensing scheme that can detect malicious users.
Ⅱ. Related Work
An introduction to the IEEE 802.22 standard is well summarized in [5], and an in-depth overview on the security issues on CRNs is given in [4]. The detailed description of the cooperative sensing and the security issue on the distributed, cooperative sensing is discussed in [9, 10, 17], respectively. The papers [18, 19] proposed cooperative spectrum sensing schemes to improve spectrum sensing accuracy. The authors of [18] proposed a sensing threshold optimization scheme to minimize the sensing error probability. In [19], the OR-rule based cooperative spectrum sensing scheme that minimizes the error probability was proposed.
In particular, many attempts have been made to resolve the threats under the cooperative spectrum sensing framework. The authors of [3] proposed an attack-tolerant distributed sensing protocol (ADSP).
The key point of ADSP is to let a set of neighboring sensors cooperate with each other so that they can identify outliers. Assumptions in [3]
are the SUs close to each other are clustered and the shadow fading among those are correlated. The work presented in [11] introduced a pre-filtering method to eliminate suspicious sensing reports.
However, as mentioned in [3], due to the limitation of the proposed method, there is no guarantee that the method also works well when the received signal strength is very low. The paper [13] proposed a cooperative sensing scheme to counter the spectrum sensing data falsification attack which is built upon the consensus algorithms. However, the simulation performed is limited in that the size of the network is small and the attacker’s behavior is constant and simple.
The proposed cooperative sensing scheme in the present work differs from the aforementioned works in the sense that it does not require further
processing of the received signals. In addition, the proposed scheme can work well regardless of the received signal strength. The evaluation has been done on both a large-scale and a small-scale network with different behaviors of attackers while changing the portion of the attackers present.
Ⅲ. Cognitive Radio Networks
3.1 Basics of Cognitive Radio Network (CRN) Before introducing how CRNs work, some terminologies that are widely used in this context need to be clarified. In CRNs, there are two types of users (or devices) depending on whether they have rights to access the channel. Primary User (PU) is a type of users who have the “right” to use a specific range of frequency - in other words, channel. A PU is also called as a legitimate user since they actually pay the price for occupying the channel. Common examples are Digital TV broadcasting stations. On the other hand, Secondary Users (SU) are those who want to opportunistically utilize the channel that is dedicated for some PUs.
Therefore, SUs are allowed to use the channel, i.e., transmitting signals on the channel, only when there is no active PU at the moment in order not to interfere with the PU. Therefore, CRNs should have a mechanism that guarantees PUs can access and use the channel whenever they want without being interfered by SUs.
The core technology of the CR technology consists of the following three components [2].
3.1.1 Spectrum sensing
The SUs are required to sense and monitor the radio spectrum environment within their operating frequency range to detect the presence of PUs
3.1.2 Dynamic spectrum management Cognitive radio networks are required to dynamically select the best available bands for communications
3.1.3 Adaptive communications
A cognitive radio device needs to
opportunistically configure its transmission parameters (e.g., carrier frequency, bandwidth, transmission power, etc.) in order to make the best use of the ever-changing available spectrum.
In this work, we focus on the spectrum sensing as well as some attacks on it.
3.2 Spectrum Sensing
Each SU must sense the channel to check if the channel is available or not. This is mainly because SUs should not interfere with any transmissions from PUs [1]. One of the most popular spectrum sensing technique is to use the energy detector [8].
One of the aspects that make the energy detector based technique attractive is its simplicity in terms of both implementation and computational cost. Let
be the number of samples that a SU collects by sensing the channel for a certain sensing period, and
be the sensed energy at -th sample. The test statistic for the energy detector, is given by
(1)This test statistic of the energy detector is an estimate of average received signal strength (including the noise power), and can be approximated as a Gaussian using the Central Limit Theorem (CLT) [2][3] as ∼
whenthere is no active PU, and
∼
when there is/are active PU(s), where is the received power of a PU’s signal, and is the noise power. Since we focus on a specific types of attacks that mainly happen only when there is no PU present, we will not further explain the equation in detail. We assume that the received noise at each receiver is i.i.d.3.3 Cooperative Sensing and Data Fusion Since each SU senses the channel every time when it has any packets to transmit, it should make
a decision on whether the channel is available (in other words, if there is no active PU) on its own based on its sensing report collected for a certain period of time. However, performing a cooperative sensing and decision making among a set of SUs has been known to yield a better performance in terms of the PU detection probability, because of the uncertainty in wireless channels[9]. To this end, in many practical CR networks the sensing results of several nodes are taken into account together to make the final sensing decision in order to increase the reliability of the PU detection[4].
There are, in general, three ways of making a cooperative decision, which is also called data fusion rule.
3.3.1 AND rule
If the sensing reports from ALL participating SUs say the channel is being used, the channel is regarded as being occupied by a PU.
3.3.2 OR rule
If there is at least one sensing report indicating that the channel is being used, the channel is regarded as being occupied by a PU.
3.3.3 k-out-of-n rule
If sensing reports out of sensing reports say that the channel is being used, the channel is regarded as being occupied by a PU.
In general, a CRN using the cooperative sensing has a fusion center (FC) that collects all the sensing reports from SUs that belong to the same network.
After making a decision on whether the channel is available to use or not, the FC distributes the decision to the SUs. Both the collection of the sensing reports and the distribution of the decision happen on a dedicated control channel.
Ⅳ. Attacks in CRN
In this chapter, we first introduce the classification of certain types of attacks in CRNs, and then we investigate the details of the spectrum sensing data falsification attack which is of our
interest in this paper.
4.1 Classification of attacks in CRN
Attacks in CRNs are usually classified based on the purpose of attacks - detailed classification can be found in [4]. Examples of the well-known attacks in CRNs are:
4.1.1 Receiver jamming
Malicious users introduce a noise over the channel so that the received signal at the receiver side becomes un-decodable. The jamming signal decreases the received SNR. If the received SNR is below a certain threshold, the signals cannot be decoded.
4.1.2 Eavesdropping
An eavesdropper might get access to the content of the exchanged data over the channel, and then utilize the information to gain some benefits.
4.1.3 Incumbent emulation (IE)
IE attack is only available on a certain type of networks where SUs can recognize the characteristics of the PU’s signal. Each PU has its own signature, e.g., a specific characteristic of the waveform, and SU can identify the presence of the PU by decoding the signals received. Malicious users learn the signature, and mimic the PU by transmitting the same signature when the PU is idle.
4.1.4 Spectrum sensing data falsification (SSDF)
In general, SSDF happens on the CRNs using the cooperative sensing scheme. Malicious users intentionally manipulate the sensing reports so as to deceive other SU and the fusion center.
In this work, we focus on the SSDF attack, because it is one of the easiest type of attacks to carry out. However, it might be difficult to fight against SSDF, if the CRN is not carefully designed.
4.2 Spectrum Sensing Data Falsification (SSDF)
Under the SSDF attack, malicious users manipulate the sensing reports. For example, when
Fig. 1. False alarm probability with respect to the individual false alarm probability.
the channel is idle, the received signal strength (RSS) are low because there is no signals being exchanged - all the signals sensed by SUs are white noises. An attacker, however, can report a manipulated RSS after magnifying it so as to deceive the fusion center. If the fusion center applies the OR rule, a single report from an attacker is enough to deceive the fusion center.
Some might say, then, the AND rule is more robust because it will still make a correct decision even when there are some attackers manipulating the sensing reports. For example, even though there are some sensing reports from malicious users saying that the channel is being used, when it is not, the fusion center still can determine that the channel is idle unless all sensing reports indicate the channel is busy. However, the AND rule does not always make the correct decision. For example, when the channels is being used by a PU, some malfunctioning SUs might fail to correctly sense the signals from the PU and thus report to the fusion center that the channel is idle. In this case, the fusion center determines that the channel is idle.
Under the both OR and AND rules, either attackers or malfunctioning SUs can confuse the fusion center with incorrect sensing report. In this regard, the k-out-of-n rule is regarded as the most robust solution to effectively fight against any faulty SUs so that the fusion center can correctly detect the status of the PU with high probability.
In order to augment the argument that we have
just made, we have analyzed the performance of the three different fusion rules with respect to the probability of false alarm and detection of an individual SU, which can be easily applied to the case considering the portion of malicious or malfunctioning users present. Note that malfunctioning users are as adverse as malicious users because their sensing reports do not correctly reflect the PU’s activity. Given that and are individual false alarm and detection probability, respectively, at each individual SU, the false alarm and detection probability at the FC are derived as follows:
(2)
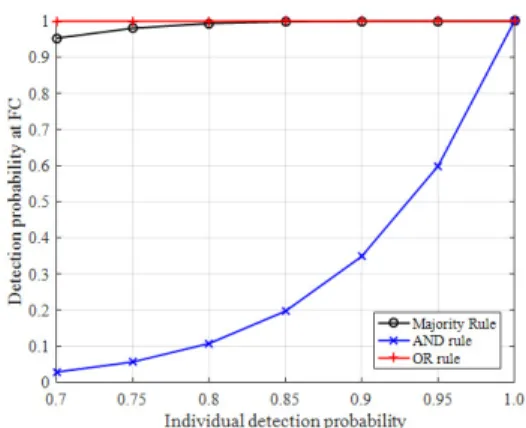
(3)where and are the false alarm and detection probability, respectively, at the FC, and is the number of the collected sensing reports. When is equal to 1 or , the fusion rule becomes the OR-rule or AND-rule, respectively. On the other hand, if ∈ , we call that the FC follows a k-out-of-n rule where k is integer. In particular, when ⌈⌉the fusion system is called the Majority rule where the channel is assumed to be busy when the majority of the sensing reports say so. The analytical results with respect to the influence of outliers (i.e., malicious and/or malfunctioning SU) are given in Fig. 1 and 2. The degree of the influence from outliers is represented by either the individual false alarm probability or the individual detection probability. In both figures, the x-axis is for the probability change of individual SU, whereas the y-axis is for the probability change at the FC.
As shown in Fig. 1, the performance of the OR-rule is highly degraded with the increase of the individual false alarm probability, while that of the AND rule has nothing to do with the change at least within the range of the individual false alarm
Fig. 2. Detection probability with respect to the individual detection probability.
probability under our consideration. In terms of the detection probability at the FC, on the other hand, the reversed results are observed. That is, as the individual detection probability decreases, the detection performance of the AND rule at the FC suffers severely, while the OR rule does not. In any cases, the performance of the Majority rule stays in between the rest two rules with maintaining a high performance.
Besides the robustness of the performance of the Majority-rule, it has a lower operational complexity compared to the rest two rules. For example, the worst case complexity of both AND and OR rule depends on the number of the collected sensing reports, which can be very large. However, the maximum number of the sensing reports that the Majority-rule needs to check is⌈⌉which is much less than the rest two rules.
Ⅴ. Proposed Scheme for Secure Cooperative Sensing
We introduce a secure cooperative sensing protocol for CRNs. The proposed protocol helps any CRNs that use the energy detection scheme to identify faulty SUs, i.e., both attackers and malfunctioning SUs. Note that it is important to take the malfunctioning SUs into our consideration because they also can degrade the performance of cooperative sensing when present[12]. Therefore, the CRNs with the proposed sensing scheme can
effectively detect the activity of the PU, and thus SUs can effectively utilize the channel without interfering any PUs.
5.1 Network Configurations and Assumptions We assumes that there is one DTV broadcasting station (PU) on the network. Multiple SUs form a cluster or a group so that they can perform a cooperative sensing. Since the coverage of DTV transmitter is large (the keep-out region of a DTV station is about 155 km [5]), there can be multiple non-overlapping clusters of SUs under the coverage of one DTV transmitter. Here, non-overlapping means a single SU is not allowed to join multiple clusters. The SUs run 802.11 MAC/PHY protocol which is CSMA/CA (Carrier Sensing Multiple Access with Collision Avoidance) with the distributed coordinate function.
5.2 Anomaly Detection
The core of the proposed protocol is to adopt one of the most widely-used techniques in both data mining and machine learning technique, called anomaly detection (AD). Anomaly detection refers to a problem of finding patterns in data that do not conform to the expected, general behavior [6]. The set of data that do not follow the expected pattern is called anomaly or outliers. Anomaly detection is a non-supervised learning that first finds the common pattern in the given set of data, and then detects the outliers that are outside the common pattern. One assumption that we make in this work is that the majority of the SUs are neither malicious nor malfunctioning. Simply speaking, more than (or at least) half of the SUs can correctly sense the channel and report their sensing result to the fusion center without modifying them.
Due to the CLT, the local test statistic (received signal strength) follows a Gaussian distribution, thus we will use Gaussian model to learn the dominating pattern in the data set (sensing reports). Specifically, we will fit a Gaussian distribution to the collection of the sensing reports and then find values that have a very low probability and hence can be considered as anomalies or outliers. The Gaussian distribution is
given by
(4)where and and are the mean and variance, respectively. As we mentioned earlier, the local test statistic of the energy detector at individual SU follows the Gaussian distribution by the CLT.
Therefore, the set of the sensing reports collected by the FC can be viewed as a set of observed values of Normal random variables with the same mean and the same variance. In this regard, we apply the Gaussian distribution to fit the sensing reports.
To perform the anomaly detection, we first need to fit a Gaussian model to the given set of sensing reports. Let be the set of sensing reports collected by a FC after a certain period of sensing.
Then, is given by
⋯ (5)
where is the index of a SU. Thus is the sensing report from the SU indexed by . Each sensing report is ∈. One sensing report might contain only one or sensing reports depending on the configuration of the protocol.
To fit a Gaussian model to the data set, the mean and the variance need to be determined. To so do, we can estimate the parameters. The mean can be estimated by
(6)
where is the index of SU and is the index of the feature (i.e., the index of the sensing results on a sensing report from SU-). The variance can also be estimated by
(7)
which is an unbiased estimator.
After fitting the Gaussian model to the set of the sensing report, we compute the probability of the sensing report to get the probability as following.
(8)
Now we can determine if , the sensing report of interest, is an outlier or not by comparing
with , which is the threshold. That is, the sensing report is anomaly if ; otherwise, is normal. Note that since the SUs are located at different places and sampling the received signals that have arrived through independent fading channels, we can assume that the sensing reports are independent as in [14][15][16].
To select the best threshold, , we use the F1
score. Specifically, we choose a threshold and get the corresponding F1 score. The F1 score is a measure of a test’s accuracy, and is defined as:
⋅⋅
(9)
It considers both the precision and recall
of the test to compute the score; is the number of correct positive results divided by the number of all positive results, and is the number of correct positive results divided by the number of positive results that should have been returned.
(10)
where is the number of true positive, is the number of false positive, and is the number of false negative. If the current yields a better F1
score than the previous best , we keep the current
Fig. 3. Frame structure.
; otherwise, keep the previous as the best-so-far threshold. We run this process for a certain number of iterations to find the best threshold.
In practice, it is implausible to assume that an FC is aware of the ongoing PU’s activity or its presence at the moment when it calculates the threshold unless the schedule of the PU is known in advance - which is not the case that we assume in this work.
However, in a retrospective manner, an FC can acquire the precise information about the recent PU’s activity. In this regard, the approach that we have adopted in this work is as follows. During each time period when the channel is predicted to be idle, the FC monitors the transmission activities to/from SUs or between SUs. In particular it overhears the transmission of the ACK which is an indication of a successful transmission. By taking both the prediction of the PU’s activity and the transmission of ACKs into consideration, an FC can classify the previous sensing reports into two: ones that reported correct sensing results, and the others that did not.
On each of the forthcoming time frames, the FC uses the previously collected and classified data to find the best threshold. In order to keep the most up-to-date knowledge about the network, the previously calculated threshold will be replaced by a new one whenever the channel is predicted to be idle. Note that an FC cannot get any information from the time frame when the PU is predicted to be busy, because it will prevent all SUs (at least the benign ones) from making any transmission during the time frame.
5.3 Protocol Procedures
The SUs belonging to the same network are assumed to be synchronized. The time is divided into fixed-length frames, and each frame is further divided into three stages: sensing stage, reporting &
decision making stage, and data transmission stage.
In addition, we assume that there is a separate channel, called control channel, which is dedicated
(i.e., free from PUs) for exchanging the sensing reports and decision.
5.3.1 Sensing stage (SS)
SUs switch to the DTV channel and sense it.
5.3.2 Reporting & decision making stage (RDMS)
SUs come back to the control channel and send their sensing reports to the FC. After receiving all the sensing reports, the FC runs the anomaly detection on the reports, and selects k sensing reports among the “normal” reports. Then runs the AND-rule on the selected k reports to get the final decision on whether the PU is present or not; which this is the Majority rule. The decision is then distributed to all SUs.
5.3.3 Data transmission stage (DTS) If the channel is predicted to be idle, SUs switch to the channel and start data transmission. If not, SUs defer the transmissions until the end of the current time frame.
Ⅵ. Implementation and Evaluation
In this section, we introduce the component- wise layout as well as the evaluation results of the proposed protocol under different scenarios.
6.1 Implementation Detail
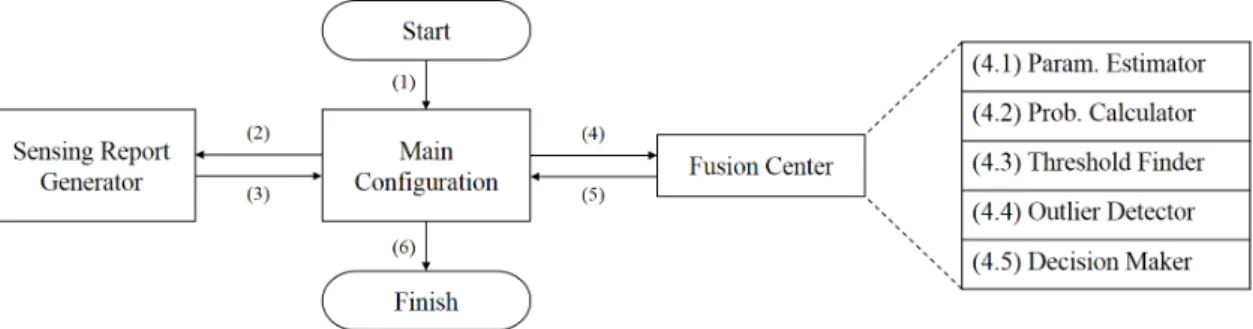
The Fig. 4 illustrates the overall flow of the implementation. When the simulation runs, the main function is first called (1). The main function configures parameters, and then calls the sensing report generator (2) with passing the parameters as arguments. The set of the generated sensing reports is returned to the main function (3), and then the sensing reports are tossed to the Fusion Center function for detecting outliers and making decision on the PU’s status. After detecting the outliers, the fusion center estimates the channel status - in other words, it checks if the PU is active or not (5). The decision made by the fusion center along with the related information are returned to the main function again.
Fig. 4. The component-wise layout of the proposed secure cooperative sensing scheme.
6.2 Simulation Setup
We have implemented the proposed scheme in MATLAB [7] to evaluate its effectiveness as a solution against the SSDF attack. Table 1 is the list of the parameters we configure for the simulation.
Common Parameters Detection Threshold -116 dBm [1]
Parameters for SUs
Number of Users 500 or 50 Number of Sensing Reports Variable Mean of the Sensed
Signal Power -128 dBm
Parameters for Attackers Number of Attackers Present Variable
Attack Distribution Type Constant, Gaussian, Uniform
Fusion Center
Fusion Rule Majority-rule
Table 1. Simulation parameters
6.3 Effect of the number of attackers on a large-scale network
In this setting, we evaluate the performance of the proposed scheme when there are malicious users present. The portion of attackers varies from 0.01 to 0.1, and we counted how many of the attackers were identified as outliers by the proposed scheme. The number of SUs, including malicious users, on the networks is set to 500, which represents a large-scale network. The simulation results are given in Table 2 and Fig. 5.
As it can be seen in both Table 2 and Figure 5, the proposed scheme correctly detected all malicious
users. In addition, the proposed scheme detected some non-attackers which were mal- functioning at the time of sensing. In sum, in all cases of the evaluations, the proposed system was able to correctly predict the presence of the PU on the channel.
No. of Attackers
Number of SUs Detected by AD as Attackers
Detection Accuracy
5 11 100%
10 13 100%
15 20 100%
20 22 100%
25 30 100%
31 34 100%
35 37 100%
40 42 100%
46 48 100%
50 51 100%
Table 2. Performance of the proposed scheme with attackers.
Fig. 5. Number of detected SUs with respect to the portion of attackers.
Fig. 7. Number of SUs detected over different attack distributions.
6.4 Comparison of attack distributions on a large-scale network
In this setting, we evaluate the performance when the attackers become more creative, and select different distributions from which to draw falsified sensing data. This may be more difficult for the algorithm to detect as the attacker may give acceptable results from time-to-time. The number of attackers in this setting is set to 10, while the rest of the configurations remain the same as before.
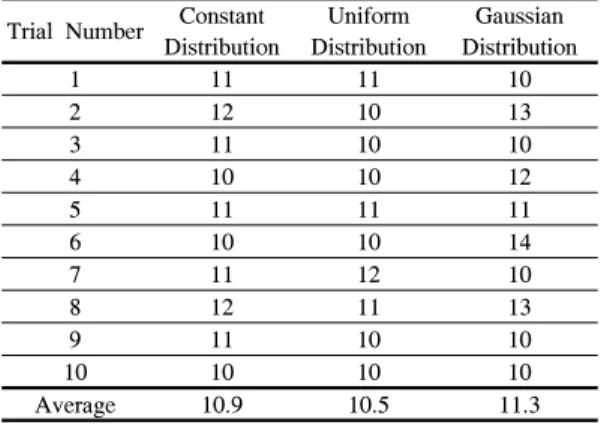
As it can be seen in Figure 6, the proposed scheme correctly detected all malicious users regardless of attack distributions. Again, there were extra outliers detected, but these were attributed to malfunctioning SU’s. Also, it is worth noting that in all cases of the evaluation, the proposed system was able to correctly predict the presence of the PU. The evaluation results are summarized in Table 3.
Fig. 6. Detected outliers over different attack distributions.
Trial Number Constant Distribution
Uniform Distribution
Gaussian Distribution
1 11 11 10
2 12 10 13
3 11 10 10
4 10 10 12
5 11 11 11
6 10 10 14
7 11 12 10
8 12 11 13
9 11 10 10
10 10 10 10
Average 10.9 10.5 11.3
Table 3. Detected outliers under different distributions.
6.5 Effect of attackers on a small- scale network
In addition, we have performed another set of simulations on a relatively small-sized network where the number of SUs is 50. The evaluation results on this network will show that the performance of the proposed system does not depend on either the size of the network or the portion of the attackers present. The portion of the attackers (i.e., malicious users) varies from 0.1 to 0.5. In other words, out of 50 SUs present on the network, the minimum and maximum number of attackers is 5 and 25, respectively. The rest of the system configurations remains the same as before.
Fig. 7 shows how the outlier detection performance changes as the portion of attackers increases. When the portion of attackers is small, between 0.1 and 0.2, inclusively, the proposed system accurately detects the attackers. However, as the portion of attackers gets larger, the proposed system tends to over-detect the outliers, meaning that a non-trivial portion of the detected outliers turned out to be benign SUs. When the portion of attackers becomes even larger, the proposed system classifies the majority of the SUs into outliers, which does not seem to be a desired outcome. The reason for the over- detection, however, is reasonable since we are under the regime of the anomaly detection. As the population of the outliers increases, it becomes harder to make a clear distinction between the majority and the minority, and thus the range of the region representing the
Fig. 8. Detection probability with respect to the portion of attackers.
Fig. 9. False alarm probability with respect to the portion of attackers.
Fig. 10. Portion of attackers identified.
abnormal behavior tends to be larger. Therefore, many of the benign SUs whose sensing results are slightly deviated from the expected ones are marked as abnormal when the portion of the outliers is large.
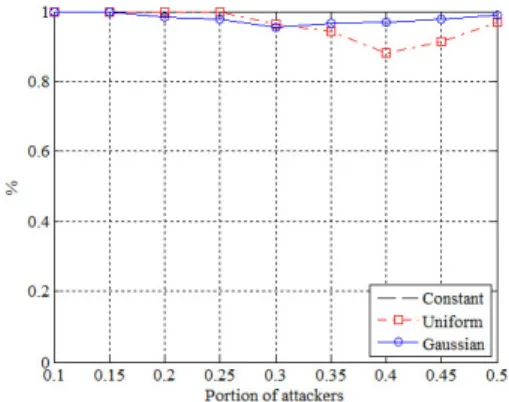
Even with its undesired, yet reasonable, over-detecting behavior, the proposed system is able to maintain a very accurate detection probability, while keep the false alarm probability very low as seen in the following Fig. 8 and Fig. 9, respectively.
What both Fig. 8 and 9 imply is that the performance of the proposed system is not much dependent upon the portion of the attackers present.
Except one of the cases when the attacker uses the uniform distribution to generate the sensing report, all the other cases satisfy the performance requirement of the IEEE 802.11 [1] which are:
probability of detection ≥ , and false alarm rate
≤ .
The main reason for the high performance even with a high portion of attackers and also a high portion of the mis-classification of benign users as outliers is that the proposed system can still successfully identify malicious users. The Fig. 10 shows the portion of attackers that are correctly identified by the proposed system as outliers.
Overall, the proposed system was able to classify over 90% of malicious users (except the one instance when the uniform distribution is used) as attackers. Since the FC makes a decision on the PU’s activity after filtering those non-trusted sensing reports out, it was able to detect the channel status with a very high accuracy which is analytically shown by both Fig. 1 and 2 in Section IV.
Ⅶ. Conclusion
In this work, we have studied the basics of the cognitive radio network that is one of the most promising technology to increase the spectral efficiency by opportunistically making use of the under-utilized spectrum bands. Then we have introduced a summary of well-known attacks in a cognitive radio network as well as a way to effectively resolve the spectrum sensing data falsification attack. In addition, we have performed extensive simulations showing that the proposed protocol is able to detect the malicious users as well as malfunctioning users, and thus makes a correct decision on the PU’s activity.
References
[1] IEEE 802.22 Wireless RAN, Functional requirements for the 802.22 WRAN standard, IEEE 802.2e, Oct. 2005.
[2] Y. Liang, Y. Zeng, E. C. Y. Peh, and A. T.
Hoang, “Sensing-throughput tradeoff for cognitive radio networks,” IEEE Trans. Wirel. Commun., vol. 7, no. 4, pp. 1326-1337, Apr. 2008.
[3] A. W. Min , K. G. Shin, and X. Hu, “Secure cooperative sensing in IEEE 802.22 WRANs using shadow fading correlation,” IEEE Trans.
Mob. Comput., vol. 10, no. 10, pp. 1434-1447, Oct. 2011.
[4] A. Attar, H. Tang, A. V. Vasilakos, F. R. Yu, and V. C. M. Leung, “A survey of security challenges in cognitive radio networks:
solutions and future research directions,” in Proc. IEEE, vol. 100, no. 12, pp. 3172-3186, Dec. 2012.
[5] C. Cordeiro, K. Challapali, and D. Birru,
“IEEE 802.22: An introduction to the first wireless standard based on cogni- tive radios,”
IEEE J. Commun., vol. 1, no. 1, pp. 38-47, Apr. 2006.
[6] V. Chandola, A. Banerjee, and V. Kumar,
“Anomaly detection : A survey,” ACM Computing Surveys, vol. 41, no. 3, Jul. 2009.
[7] MathWorks. Inc., MATLAB, http://www.
mathworks,com
[8] S. Atapattu, C. Tellambura, and H. Jiang,
“Energy detection based cooperative spectrum sensing in cognitive radio networks,” IEEE Trans. Wirel. Commun., vol. 10, no. 4, pp.
1232-1241, Jan. 2011.
[9] I. F. Akyildiz, B. F. Lo, and R. Balakrishnan,
“Cooperative spectrum sensing in cognitive radio networks: A survey,” Elsevier Phys.
Commun., vol. 4, no. 1, pp. 40-62, Mar. 2011.
[10] R. Chen, J. Park, Y. T. Hou, and J. H. Reed,
“Toward secure distributed spectrum sensing in cognitive radio networks,” IEEE Commun.
Mag., vol. 46, no. 4, pp. 50-55, Apr. 2008.
[11] P. Kaligineedi, M. Khabbazian, and V. K.
Bhargava, “Secure cooperative sensing
techniques for cognitive radio systems,” in Proc. IEEE Int. Conf. Commun., pp. 3406- 3410, Beijing, China, May 2008.
[12] S. M. Mishra, A. Sahai, and R. W. Brodersen,
“Cooperative sensing among cognitive radios,”
in Proc. IEEE Int. Conf. Commun., pp. 1658- 1663, Istanbul, Turkey, Jun. 2006.
[13] F. R. Yu, H. Tang, M. Huang, Z. Li, and P.
C. Mason, “Defense against spectrum sensing data falsification attacks in mobile ad hoc networks with cognitive radios,” in Proc.
IEEE Military Commun. Conf., pp. 1-7, Boston, United States, Oct. 2009.
[14] J. So, “Cooperative spectrum sensing for cognitive radio networks with limited reporting,” KSII Trans. Internet and Inf. Syst., vol. 9, no. 8, pp. 2755-2773, Aug. 2015.
[15] J. Ma and Y. Li, “Soft combination and detection cooperative spectrum sensing in cognitive radio networks,” in Proc. IEEE Global Telecommun. Conf., pp. 3139-3143, Washington, US, 2008.
[16] J. Ma, G. Zhao, and Y. Li, “Soft combination and detection for cooperative spectrum sensing in cognitive radio networks,” IEEE Trans.
Wirel. Commun., vol. 7, no. 11, pp. 4502- 4507, Nov. 2008.
[17] K. Kang and S. Yoo, “Efficient spectrum sensing based on evolutionary game theory in cognitive radio networks,” J. KICS, vol. 39, no. 11, pp. 790-802, Nov. 2014.
[18] N. Kim and Y. Byun, “A threshold optimization method for decentralized cooperative spectrum sensing in cognitive radio networks,” J. KICS, vol. 40, no. 2, pp.
253-263, Feb. 2015.
[19] R. Choe and Y. Byun, “OR-rule based cooperative spectrum sensing scheme considering reporting error in cognitive radio networks,” J. KICS, vol. 39, no. 1, pp. 19-27, Jan. 2014.
김 태 운 (Taewoon Kim)
2008년 2월:부산대학교 정보컴 퓨터공학과 졸업
2010년 2월:광주과학기술원 정 보기전공학과 석사
2014년 9월~현재:아이오와주 립대 전자컴퓨터공학과 박사 과정
<관심분야> 무선네트워크, IEEE802.11, HetNets, IoT
최 우 열 (Wooyeol Choi)
2008년 2월:부산대학교 정보컴 퓨터공학과 졸업
2010년 2월:광주과학기술원 정 보기전공학과 석사
2015년 8월:광주과학기술원 정 보통신공학과 박사
2015년 9월~현재:한국해양과 학기술원 재직중
<관심분야> 무선네트워크, Full-duplex, IoT, 수중통신