http://dx.doi.org/10.7839/ksfc.2012.9.4.019
Energy Efficiency & Sustainability the Cleanliness Management Role of Components and System in Automotive and Hydraulics
홍정희
1*․마이크데이
2J. H. Hong and Mike Day
Received: 01 Nov. 2011, Revised: 23 Jul. 2012, Accepted: 1 Oct. 2012 Key Words:Reliability, Energy, Efficiency, Cleanliness, Filtration
Abstract: This paper explains how eliminating contamination from the manufacturing processes will lead to
better product quality and hence the need for reworking, a trouble free commissioning period and greatly improved production efficiency. All of these will reduce costs and energy usage. It will also ensure that the product is delivered to the customer in a condition that will ensure improved reliability and longer life, again reducing both energy and other operating costs. Correctly designing the contamination control measures will achieve and maintain the level of fluid cleanliness that is required by the end user. The filter is critical to cleanliness management and should be selected with the same degree of thought and consideration as for other major components.
This paper explains the role that Cleanliness Management plays in the reducing the carbon footprint of systems and processes by making them perform more efficiently for longer periods. It also examines two differing ways of selecting filters to incorporate the features of newer designs, and shows how significant savings in the costs of ownership can be achieved using these approaches.
* Corresponding author: Jeong‐hee_Hong@pall.com
1 Pall Korea Limited. Ildong Bldg.3F. 333 Yeongdong‐
daero, Gangnam‐Gu, Seoul 135-736, Korea
2 CMS Consultant Ltd. 91 Ferndale, Waterlooville, Hants PO7 7PQ UK.
Copyright Ⓒ 2012, KSFC
This is an Open-Access article distributed under the terms of the Creative Commons Attribution Non-Commercial License (http://
creativecommons.org/licenses/by-nc/3.0) which permits unrestricted non-commercial use, distribution, and reproduction in any medium, provided the original work is properly cited.
1. INTRODUCTION
It has been long recognised that contamination, both particulate and liquid (mainly water) are the main sources of unreliability in fluid systems. Despite its’
importance, there has unfortunately been little or no research into this subject for at least 20 years so, to understand the effects, we must use rather aged references.
Rabinowicz
1)performed a study in the USA on why components require replacing and found that in 70% of
the instances the cause was attributed to surface degradation, 50% by wear and 20% by corrosion. A more practical approach was undertaken in a survey of hydraulic systems organised by the UK’s Department of Trade and Industry (DTI) in 1980
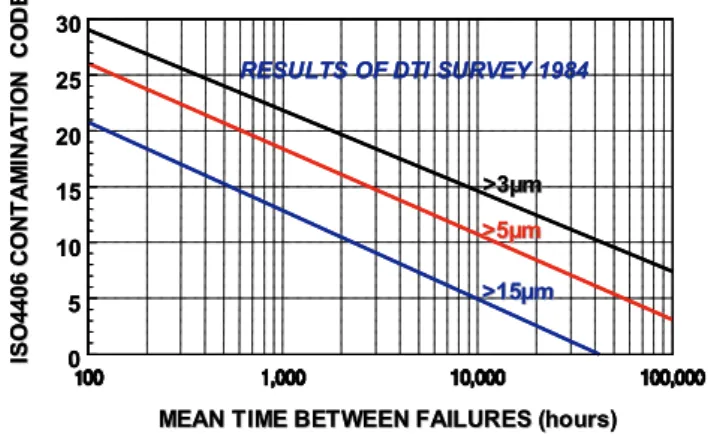
2). This study showed that 55% of the problems reported were attributed to the presence of particles (or ‘dirt’ as it was referred to) in the oil. The DTI survey made a significant contribution to the knowledge of the effects of dirt on hydraulic systems and was the first to quantify this effect.
The data from the survey gave the relationship between the concentrations of particles, as represented by the ISO 4406 solid contamination code
3)with the reliability of the systems as represented by the Mean Time Between Failures (Fig 1).
The ISO 4406 coding system is a very convenient
and simple way of representing particle count data,
where particle numbers can vary from single particles to
many millions and communicating these numbers can be
confusing. The interval between each code is effectively a doubling of contamination and the spectrum between clean and very 'dirty’ can be spanned with a convenient number of codes.
MEAN TIME BETWEEN FAILURES (hours MEAN TIME BETWEEN FAILURES (hours) 0
5 10 15 20 25 30
ISO4406 CONTAMINATION CODEISO4406 CONTAMINATION CODE
RESULTS OF DTI SURVEY 1984
>3µm
>3µm
>5µm
>5µm
>15µm
>15µm
MEAN TIME BETWEEN FAILURES (hours MEAN TIME BETWEEN FAILURES (hours) 0
5 10 15 20 25 30
ISO4406 CONTAMINATION CODEISO4406 CONTAMINATION CODE
RESULTS OF DTI SURVEY 1984
>3µm
>3µm
>5µm
>5µm
>15µm
>15µm
Fig. 1 Influence of ISO 4406 Contamination Levels on Reliability
Not surprisingly nowadays, the DTI data showed that the lower the concentration of particles the better the reliability. What cannot be seen in this graph is the increase in the scatter of the data points as the reliability improves. This is a result of other factors having a more influential effect, e.g. maintenance level, design and duty cycle, etc. Generally, the systems that were designed for contamination control and were better maintained, featured lower levels of contamination and experienced better reliability as a result. The study found that the costs of unreliability depended upon the system, where it is in the overall process and also the industry concerned. The findings of this survey were later incorporated into the very successful British Fluid Power Association (BFPA) P5 publication
4). This booklet gives valuable guidance to the design and management of systems.
Three earlier studies have looked at the costs of so called tribological failures i.e. failures to oil wetted plant and machinery. The costs identified, whilst probably not reflective of today’s costs, are really quite staggering. The figures below give both the costs reported in the study concerned and an estimate of the current Euro value, in parenthesis. The research undertaken by Rabinowicz 1) estimated that the costs to USA industry at the time were about US$ 85 billion (about €184 billion now); Bartz 5) stated in1988 that
the cost to German industry was then about DM 32 billion (about €64 billion now)) and annual savings of DM 6.4 billion (about €13 billion now) could be achieved. A later study in 1992 by the UK’s I Mech.
E’s Tribology Group 6) showed that annual savings of
£1.8 billion (about €3.5 billion now) could be realised with contamination control techniques that were available at the time. Whilst, the reliability of such equipment is much improved these days, the potential costs of unreliably are frightening, but thankfully, are redeemable with a Total Cleanliness Management (TCM) policy of that described below.
2. Reducing Costs by Total Cleanliness Management
The first thing to realize is the switch in emphasis.
In this age, we are no longer fighting to control contamination but are now able to remove it and maintain cleanliness. This has been made possible by taking a structured or “Total” approach to Cleanliness and aiming to improve every aspect of the production process. This starts with the initial design of the system, and embodies the manufacture of piece parts, the assembly of components, the assembly and commissioning of the hydraulic system and, finally, the maintenance procedures specified and implemented when the system is in service. This is often termed the
“cradle to grave” approach.
So we can see that the Total Cleanliness Management
(TCM) process is not just fitting finer filters to achieve
cleaner fluids, but more of a review of the complete
process and its subsequent improvement. To maximize
the benefits and ensure that they are long term in
nature, companies should be committed to implementing
a cleanliness programme and structure it along the lines
of a Quality Management/Continuous Improvement
process
7). This gives the discipline to properly structure
the programe and to both monitor its progress and also
improve the process. Two aspects are fundamental to
this; Management being committed to supporting and
driving the initiative, and the development of
specifications for both fluid cleanliness and the filtration
to achieve this level.
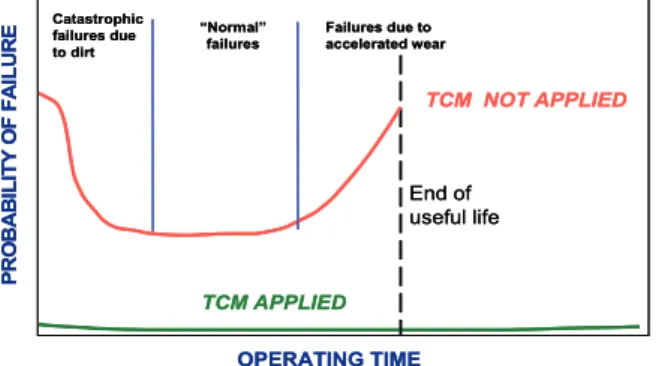
To fully understand the aims, one must understand how and when hydraulic systems fail. The life cycle of machinery can be described by the familiar "bath‐
tub" curve (Fig 2), which describes the probability or incidence of failure during the system’s life. It is divided into three phases.
At the start‐up and commissioning stage a high frequency of component failure can be experienced, often catastrophic in nature, as large particles, residual from the manufacturing and assembly processes, interfere with the operation of the components. Even if failure is not experienced, the presence of large particles will abrade the component surfaces, causing permanent damage. This will greatly reduce their service life.
TCM APPLIED
PROBABILITY OF FAILURE
TCM NOT APPLIED
Catastrophic failures due to dirt
“Normal”
failures Failures due to accelerated wear
End of useful life
OPERATING TIME TCM APPLIED
PROBABILITY OF FAILURE
TCM NOT APPLIED
Catastrophic failures due to dirt
“Normal”
failures Failures due to accelerated wear
End of useful life
OPERATING TIME
Fig. 2 "Bath tub" curve of failures
The probability of failure during service should reduce during operation as the most troublesome components are gradually replaced. It could be at a relatively high level if the life of the components has been reduced by the recirculation of abrasive particles during commissioning. Also, every time a component is replaced there is the potential for further damage as these components can be replaced by ‘dirty’
components, adding both in‐built dirt and assembly debris, so the cycle can repeat itself.
The final phase is the wear out region where the failure rate of the system components accelerates as the components come to the end of their lives within a similar period. This, therefore, results in a considerable increase in maintenance, capital and operating costs, and someone has to decide whether this is acceptable or whether the system has to be replaced. To improve the life and reliability of fluid components, the cleanliness of the system parts and components before their
assembly into the system is being addressed.
18)Cleanliness Management is designed to address all of these regions and eliminate the rate of failure or at least greatly reduce it. Any reduction in the level of breakdown is accompanied by a reduction in maintenance activity and an increase in production output. Thus, considerable savings in operating costs can be achieved by OEM and user alike. The reduction in the wear rate during service will ensure that the life of the system will be extended beyond the amortization period so the system then becomes an income generator!
3. Does a Cleanliness Management System Work?
Most industries are moving towards a TCM program due to the qualitative benefits they have seen with progressive fluid quality improvements. Unfortunately, there is no current or recent research data to quantify whether or not the reliability of hydraulic systems has improved as a result of that adoption of TCM.
However, a measure of this progress can be judged by the results of the cleanliness of existing in systems.
Figure 3 charts the average cleanliness data from a range of surveys starting with one performed by BHR Group in 1973
8)through to a smaller one organized by Pall Corporation in 2008.
21 / 16 1972
20 / 15 1983
16/ 13 1992
14 / 11 1996
14 / 11 1998
12/10/ 7 2008*
*• Using on –line or in-line monitoring
• Limited sample size ISO 4406 1999
ISO Codes Year
21 / 16 1972 21 / 1621 / 16 1972
20 / 15 1983 20 / 1520 / 15 1983
16/ 13 1992 16/ 1316/ 13 1992
14 / 11 1996 14 / 1114 / 11 1996
14 / 11 1998 14 / 1114 / 11 1998
12/10/ 7 2008* 12/10/ 712/10/ 7 2008*
*• Using on –line or in-line monitoring
• Limited sample size ISO 4406 1999
ISO Codes Year
Fig. 3 Development of Fluid Cleanliness Levels
Very little change occurred in the 8 years between
the first BHR Group survey and that undertaken by
them for the UK’s DTI in 1980‐83. However, after the
DTI field studies report was disseminated the
cleanliness of systems improved substantially. This is
shown by the analysis of oil samples submitted to the Portsmouth Laboratory of Pall Europe Ltd between 1992 and 1998. From 1983 to 1996 the improvement in system cleanliness was in the order of 60 fold.
After 1996, the cleanliness levels appear to stabilize at ISO ‐ /14/11. This is contradictory as the cleanliness levels should continue to improve, as more designers and users become aware of the benefits to be gained by better system design and improved hydraulic filter performance. This apparent stabilization is a result of the method of analysis and the true cleanliness is masked! All of the previous data was obtained by collecting oil samples in bottles analyzing them in a laboratory. This process generates extraneous contamination which, for modern clean systems, completely masks the system cleanliness. Once this external influence is removed by on/in‐line analysis then the true cleanliness level can be demonstrated
10)11). Current data shows that system cleanliness levels are still improving.
As the reliability is a function of the Cleanliness of the hydraulic fluid, the improved cleanliness would result in improvements in the reliability of the system, its life and the costs of ownership.
Another measure of the success in a TCM approach is seen in the Automotive Industry. About 10 years ago this cost sensitive industry considered that it did not require cleaner components and considered such a move to be a cost adder. The move to “common rail”
fuel systems, with the considerable increase in injector pressures drove the need for much closer tolerance injectors and provided the impetus for the adoption of a Cleanliness policy. Such a policy is now gradually being applied to most automotive components that are in contact with the working fluid, whether it be a liquid or a gas. This industry has demonstrated that there are both technical and commercial benefits to be gained, citing: improved part and system quality, improved production flow, reduced warranty costs, improved customer perception and brand image and, improved staff relationships to name a few. Furthermore, at least one major manufacturer has applied a cleanliness policy to the building of new factories so that a consistent level of cleanliness can be achieved in production.
4. The Need to Set Aleanliness Standard
The TCM process all starts with the user selecting the Required Cleanliness Level (RCL) for the system concerned. The RCL is used to define the cleanliness level that has to be achieved throughout the manufacturing process and then maintained by the filters when the system is in service. Thus, a consistent level of cleanliness will be achieved throughout the systems life.
There are a number of ways that the RCL can be selected, for example:
• Previous experience of either the operator or someone else with similar equipment.
• Recommendations by learned bodies, like Trade Associations.
• From component manufacturers, based upon the most dirt sensitive component
• From the experience of filter manufacturers
• Determining the RCL from system and user requirements (BFPA method)
Those that rely on historic data do not take into account the specific requirements of the current user and his system. Data that is historic will not be representative of today’s requirements.
The filter manufacturers are better disposed to make an informed judgment on the RCL, which should be up to date by virtue of their business. Unfortunately, because their selection is usually cleaner than the customer’s perception, the selection is often treated suspiciously! For this reason, the BFPA P5 gives a method that takes the user through an independently derived series of parameters that define the requirements of the system and the parameter that best matches the system concerned is selected, for which a score or weighting is given.
The aspects considered are:
• Pressure & duty cycle.
• Sensitivity to contaminant.
• Equipment life expectancy.
• Cost of component replacement.
• Cost of downtime.
• Safety Liabilities.
The user accumulates the scores for each category and uses a chart linking the RCL to the weighting.
This method is being developed by ISO/TC131/SC6 as an ISO document and is currently at the Committee Draft stage
11).
As stated earlier the RCL is the basis of a Cleanliness Management system as it dictates the levels of cleanliness to be achieved at various manufacturing and operating stages. ISO Standards are being written to enable the best practices to be followed, namely:
• Guidelines for achieving cleanliness in production‐
ISO TR 10949
13).
• Measuring parts and component cleanliness‐ ISO 18413
14).
• Achieving system RCL in manufacturing ‐ ISO DIS 10686
15).
• Assembly of the system ‐ Under consideration.
• Flushing of assembled systems‐ ISO 23309
16).
• Measuring and verifying the cleanliness of the manufactured system – ISO TS 16413
17).
This way the system should be delivered to the user with the minimum of problems and rework. This will greatly reduce warranty costs and make the OEM’s operation more profitable as a result. The user also benefits by getting the equipment in optimum condition and can be used immediately without those troublesome faults that often prevalent in the system’s early life.
5. SELECTING THE FILTER FOR SUSTAINABILITY AND ENERGY
EFFICIENCY
Selecting the correct grade of filter is critical to TCM, as it is the filter that has to achieve and maintain the RCL in service. If it does not, then the components will be subject to increased wear and both the level of reliability and service life will not be achieved.
The selection of the right grade of filter is complex as its performance is affected by a number of circuit conditions. This is addressed in draft ISO TR 15640
17), where the RCL is linked to the filter grade. However,
the standard does emphasize the need to monitor the system regularly to ensure that the RCL is being maintained and the filter grade is changed if it is not.
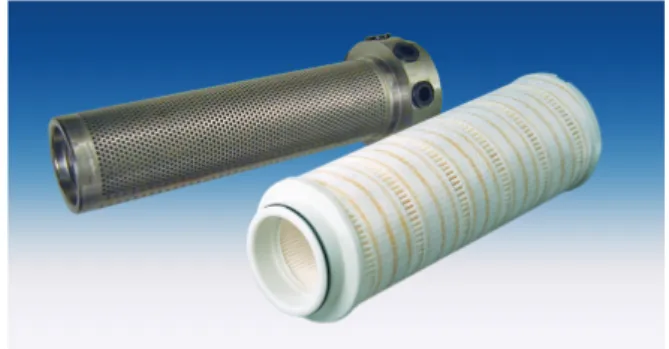
There are a series of filters that have been designed with energy conservation and efficiency in mind. One such style is coreless filters. These elements are formed with so called “fan‐pleated” construction where the media corrugations are radially spaced. The principle of these elements can be seen in Fig 4.
Fig. 4 Coreless Element & Adaptor
It has the following features and benefits:
• Contains no metallic materials, so no metal streaming is required; the support core is fixed in the housing.
• Are light, assisting handling and reduce transportation energy.
• Are easily crushed or shredded and the volume can be reduced by about 70%, thus reducing transportation energy
• Can be incinerated to generate up to 16,000 kJ/kg in waste‐to‐energy operations.
• Using reinforced polymer hardware instead of metal, the structural integrity of the filter element pack can be maintained while making it more environmentally friendly.
Flow Filtration Medium Support Layers
Flow Filtration Medium Support Layers
Fig. 5 Construction of Energy Efficient Filter
A newer, more advanced filter design utilizes the coreless concept but the media corrugations are “laid‐
over”. The construction can be seen in Fig. 5.
This construction has a number of benefits over the conventional fan pleated construction, namely:
• Pleats in elements with laid‐over pleats are designed to support each other along the entire length of the pleat. The flow resistance is the same, regardless of where along the pleat the flow passes through the medium. This creates a uniform flow velocity through the filter element and therefore uniform flow distribution and dirt build‐
up with the filtration medium.
• This should result in higher levels of cleanliness, which means less wear, improved reliability and longer life.
• Allows more filter area in the same volume.
• Gives a lower clean differential pressure in the same volume and the potential for longer service life (Fig 6a). This will reduce energy usage with all of its benefits.
Filter Service Life Differential Pressure Fan Pleat
Element
Laid-over Pleat Element
Fan Pleat Element
Laid-over Pleat Element Filter Service Life
Differential Pressure Fan Pleat Element
Laid-over Pleat Element Laid-over Pleat Element
Fan Pleat Element
Laid-over Pleat Element
a) Elements with Space Envelope
Laid-over Pleat Element Fan Pleat
Element
Filter Service Life Differential Pressure Fan Pleat
Element
Laid-over Pleat Element
Laid-over Pleat Element Fan Pleat
Element
Filter Service Life Differential Pressure Fan Pleat
Element
Laid-over Pleat Element Laid-over Pleat Element