Prediction of genomic breeding values of carcass traits using whole genome SNP data in Hanwoo (Korean cattle)
Seung Hwan Lee1*, Heong Cheul Kim1, Dajeong Lim1, Chang Gwan Dang1, Yong Min Cho1, Si Dong Kim1, Hak Kyo Lee2, Jun Heon Lee3, Boh Suk Yang1, Sung Jong Oh4, Seong Koo Hong1, Won Kyung Chang1
1National Institute of Animal Science, RDA, Sunwon 441-706, Korea
2Department of Animal Life Resources, Hankyong National University.Anseong 456-749, Korea
3Department of Animal Science and Bioechnology, hungnam National University, Daejeon 305-764, Korea
4Department of Animal Science, Jeju National University, Jeju 690-756, Korea
한우에 있어서 유전체 육종가 추정
이승환1*ㆍ김형철1ㆍ임다정1ㆍ당창권1ㆍ조용민1ㆍ김시동1ㆍ이학교2,ㆍ이준헌3ㆍ양보석1ㆍ오성종4ㆍ홍성구1ㆍ장원경1
1국립축산과학원, 2한경대학교 동물소재공학과, 3충남대학교 동물자원생명과학과, 4제주대학교 동물생명공학과 Received on 9 August 2012, revised on 21 September 2012, accepted on 22 September 2012
Abstract : Genomic breeding value (GEBV) has recently become available in the beef cattle industry. Genomic selection methods are exceptionally valuable for selecting traits, such as marbling, that are difficult to measure until later in life.
One method to utilize information from sparse marker panels is the Bayesian model selection method with RJMCMC.
The accuracy of prediction varies between a multiple SNP model with RJMCMC (0.47 to 0.73) and a least squares method (0.11 to 0.41) when using SNP information, while the accuracy of prediction increases in the multiple SNP (0.56 to 0.90) and least square methods (0.21 to 0.63) when including a polygenic effect. In the multiple SNP model with RJMCMC model selection method, the accuracy (r2) of GEBV for marbling predicted based only on SNP effects was 0.47, while the r2 of GEBV predicted by SNP plus polygenic effect was 0.56. The accuracies of GEBV predicted using only SNP information were 0.62, 0.68 and 0.73 for CWT, EMA and BF, respectively. However, when polygenic effects were included, the accuracies of GEBV were increased to 0.89, 0.90 and 0.89 for CWT, EMA and BF, respectively. Our data demonstrate that SNP information alone is missing genetic variation information that contributes to phenotypes for carcass traits, and that polygenic effects compensate genetic variation that whole genome SNP data do not explain. Overall, the multiple SNP model with the RJMCMC model selection method provides a better prediction of GEBV than does the least squares method (single marker regression).
Key words : Genomic selection, Genomic breeding value (GEBV), LD
*Corresponding author: Tel: +82-33-330-0717 E-mail address: [email protected]
I. Introduction
Recent advances in molecular biotechnology have facilitated not only detection of genes that contribute to genetic variation of quantitative traits, but also to incorporation of genomic information into conventional animal breeding programs. This DNA information is
used to estimate the genomic breeding value (GEBV) that may improve the estimated breeding value (EBV) and selection accuracy in cattle populations (Goddard and Hayes 2009). The main application for DNA marker information in animal breeding programs is marker-assisted selection (MAS), which is a method of selection that makes use of phenotype, genotype (QTL) and pedigree data (Fernando and Grossman, 1989). Genomic selection (GS), an extended model of
MAS, has the potential to improve the accuracy of estimated breeding value and to overcome some of the drawbacks that exist in the traditional BLUP, such as a relatively long generation interval. Several studies have suggested that marker-based selection methods such as MAS and GS allow for more accurate breeding value estimation than does traditional selection of young animals, especially for low heritability traits (Habier et al., 2007; Meuwissen et al., 2001; Van Raden et al., 2009).
As shown in a dense SNP panel (e.g., Bovine 50 K and 700 K panel), many markers are very close to the QTL and exist in linkage disequilibrium with it.
Therefore, some marker alleles are correlated with a positive effect on the quantitative trait across the population and can be used for selection without the need to establish a linkage phase in each family (Meuwissen et al., 2001).
In order to estimate genomic breeding value, the BLUP method assumes that all loci or genes undergo an equal amount of genetic variation [i.e., the genetic variance of a locus is Vg (total genetic variance) multiplied by the number of loci]. More recently, Bayesian approaches, namely BayesA, BayesB and BayesCpi, have been developed to capture small subsets of SNPs having a QTL effect derived from a sampled distribution of the QTL and have achieved great accuracy in estimating GEBV (Fernando and Garrick, 2008; Meuwissen et al., 2001). These Bayesian approaches have also been used in the dairy industries in many countries (Hayes et al., 2009). In the least squares method, however, we have found it difficult to estimate many effects in a limited sample size, and we do not have sufficient degrees of freedom to simultaneously cover all variables with this method (Lande and Thompson, 1990). Furthermore, selection of loci with the largest effects has resulted in the selection of over-predicted effects. In order to avoid a biased estimation of many loci, model selection approaches are required to select the best set of SNPs that explain and
predict variations in quantitative genetics. Such approaches have already been proposed for the simultaneous analysis of all SNPs in a GWAS. Lee et al. (2008) implemented this approach to predict unobserved phenotypes for complex traits using whole genome SNP data.
In this study, we applied a Bayesian model selection termed the Reversible Jump Markov Chain Monte Carlo (RJMCMC) to estimate genomic breeding values for individual Hanwoo using whole genome SNP data.
II. Material and Methods
1. Animals and phenotype data
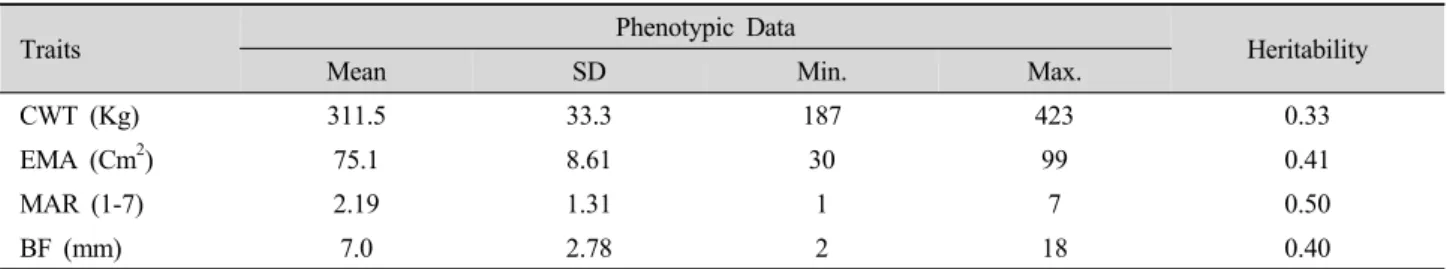
Carcass data and DNA samples were obtained from 266 Hanwoo descending from 66 sires and unrelated dams (2 - 10 progeny number per sire) from two NIAS experimental stations, Dae-Kwan-Ryoung and Nam- Won. The steers received ad libitum intake of a total mixed diet of concentrate and rice straw in total feed with a ratio of approximately 1.5:1, 2:1 and 4.5:1 for the growth period (4-12months), finishing period I (13-18 months) and finishing period II (19-24 months), respectively. Crude protein (CP) and total digestible nutrients (TDN) of the concentrate were 14-16 and 68-70%, 11-13 and 71-73% and 11% and 72-73% for the growth period, finishing period I and finishing period II, respectively. Phenotypic data in this study included carcass weight (CWT), eye muscle area (EMA), back fat thickness (BFT) and marbling score (MAR). BFT, EMA and MAR were measured at the 12th-13th rib junction after a 24 hour chill. The statistics for phenotypic data used in this study are summarized in Table 1. MAR was assessed on a scale from 1 to 7, and the degree of marbling was evaluated based on the Korean Beef Marbling Standard (BMS) from the Animal Product Grading Service in Korea.
Table 1. Summary statistics of phenotypic data on carcass traits with mean, standard deviation, min., max., and heritabilities.
Traits Phenotypic Data
Heritability
Mean SD Min. Max.
CWT (Kg) 311.5 33.3 187 423 0.33
EMA (Cm2) 75.1 8.61 30 99 0.41
MAR (1-7) 2.19 1.31 1 7 0.50
BF (mm) 7.0 2.78 2 18 0.40
Table 2. Marker number, chromosome size and map distances.
BTA SNP freq BTA length (Mb) SNP density (Mb)
1 296 145 0.49
2 252 120 0.48
3 222 129 0.58
4 207 110 0.53
5 210 132 0.63
6 232 127 0.55
7 179 138 0.77
8 192 121 0.63
9 149 110 0.74
10 179 106 0.59
11 204 127 0.62
12 151 113 0.75
13 202 93 0.46
14 176 92 0.52
15 140 96 0.69
16 158 98 0.62
17 132 110 0.83
18 124 84 0.68
19 108 93 0.86
20 138 76 0.55
21 90 95 1.06
22 139 80 0.58
23 106 71 0.67
24 117 69 0.59
25 79 64 0.81
26 103 75 0.73
27 84 66 0.79
28 76 56 0.74
29 77 69 0.90
Mean 156 99 0.63
2. Genotype assays
Genomic DNA for genotyping assays was extracted from blood samples, and SNP genotyping was performed by SeoLin Bioscience (Seoul, Korea) using the Affymetrix MegAllele GeneChip Bovine Mapping 10K SNP array.
Three hundred steers were genotyped for 8,344 SNP, but 34 steers failed to genotype due to low DNA quality from phenol and chloroform contamination. Genotyping data were received on 8,344 SNP from 266 steers, and all those SNP were physically mapped to chromosomes (in bp) using the bovine genome sequence (Btau-3.1).
3. Analysis of SNP statistics
Genotypes were tested for Hardy-Weinberg equilibrium (HWE) to identify possible genotyping errors using the Chi-square test in the R/SNPassoc Package (R Development Core Team). SNPs with HWE (p<0.05), fail to call (> 80%), monomorphic SNPs and minor allele frequency (< 0.01) were removed in this QTL study.
4. Least squares estimation (single SNP regression)
To test the association between SNP and QTL, single marker regression analysis was implemented.
Markers were assumed to be in LD with QTL in close proximity, and the evaluated effect was additive (QTL allele substitution effect). The mixed linear LD regression model was
e Za Xb
y = + +
where y is the vector of the phenotype after collecting all fixed effects including season (4 levels), location (2 levels), and age at slaughter; X is the design matrix;
b is the vector of coefficients of the regression on the single SNP genotype; Z is the incidence matrix for animal effects; a is the vector of the polygenic animal effects; and e is the vector of residuals. The log- likelihood of the above model was calculated as -0.5
[n ln(σ2e) + e׳e/σ2e], where n is the number of records;
e and σ2e denote estimates of the error deviations and error variance, respectively.
We simultaneously estimated the effects of each SNP at the QTL position using the model
e g X Zu
y
i i
i +
+ +
=
∑
=1
μ
where the summation ∑ includes all QTL positions corresponding to a likelihood peak (LR>10.8), and gi
was estimated at the peak. The genomic breeding value for all individuals was summed for all SNPs at each QTL position.
5. Multiple SNP model
We fitted a linear mixed model with multiple SNPs as the fixed effect and a polygenic effect to account for additive genetic effects not detected by the SNPs.
In the additive genetic model, the observations were a linear function of fixed effect, a polygenic term representing the sum of unidentified additive genetic effects, the additive effects due to SNPs associated with QTL and residuals. The linear model can be written as
e Zu
y
nq i
i
i +
Δ + +
=
∑
=1 α
μ
where y is the vector of the phenotype after collecting all fixed effects including season (5 levels), location (2 levels), and age at slaughter; nq is the number of SNPs associated with the QTL involved in phenotypic expression; μ is the overall mean; u is a vector of random polygenic effects; Z is an incidence matrix for the random polygenic effect; αi is the fixed effect of the ith SNP; and ∆i is a column vector of length with coefficients 0, 1 or 2 representing indicator variables of the genotype for each animal at the ith SNP. The variance structure of phenotypic observation is
written as V=Z(Aσ2u)Z׳+Iσ2e, where A is the numerator relationship matrix, I is an identity matrix, σ2u is the polygenic additive genetic variance, and σ2u is the error variance.
6. Estimation of SNP effects and model selection
Reversible Jump MCMC was used to simultaneously consider the whole genome. The number of QTLs (nq) across the whole genome involved in phenotype and the position of each QTL (ρi, i=1~nq) were sampled, and maximum likelihood (ML) estimates for polygenic effect and SNP effect were obtained for every MCMC round. In each MCMC round, the genomic breeding value for each individual was predicted based on estimates of polygenic and SNP effects. Finally, predicted genomic breeding values were averaged over all MCMC rounds as
where pr(y|nq, ρ, Θ) is the likelihood of the observed phenotypes given the sampled variables, pr(y|nq, ρ, Θ) is the joint prior probability of the variables, and the denominator is summed over the probabilities of all possible parameter states. If there are numerous parameter states, an MCMC method can be an efficient tool to obtain a posterior distribution for the parameters. When varying the number of QTLs in the model, the model dimension varies. A Metropolis- Hastings sampler cannot properly infer the correct distribution unless the model dimension is fixed.
However, a reversible jump MCMC can communicate across all possible states of different dimensions according to the proper acceptance ratio and provide the correct posterior distribution.
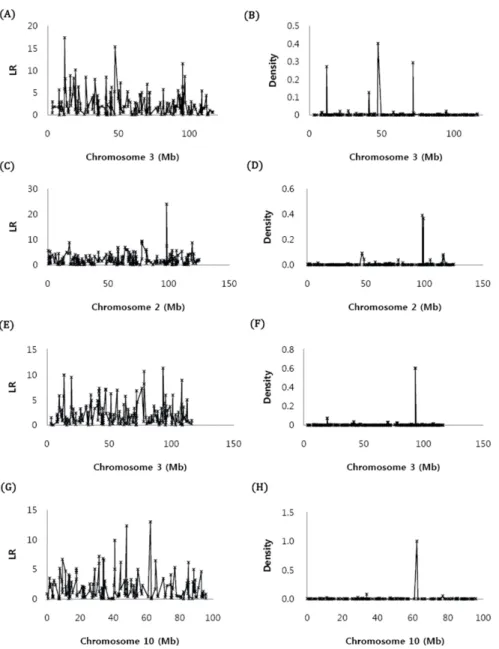
Fig. 1. Posterior density of association of SNPs for MAR (B), BF (D), CWT (F) and EMA (H) using the whole genome approach or likelihood ratio of single SNP regression (A, C, E and G) for 4 carcass traits.
7. Prediction of BLUP breeding value and genomic breeding value (GEBV)
We predicted the BLUP breeding value for the 266 genotyped animals using a numeric relation matrix (NRM) based on pedigree and phenotype from the national progeny test population. For the genomic breeding value, the prediction was performed from a multiple regression analysis using previously selected SNPs from the single SNP analyses with Bayesian model selection (RJMCMC; Fig. 1). To determined how well we predicted GEBV, we used the full set of data for
estimation (n=266) and randomly selected animals for prediction and validation (n=100). We correlated the genomic breeding value (GEBV) with the BLUP breeding value from the national progeny testing population.
III. Results and Discussion
1. Prediction of genomic breeding value using whole genome SNP data
We used 266 phenotypes in the estimation analysis and predicted 100 phenotypes. For the prediction set,
Table 3. Detection of significant SNPs from single marker regression with varying threshold to select significant SNPs and multiple SNPs (RJMCMC method).
Methods Number of significant SNPs
MAR CWT EMA BF
1)Multiple SNPs (RJMCMC model selection) 12.4 9.85 8.85 13.9
Single SNP regression
Threshold of LR=10.83 (p=0.0005) 24 16 18 41
1)Number of SNPs for multiple SNPs was averaged all significant SNPs detected in every MCMC round (n=1,000 round).
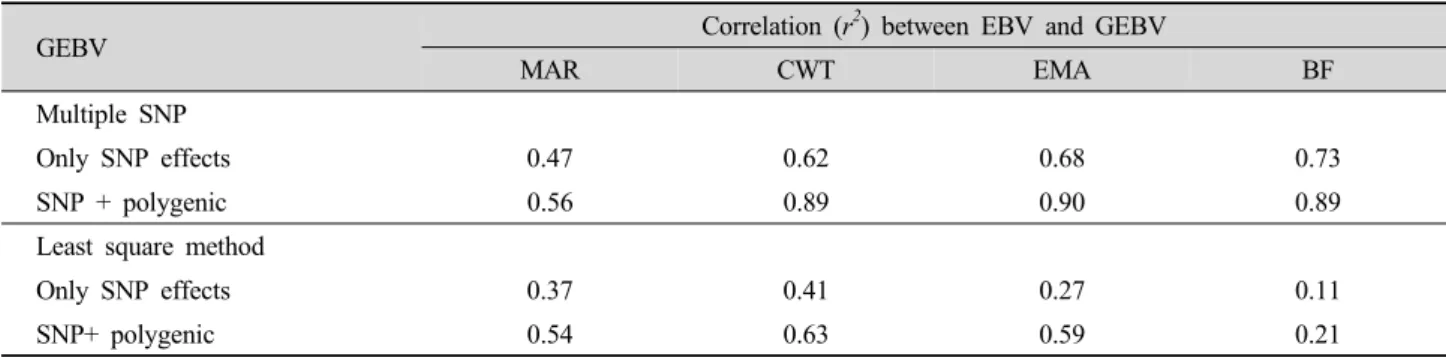
Table 4. Correlation of GEBV predicted using 4,522 SNP information to BLUP EBV.
GEBV Correlation (r2) between EBV and GEBV
MAR CWT EMA BF
Multiple SNP
Only SNP effects 0.47 0.62 0.68 0.73
SNP + polygenic 0.56 0.89 0.90 0.89
Least square method
Only SNP effects 0.37 0.41 0.27 0.11
SNP+ polygenic 0.54 0.63 0.59 0.21
a total of 266 observations were used for four carcass traits: MAR, CWT, EMA and BF. For the prediction set, an average of approximately 266 observations was used. The accuracy of GEBV predicted by the least squares method and the multiple SNP model of the four carcass traits when 4,522 SNPs were fitted into the model is shown in Table 4.
The accuracy of prediction varies in the multiple SNP model (0.47 to 0.73) and in the least squares method (0.11 to 0.41) when using SNP information, while the accuracy of prediction increases in the multiple SNP (0.56 to 0.90) and in the least squares method (0.21 to 0.63) when including the polygenic effect. In the multiple SNP model, the accuracy (r2) of GEBV for MAR predicted based only on SNP effects was 0.47, while the r2 of GEBV predicted by SNP plus polygenic effect was 0.56. The accuracies of GEBV predicted using only SNP information was 0.62, 0.68 and 0.73 for CWT, EMA and BF, respectively. However, when polygenic effects were added, the accuracies of GEBV were increased to 0.89, 0.90 and 0.89 for CWT, EMA and BF, respectively, showing that using only SNP information misses genetic variations that contribute
to phenotypes for carcass traits, and that polygenic effects compensate for genetic variation not explained by whole genome SNP data. Overall, the multiple SNP model provided a better prediction than the least squares method (single marker regression).
The least squares method allows regression of the phenotype on the genotype fitting only one SNP at a time. In this study, the least squares method showed more inaccurate breeding value prediction than the multiple SNP model, which could lead to vast overesti- mation of some haplotype effects and underestimation of others. In order to escape the overestimation, Meuwissen et al. (2001) suggested that better model selection methods need to be used to determine which QTL effects should be included in the model; for example, start with the largest QTL and next include the second largest and so on until the QTL becomes too small to be included in the multiple SNP model.
Lee et al. (2008) recently proposed a method to simultaneously analyze whole genome SNP data for association with phenotypes to predict unobserved phenotypes. For prediction of unobserved phenotypes, they applied model selection using RJMCMC to predict
genetic value, and the accuracies of unobserved phenotype prediction were higher than for single marker regression. Therefore, the accuracy of the predicted genomic breeding value in our current study suggests that Bayesian model selection using RJMCMC estimates a precise QTL effect for quantitative traits without suffering from the multiple testing problems that commonly occur in the least squares method.
2. Potential QTLs of the four carcass traits using the least squares method and multiple SNPs model
In this study, we attempt to identify QTLs associated with carcass traits and applied this information to predict genomic breeding value with whole genome SNP data in Hanwoo cattle. For the whole genome SNP data, a total of 4,525 SNPs were used for estimation of genomic breeding value for carcass traits in the Hanwoo population. SNP filtering showed that 24%
(1,873 SNP) of the total genotyped SNPs (8,522) failed to call (monomorphic SNPs) on autosome in the Hanwoo population. Twelve percent (885 SNP) of SNPs were not in Hardy-Weinberg equilibrium at the 1% signi- ficance level. A total of 912 SNPs remained in a category of unknown chromosome and unknown SNP position. SNP density per chromosome varied from 0.95 on BTA21 to 2.1 (SNP/cM) on BTA2.
The potential QTL detected from the single marker regression analysis and multiple SNP model (RJMCMC) for carcass traits are shown in Table 3. The single SNP regression analysis found 24, 16, 18 and 41 significant SNPs for MAR, CWT, EMA and BF, respectively, at the threshold of 10.83. However, the Bayesian model selection method (RJMCMC) detected the best SNP set for estimation of genomic breeding value. The model selection method identified a far smaller number of significant SNPs than did the single marker regression (Table 3).
The whole genome approach based on fitting multiple
SNPs and using RJMCMC for model selection provides a posterior density for each SNP associated with the phenotype (Fig. 1). Single marker regression on a single SNP considering one position at a time was used to compare the two models. This method provides a likelihood ratio (LR) for each SNP, which is then plotted against the genomic position (Figs. 1A, C, E and G). For the four carcass traits, the highest posterior density are shown for the regions around 47 cM on chromosome 3 (Fig. 1B), 99 cM on chromosome 2 (Fig. 1D), 93 cM on chromosome 3 (Fig. 1F) and 62 cM on chromosome 10 (Fig. 1H). The LR profile from the single SNP method was similar to that from the multiple SNP method (Figs.
1B, D, F and H).
The precision of QTL detection is an important parameter in prediction of genomic breeding value. QTL mapping assumes that some markers are in LD with QTL, and the effects of marker alleles are due to linkage with an additive QTL effect (Goddard and Hayes, 2009).
Our single SNP regression method identifies the position of QTL at a marker locus based on linkage disequilibrium, and it is easy to implement. Grapes et al. (2004) and Zhao et al. (2007) proposed that the single SNP regression model provides similar power to haplotype-based and identity by descent-based models.
However, Hayes et al. (2007) found that, in real data (9323 SNPs in Angus), using marker haplotypes would provide greater accuracy for detecting QTL than single markers. The explanation for the biased results of Grapes et al. (2004) and Zhao et al. (2007) is that the data simulating the single marker had very high LD with the QTL, thus the haplotypes accounted for noise in estimating QTL. In this study, single marker regression analysis provides a broad confidence interval compared to the multiple SNP model due to linkage disequilibrium between the QTL and multiple SNPs. In conclusion, a multiple SNP model using RJMCMC estimates a precise QTL position and shows far better accuracy of prediction for genomic breeding value.
Reference
Fernando RL, Grossman M. 1989. Marker assisted selection using best linear unbiased prediction. Genetic Selection Evolution 21: 467-477.
Fernando RL, Garrick, DJ. 2008. GenSel—User manual for a portfolio of genomic selection related analyses. Animal Breeding and Genetics, Iowa State University, Ames.
http://taurus. ansci.iastate.edu/gensel Accessed Apr. 21, 2009.
Goddard ME, Hayes, BJ. 2009. Mapping genes for complex traits in domestic animals and their use in breeding programs. Nature Review Genetics 10:381-391
Grapes L, Dekkers JCM, Rothschild MF, Fernando RL. 2004.
Comparing linkage disequilibrium-based methods for fine mapping quantitative trait loci. Genetics 166:1561-1570.
Habier D, Fernando RL, Dekkers JCM. 2007 The impact of genetic relationship information on genome-assisted breeding values. Genetics 177: 2389-2397.
Hayes BJ, Chamberlain AC, McPartlan H, McLeod I, Sethuraman L, Goddard ME. 2007. Accuracy of marker assisted selection
with single markers and marker haplotypes in cattle. Genetical Research 89: 215-220.
Hayes BJ, Bowman PJ, Chamberlain AJ, Goddard ME. 2009.
Invited review: Genomic selection in dairy cattle: Progress and challenges. Journal of Diary Science 92:433-443.
Lande R, Thompson, R. 1990. Efficiency of marker-assisted selection in the improvement of quantitative traits. Genetics 124, 743-756.
Lee SH, Van der Werf JHJ, Hayes BJ, Goddard ME, Visscher PM. 2008. Predicting Unobserved Phenotypes for Complex Traits from Whole-Genome SNP Data. PLoS Genetics 4:
e1000231.
Meuwissen THE, Hayes BJ, Goddard ME. 2001. Prediction of Total Genetic Value Using Genome-Wide Dense Marker Maps. Genetics 157: 1819-1829.
VanRaden PM, Van Tassel CP, Wiggans GR, Sonstegard TS, Schnabel RD, Taylor JF, Schenkel FS. 2009. Invited Review:
Reliability of genomic predictions for North American Holstein bulls. Journal of Dairy Science 92:16-24.
Zhao HH, Fernando RL, Dekkers JCM. 2007. Power and Precision of Alternate Methods for Linkage Disequilibrium Mapping of Quantitative Trait Loci. Genetics 175: 1975-1986.