Determination of Thermal Contact Conductance of an Injection Mold Assembly for the Prediction of Mold Surface Temperature
Ki-Yeon Lee
1, Kyeong-Min Kim
1,
andKeun Park
2,#1 Graduate School of NID Fusion Technology, Seoul National University of Science and Technology, Seoul, South Korea, 139-743 2 Department of Mechanical System Design Engineering, Seoul National University of Science and Technology, Seoul, South Korea, 139-743
# Corresponding Author / E-mail: [email protected], TEL: +82-2-970-6358, FAX: +82-2-974-8270 (Manuscript received: Sep, 10, 2012 / Revised: Nov, 23, 2012 / Accepted: Nov, 27, 2012)
Injection molds are fabricated by assembling a number of plates in which mold core and cavity components are inserted. The assembled structure causes a number of contact interfaces between each component where the heat transfer is affected by the thermal contact resistance. However, the mold assembly has been treated as a one body in numerical analyses of injection molding, which has a limitation in predicting the mold temperature distribution during the molding cycle. In this study, a numerical approach that considers the thermal contact effect is proposed to predict the heat transfer characteristics of an injection mold assembly. To find the thermal contact conductance between the mold core and plate, a number of finite element (FE) simulations were performed with the design of experiment (DOE) and statistical analysis. Thus, the heat transfer analyses using the obtained conductance values can provide more reliable results than conventional one-body simulations.
KEYWORDS: Finite element analysis; Heat transfer analysis; Injection mold; Thermal contact conductance; Thermal contact resistance, Design of experiment (DOE)
1. Introduction
Injection molding is one of the most widely used manufacturing processes to produce plastic parts in electronics and automobile industries. In the design of the injection molding process, various process parameters including the injection pressure, injection speed, resin temperature, mold temperature, and packing pressure should be investigated in order to improve the quality of the molded parts. From these parameters, the mold temperature is known to be one of most important process parameters that affects the flow characteristics, surface appearance, part deformation, mechanical properties, etc
(1).
The mold temperature is usually controlled using cooling channels or heating elements. During the mold filling stage, the mold temperature should be maintained sufficiently high to prevent solidification of the molten polymer. After the filling stage, in contrast, it should be cooled as rapidly as possible in order to reduce the cycle time. Thus, the heat transfer characteristics inside the injection molds should be carefully designed and investigated to improve the part quality and the production time and costs
(2).
Numerical analyses have been used to predict the temperature distribution of the mold under given cooling or heating conditions. In general, the temperature field of an injection mold is calculated using the finite difference method
(3)or boundary element method
(4).
the transient heat transfer problem in injection molds, coupled with mold filling simulations
(5). However, these approaches were performed under the assumption that the mold material is a single solid even though a number of components are assembled to construct the injection mold.
It is known that a thermal resistance exists when two thick solid bodies are in contact
(6); therefore, the heat flow through the interface region is affected by these contact surfaces. Thus, the effect of the thermal contact resistance in the interface region should be considered in order to more accurately predict the temperature distribution in injection molds. In the previous studies of the authors, the thermal contact effect was taken into account in numerical analysis using air gap layers which simplify the contact resistance at the interface regions
(7), and further applied to the thermal-fluid coupled analysis of injection molding
(8).
In the present study, the thermal contact effect is investigated by calculating the thermal contact conductance value. The conductance value is initially calculated by theoretical approach. FE simulations considering the thermal contact conductance are then performed to predict the heat transfer characteristics of an injection mold assembly.
Statistical analyses with the DOE are followed in order to find the optimal conductance values to minimize the simulation error compared with experimentally-measured temperature results.
ICMTE
2. Theoretical background for thermal contact resistance
When two solid bodies come into contact with each other, a temperature drop is observed at the interface between the two contact surfaces. The thermal contact conductance (h
c) is the property that indicates the thermal conductivity between the two bodies in contact.
The thermal contact resistance (R
c), which is inversely proportional to hc, is defined as the ratio of the temperature drop (∆T) to the average heat flow across the interface (q).
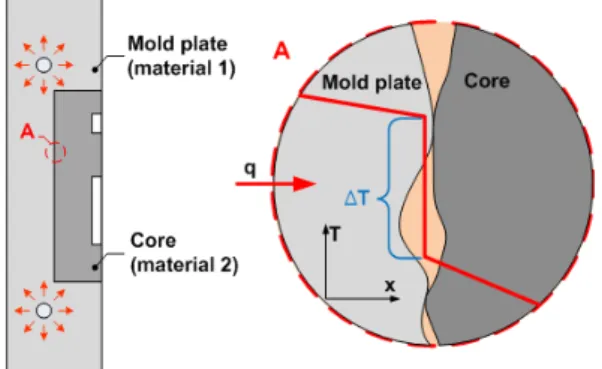
Figure 1 presents a schematic diagram of the thermal contact in an injection mold assembly in which a mold core (material 2) is inserted into a mold plate (material 1). Because the contact surfaces of these two bodies are not perfectly flat, only a few spots are actually in contact while an air gap exists at most interface regions as shown in the detailed view of Fig. 1. It is known that the actual contact region does not exceed 2% of the entire contact interface
(9).
Fig. 1 Schematic diagram of the thermal contact in a injection mold assembly
Fig. 2 Thermal-electrical analogy for the contact resistance between two solid bodies
The thermal contact resistance between two solid bodies can be calculated using the thermal-electrical analogy shown in Fig. 2. For the heat transfer from the mold plate (material 1) to the core (material 2), the overall thermal resistance (R
ovr) can be calculated using the following equation:
2 2
2 1
1 1 2
1 k A
R l A k R l R R
Rovr= + c+ = + c+
(1)
where k, A, and l represent the thermal conductivity, cross- sectional area, and length for each material, respectively. The thermal contact resistance (R
c) is expressed using the following relation:
air act
air act
c
R R
R R R
= +
(2)
where R
actand R
airdenote the thermal contact resistances of the actual contact region and the air gap region, respectively. R
aircan be expressed using the following relation
(10):
)
21 2 δ ( ε
−
=
air eff
air
k
R (3)
where δ
effis the effective height of the micro-roughness and ε is the shape factor of the contact. Thus, the thermal contact resistance for the air region can be calculated from Eq. 3 by measuring the surface roughness on the contact surface.
The contact resistance of the actual contact region (R
act) can be calculated using the following equation
(10):
η
m
act
k
R
410 1 . 2
1
= ×
(4)
where k
mis the thermal conductivity of the material in contact and η is the ratio of the actual contact area. However, this contact ratio cannot be easily determined because it depends on the micro- roughness of the contact interface. In this study, a numerical investigation is performed to determine the thermal contact resistance (conductance) inside the injection mold assembly by combining FE thermal analyses and statistical analyses with the DOE approach.
3. Investigation of the thermal contact effect in the injection mold
3.1 Initial calculation of thermal contact conductance
The injection mold assembly is composed of two components (a
mold plate and a core) as shown in Fig. 3. The specifications of these
two components are listed in Table 1. Two types of contact interfaces
exist in this mold assembly: a bottom contact interface and four side
contact interfaces. The side clearances between the mold core and
plate were designed to be 100 m in order to facilitate the assembly
procedure. The assembly clearances can be regarded as the effective
height of the micro- roughness ( δ
eff) for the side interface. The contact
conductance through the side interface (h
s) was then calculated to be
239.10 W/m
2-K using the inverse of R
airfrom Eq. (3).
Fig. 3 Configuration of injection mold assembly for the 1D heat transfer experiments
Table 1 Specifications for the injection mold assembly (unit: mm)
Part Mold plate Mold core
Material AISI-1045 steel AISI-1045 steel
Length 200 100
Width 200 100
Height 50 28
The contact conductance on the bottom contact interface (h
b) is more complicated because it includes the contact resistances in the actual contact region as well as the air gap region. The overall contact conductance was determined through a simplified one- dimensional heat transfer experiment (see Fig. 3). A flat heating element (power:
130 W) was installed on the bottom face of the mold plate and acted as a heat source with a heat flux of 4506.1 W/m
2. The contact conductance was then calculated using Eq. (5):
1
2 2 1 1 2
1
)
(
1
−⎥ ⎥
⎦
⎤
⎢ ⎢
⎣
⎡
⎟⎟ ⎠
⎜⎜ ⎞
⎝
⎛ +
− −
=
= k
l k l q
T T A h R
c
b
(5)
The measured temperature difference (∆T ) was 10.1℃ between the top of the mold core (T
2) and the bottom of the plate (T
1). Using Eq.
5, the contact conductance on the bottom interface (h
b) was then calculated to be 808.15 W/m
2-K. These contact conductance values (h
sand h
b) were then used in the numerical analyses to predict the heat transfer characteristics in the mold assembly, which is discussed in the next section.
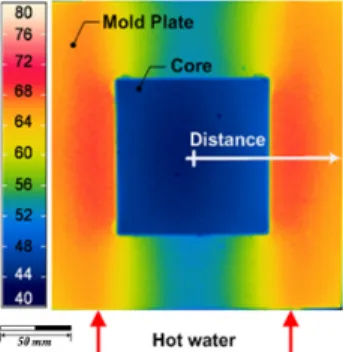
3.2 Heat transfer analysis considering thermal contact resistance In this section, the heat transfer characteristics in the injection mold are investigated through three-dimensional (3D) transient FE analyses. Experiments were also performed by circulating hot water with a temperature of 80℃ and flow rate of 13.2 l/min through the two water channels. Figure 4 illustrates the measured thermal image of the mold surface after 300 s, showing the discontinuous temperature distributions across the side contact regions. It can be seen that severe temperature drops were observed at the contact surfaces. The amount of the temperature drop from the mold plate to the mold core (∆T ) was measured to be 21.96℃ along the horizontal centerline as denoted in Fig. 4.
Fig. 4 Measured temperature distributions on the mold surface (unit: °C).
FE analyses were then performed an compared for the aforementioned experiment with and without the thermal contact consideration.
ANSYS™ was used in the transient heat transfer analysis. A quarter section of the entire domain was meshed by considering the symmetry condition as shown in Fig. 5. The material density, specific heat, and thermal conductivity for AISI-1045 steel were set to 7850 km/m
3, 486 J/kg-K, and 49.8 W/m-K, respectively. The heat convection coefficients were set to 23,234 W/m
2-K for the hot water channel and 5.0 W/m
2-K for the outer surfaces as boundary conditions
(7). To take into account the effect of thermal contact resistance, thermal contact elements in which contact conductance values were defined were used on the contact surfaces of the mold plate and core, as illustrated in Fig. 5.
Fig. 5 FE analysis domain including the mold plate, core and thermal contact elements (1/4 section).
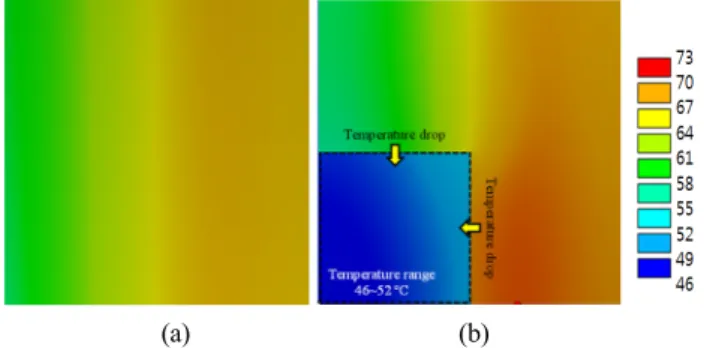
FE analysis without consideration of the thermal contact was performed first. The resulting temperature distribution on the mold surface are shown in Fig. 6 (a). It can be seen that this simulation result without consideration of the thermal contact does not show a remarkable temperature drop at the interface, which is significantly different from the experimental result.
The thermal FE analysis was then performed with considering the
thermal contact. In this analysis, the thermal contact conductance values
were set to the initially calculated values; 808.15 W/m
2-K for the
bottom interface and 239.10 W/m
2-K for the side interfaces. The
resulting temperature profile is shown in Fig. 6 (b), representing much
more similar trend to the experimental measurement.
(a) (b)
Fig. 6 Temperature distributions on the mold surface obtained from FE analyses (unit: °C): (a) w/o contact consideration and (b) with contact consideration
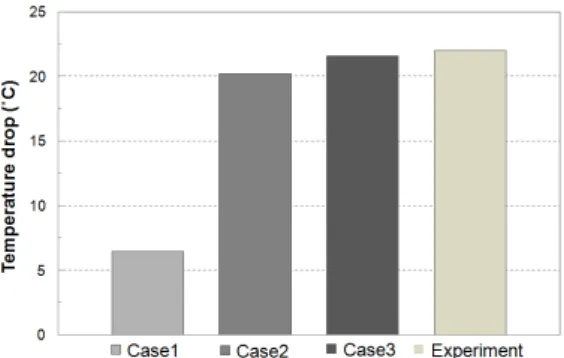
For a quantitative comparison, temperature profiles on the mold surface from two simulation results are plotted in Fig. 7. The temperature profile obtained from experimental measurement is also added for comparison. It can be seen that the simulation with the contact consideration ensures much more similar trends to the experimental result by predicting the temperature drop at the interface successfully. The amount of the temperature drop was 20.21 °C, which corresponds to an error of 7.97% in comparison with the measured value, 21.96 °C.
Fig. 7 Comparison of the temperature distributions of the mold surface
3.3 Determination of the thermal contact conductance Although the consideration of the thermal contact can predict the discontinuous temperature distribution as stated in the previous section, the numerical analysis still had an error of 7.97% in estimating the amount of the temperature drop across the interfaces.
This numerical error is caused by the approximations in analytical calculation of the thermal contact conductance. In this study, the DOE and statistical analysis were applied to determine the thermal contact conductance values for the bottom interface and side interfaces of the mold assembly.
Two thermal contact conductance values (h
sand h
b) were selected as design parameters. A full-factorial DOE was scheduled for these
these conductance values, the three levels were set to 100/200/300 W/m
2-K for h
sand 700/800/900 W/m
2-K for h
b. The response was the temperature drop on the mold surface (∆T ). Thus, the objective of this DOE is to obtain the optimal conductance values (h
sand h
b) that calculate the temperature drop as close to that of the experiment as possible.
Figure 8 shows the main effect plots for both design parameters. It can be seen that the temperature drops decrease as the contact conductance values increase in both cases, and the effect of h
sis more sensitive than that of h
b. Since these graphs show nearly linear relation, the statistical analysis can be performed using a linear regression model. Figure 9 plots the interactions between h
sand h
b, showing that no significant interaction exists. The regression equation for the temperature drop is then obtained as a function of h
sand h
b:
b
s