42
JOURNAL OF KOREAN FOREST SOCIETY
강원지역 1 영급 금강소나무에 대한 천연림과 인공림의 지상부와 지하부 상관관계
나성준
1·김장수
1·우관수
1·김혜진
2·이도형
2*
1
국립산림과학원 산림자원육성부,
2영남대학교 산림자원학과
Correlation of Above- and Below-ground Biomass Between Natural and Planted Stands of Pinus densiflora for. erecta
of One Age-class in Gangwon Province
Sung-Joon Na
1, Chang-Soo Kim
1, Kwan-Soo Woo
1, Hye-Jin Kim
2and Do-Hyung Lee
2*
1
Department of Forest Resources Development, Korea Forest Research Institute, Suwon 441-847, Korea
2
Department of Forest Resources, Yeungnam University, Gyungsan 712-749, Korea
요 약:본연구는강원지역
1
영급금강소나무를대상으로천연적으로갱신된임분과인공식재에의해성립된임분의지상부와 지하부 생체량간상호관계를 비교 분석하고
,
성립방법과 생육환경이 상이한1
영급 금강소나무의 임목 생체량 추정에적합한 회귀식을구하기 위해실시하였다.
두지역에서 각각생육중인 천연갱신된 임목과인공조림 된임목을각10
본씩전체40
본을굴취하여,
수고와근원직경,
지상부각부위별 건중량을측정하였으며,
지하부인 뿌리에대하여주근과수평근으로 구분하여각각길이,
무게,
재적을조사하였다.
지상부와지하부상관관계에서 임분의성립방법과 생육환경에 따라다소 차이가있었지만
,
천연림과 인공림모두에서 수고를제외한 지상부인자들 은뿌리길이를제외한대부분인자들과밀접한상관을나타내었다( p < 0.05).
특히임목에있어측정이용이한근원 직경은 모든조사임분에서 지상부와 지하부가 높은상관관계를 나타내어( p < 0.01)
각지상부생체량 뿐만아니라 지하부생체량추정에적합한인자인것으로나타났다.
반면,
수고는대부분의지상부와지하부인자들과낮은상관을보여
,
강원지역1
영급금강소나무의임목생체량추정에사용되는변수로서미흡한것으로나타났다.
또한본연 구에서 얻어진 회귀식은근원직경을 이용한지상부 및지하부의 생체량 추정에 기초적인 자료로유용하게 이용될 수있을것이다.
Abstract: This study was conducted to analyze correlation of above- and below-ground biomass and to drive regression equation suitable for estimating standing tree biomass between natural and planted stands of Pinus densiflora for. erecta of one age-class in Gangwon province, Republic of Korea. Total 40 trees, 10 from the naturally regenerated and 10 from the planted stands in each of two studied sites, were uprooted to measure height, diameter at root color (DRC), and the dry weights of stem, branches, and needles. The length, weight, and volume of the main and horizontal roots were also measured. Most of the above-ground traits except height were highly correlated with most of the other above-ground traits and the below-ground traits except the length of roots ( p < 0.05). Especially, the DRC, which is measured easily on the standing tree, was highly correlated with most of the traits in all studied stands ( p < 0.01). Thus, the DRC would be the most desirable trait to estimate not only above-ground biomass but also below-ground biomass. However, height was not a good variable to estimate standing tree biomass of Pinus densiflora for. erecta of one age-class in Gangwon province because it was not correlated with most of other traits. Regression equations derived from the current study could be used effectively as a basic data for estimating above-ground and below-ground biomass using DRC.
Key words : correlation , diameter at root collar (DRC), natural stand , planted stand , regression equation
*Corresponding author
E-mail: [email protected]
서 론
수목의 지상부와 지하부의 상대적 균형은 유전적 요 인과 환경적 요인에 의해 영향을 받는다 (Köstler et al ., 1968; Sanantonio, 1990; Lacointe, 2000). 또한 수목의 각 부위별 생체량은 유전적으로 고정된 높은 상관관계 가 성립하지만 , 이는 환경에 따라 변화될 수 있으며 , 이
러한 외부 환경인자에 의한 영향은 일정하지 않다
(Gruber, 1994).
통계적인 방법을 이용한 상대 생장 추정방정식은 실제
현장에서 간단하게 적용될 수 있고 (Lee, 2004a), 지상부와
지하부 생체량의 추정은 쉽게 구할 수 있는 흉고직경과 수고를 공급변수로 이용하여 쉽게 구할 수 있으며 (Bartelink, 1998; Drexhage and Gruber, 1999; Le Goff and Ottorini,
2001), 임목의 생체량 조사는 벌채 여건과 경제적 부담 , 해
당 수종 분포 등에 따른 지역적 어려움을 고려하여 회귀
식을 통한 추정이 검정된 바 있다 (Whittaker and Marks,
1975; Alban et al , 1978; Lee et al ., 1985; Park and Lee, 1990).
일반적으로 임목 생체량은 수종에 따라 크게 다르지만
(Park et al ., 1996), 동일 수종이라도 지역 (Park and Lee, 2002), 영급 (Noh et al ., 2005; Park et al ., 2005; Lee et
al ., 2006), 임분밀도 (Jin et al ., 1999) 등에 따라서도 차이
가 나타나며 , 동일한 수종과 지역이라도 해발고와 사면의 방향에 따라 다양하게 나타난다 (Kwon and Lee, 2006). 또 한 임분의 기원 및 성립방법에 따라서도 지상부 생장을 비롯한 뿌리의 생장 및 형태도 많은 차이가 있는 것으로 알려져 있다 (Plourde et al ., 2009; Na et al ., 2010). 또한
지하부인 뿌리는 임목 전체에서 차지하는 비중이 매우 크 지만 (Whittaker and Marks, 1975), 많은 시간과 노력을 요 하는 지하부 조사는 지상부 조사에 비해 연구가 미흡하여 ,
지하부 생체량 추정 회귀식의 조제를 위한 자료가 매우 부족한 실정이다 (Kim and Kim, 1988; Park and Lee, 1990).
국내에서 수행된 수목의 각 부위별 상관관계에 대한 연 구로는 여러 지역에서 조사된 독일가문비나무 (Lee, 2001)
와 소나무 (Lee, 2004a) 에 대해 지상부와 지하부의 생체량
를 추정하는 연구가 진행되었고 , 국외에서도 흉고직경과
뿌리 생체량과의 관계를 나타내는 비선형 회귀곡선을 적 용하여 상대 생장 추정식을 추정하는 다양한 연구가 진행 된 바 있지만 (Watson and O’Lounhlin, 1990; Kuiper and Coutts, 1992; Kapeluck and Van Lear, 1995; Thies and
Cunningham, 1996), 임분의 기원이 상이한 금강소나무 생
장초기 임분에 대한 상관관계 연구는 진행된 바 없다 .
이에 본 연구에서는 강원지역 2 곳의 1 영급 금강소나무 를 대상으로 모수에 의해 자연적으로 임분이 성립된 천연
림과 용기묘를 식재해 성립된 인공림간의 지상부와 지하 부의 상관관계를 비교 분석 함으로써 , 임분 기원의 차이
와 생육환경의 차이가 1 영급 금강소나무의 지상부와 지하 부 생체량 생장에 어떤 영향을 미치는지를 규명하기 위해 실시하였다 .
재료 및 방법
1. 조사대상지 및 조사목 선정
본 연구는 강원도 강릉시 소재 두 지역에 생육하는 1 영 급 금강소나무를 대상으로 그 동안 인위적·자연적 교란 이 없었거나 그 영향이 미미하였을 것으로 추정되는 천연 림 (Natural stand, Na) 과 인공림 (Planted stand, Pl) 을 각각 선정하여 실시하였다 . 임목의 생장에 있어 많은 영향을 미 치는 기후 및 토양환경에 따른 두 임분간의 생장환경 차 이를 최소화하기 위해 지리적으로 가장 가까운 두 임분을 선정하였으며 , 다양한 임분의 생장결과를 비교하기 위해
두 지역의 천연림과 인공림에 대해 각각 조사를 실시하였다 . Site 1(37° 36' N, 128° 45' E) 과 Site 2(37° 46-53' N, 128°
42-45' E) 의 천연림은 임분 상층의 모수로부터 종자가 떨
어져 자연적으로 임목이 발생되어 성립된 임분으로써 수 령이 2 년에서 10 년 이하의 금상소나무 치수가 다양하게
분포하고 있었으며 , Site 1 과 site 2 의 인공림은 1-1 묘를 2003 년에 조림하여 조사시점 (2009 년 3 월 ) 까지 5 년간 현지 에서 적응해 생육하고 있는 임분이었다 . Site 1 과 Site 2 의
해발고는 각각 870 m 와 490 m 였고 , 사면경사는 모든 임
분에서 15~25° 사이였으며 , 사면방위는 남향 ~ 남서향 이었
다 . 각 임분의 토양 pH 는 5.4~5.7 범위로 큰 차이를 보이
지 않았으며 , 토양 EC 는 모든 임분에서 0.1 ds/m 로 같은 수치가 나타났다 . 토양 용적밀도는 Site 1 과 Site 2 의 천연 림이 각각 1.33 g/cm
3와 1.25 g/cm
3로 인공림의 1.12 g/
cm
3와 1.20 g/cm
3보다 높은 값을 나타내었다 .
조사목의 선정은 각 임분별로 전체 임분을 대표할 수 있 는 곳에 가로×세로 각 10 m 의 방형구를 설치한 후 방형 구 내에 존재하는 1 영급 이하의 임목 중 생육이 건전한 임 목을 대상으로 천연임분과 인공임분에서 각 10 본씩 총 40
본을 선정하여 조사하였다 .
2. 조사방법 및 통계처리
선정된 조사목은 지표면에서 2 cm 윗부분의 지상부를 벌채하여 줄기 , 가지 , 잎으로 구분하였으며 , 지하부는 모 든 뿌리를 굴취하여 흙을 털어낸 후 생체량 분석을 위해 전량 실험실로 운반하여 조사하였다 . 지상부에 대하여 수
고 , 근원직경 , 부위별 ( 줄기 , 가지 , 침엽 , 전체 ) 건중량을 측
정하였고 , 지하부에 대하여 주근과 수평근을 구분하여 길
이 , 무게 , 재적을 구하였다 (Figure 1). 지상부에 대한 조사
로 수고를 측정하였으며 , 근원직경의 측정은 근주부분에
서 두께가 약 1.0 cm 인 원판을 채취하여 장경과 단경을
측정한 후 그 평균값 ( 심각등분법 ) 으로 구하였다 . 각 부 위별 건중량은 지상부를 줄기 , 가지 , 침엽으로 구분하여 각각 종이봉투에 담아 90
oC 건조기에서 48 시간 동안 건
조하여 0.1 g 단위로 측정하였으며 , 줄기건중량은 근원
경으로 측정하기 위해 분리된 원판의 건중량을 합하여 구하였다 .
지하부 인자들의 측정은 먼저 뿌리를 주근과 수평근으 로 구분하여 주근과 수평근의 길이 , 무게 , 재적을 각각 조 사하였으며 , 각각의 뿌리에 대해 주근과 측근의 합으로 전
체 뿌리 길이 , 전체 뿌리 무게 , 전체 뿌리 재적을 측정하 였다 . 뿌리 무게는 지상부의 건중량을 조사한 방법과 동 일하게 건조한 후 무게를 측정하였으며 , 뿌리의 재적은 조 사목의 뿌리가 일정한 형태로 발달하지 않음을 고려하여 물이 든 실린더에 표본을 넣기 전 눈금과 표본으로 넣은
후 눈금의 차로 재적으로 구하는 측용기법 (Cha et al. ,
2002) 을 이용하여 측정하였다 .
수집된 자료는 SPSS 12.0 을 이용하여 상관분석 (Pearson Bivariate Correlation Coefficient) 을 실시하였으며 , 임목에 있어 측정이 용이한 근원경을 독립변수 (X) 로 사용하고 , 지
상부인 줄기량 , 가지량 , 침엽량 , 전체 지상부량과 지하부
인 전체 뿌리무게와 재적을 종속변수 (Y) 로 하여 선형회귀 식을 구하였으며 , 전체 지상부 무게에 대해서는 전체 뿌 리의 무게와 재적에 대해 회귀식을 나타내었다 .
결 과
1. 조사목의 일반적 특성
임분 성립방법이 다른 두 지역의 각 임분에 대하여 평 균 지상부와 지하부 생체량을 조사하였다 (Figures 2 와 3).
조사목의 평균 수고는 Site 2 의 천연림이 199.0 cm 로 다
른 세 곳의 임분보다 매우 좋은 생장을 보였고 , 근원직경
또한 4.7 cm 로 가장 큰 것으로 나타났으며 , 줄기 건중량
을 비롯한 다른 부분의 건중량 역시 Site 2 의 천연림이 가
장 좋은 생장을 보여 지상부 전체 건중량에서 가장 높은 값이 나타났다 (Figure 2). Site 1 의 천연림의 평균 수고는 146.2 cm 로 Site 1 과 2 의 인공림 (Site 1 : 83.9 cm, Site
2 : 93.1 cm) 보다 높았으나 , 조사목 평균 근원직경은 세 임
분의 값이 유사하였다 . 지상부 전체 건중량에서도 Site 2
의 천연림을 제외하고는 큰 차이를 보이지 않았다 .
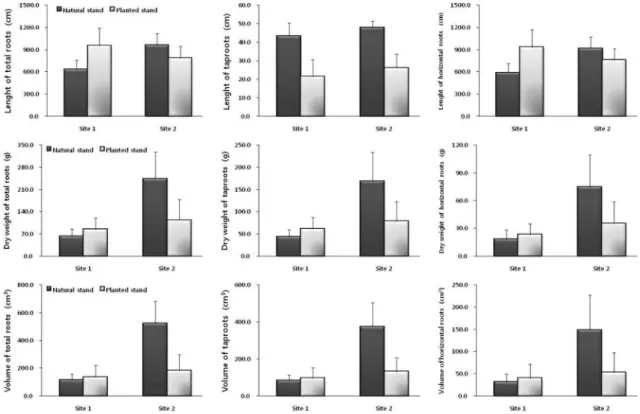
지하부인 뿌리의 전체 길이는 Site 2 의 천연림 (962.2
cm) 과 Site 1 의 인공림 (954.7 cm) 이 유사한 값을 나타내었 으며 , 다음으로 Site 2 의 인공림 (784.4 cm) 과 Site 1 의 천 연림 (632.8 cm) 순이었다 (Figure 3). 주근의 길이는 Site 1
과 2 의 인공림이 21.5-26.3 cm 범위의 생장을 보인 반면 ,
천연림은 43.3-47.8 cm 의 범위의 길이생장을 한 것으로 나
타나 , 천연림이 인공림보다 우수한 주근의 길이생장으로 보여주었다 . 수평근의 길이는 Site 1 에서 인공림이 933.2 cm 로 천연림의 589.5 cm 에 비하여 길었지만 , Site 2 에서 는 오히려 인공림이 758.3 cm 로 천연림의 914.4 cm 에 비
Figure 1. Schematic picture of the traits that were measured for the above- and below-ground biomass.
하여 낮은 값을 나타내었다 .
전체 뿌리 건중량은 Site 2 의 천연림이 243.0 g 으로 가 장 큰 값을 나타내었고 , 다음으로 Site 2 의 인공림이 113.8 g
의 값을 나타내었다 . Site 1 에서는 오히려 천연림이 61.7 g 으
로 인공림의 84.3 g 에 비해 가장 낮은 값을 나타내었다 . 주
근과 수평근의 건중량도 Site 2 의 천연림이 가장 높은 값
을 타내었고 , Site 2 의 천연림이 가장 낮은 값을 나타내었
다 . 또한 뿌리의 전체 재적 및 주근과 수평근의 재적도 유 사한 결과를 나타내었는데 , 이는 뿌리의 무게와 재적이 서 로 밀접한 관련이 있기 때문에 나타난 결과라 생각된다 .
지상부의 생체량 결과를 종합해 보면 , Site 2 의 천연림
은 인공림에 비해 매우 우수한 생장으로 보인 반면 , Site
1 의 천연림과 인공림은 유사한 생체량을 보였다 . 반면 , 지
하부 생체량에 있어 Site 1 은 전체적으로 주근의 길이를
제외한 모든 뿌리의 생장에서 인공림이 천연림에 비해 다 소 우수한 생장을 나타내었지만 , Site 2 는 주근의 길이를
포함한 모든 뿌리의 생장이 인공림보다 천연림이 더 높은 값을 나타내어 , 성립방법에 따른 두 임분간의 생장 차이 가 나타나는 것뿐만 아니라 생육환경에 따른 수목의 생체 량도 차이가 있는 것으로 나타났다 .
Figure 2. Comparison of above-ground biomass of natural and planted stands in two studied sites. DRC : Diameter at root collar, AGTW : Above-ground total dry weight.
Figure 3. Comparison of below-ground biomass of natural and planted stands in two studied sites.
Table 1. Correlation coefficients among above- and below-ground traits of natural and planted stands of
P. densiflorafor.
erectain two studied sites.
H DRC SW BW NW AGTW
Above -ground
Diameter at root collar (DRC)
Site 1 Na -0.08
Pl -0.58
Site 2 Na -0.77**
Pl -0.56
Stem dry weight (SW)
Site 1 Na -0.28 -0.93**
Pl -0.85** -0.91**
Site 2 Na -0.85** -0.97**
Pl -0.80** -0.93**
Branch dry weight (BW)
Site 1 Na -0.20 -0.92** -0.85**
Pl -0.24 -0.23 -0.03
Site 2 Na -0.49 -0.77** -0.79**
Pl -0.58 -0.87** -0.82**
Needle dry weight (NW)
Site 1 Na -0.15 -0.77** -0.73* -0.93**
Pl -0.72* -0.95** -0.94** -0.09
Site 2 Na -0.41 -0.77** -0.77** -0.90**
Pl -0.62 -0.92** -0.92** -0.87**
Above-ground total dry weight (AGTW)
Site 1 Na -0.23 -0.93** -0.92** -0.98** -0.93**
Pl -0.60 -0.94** -0.86** -0.45 -0.93**
Site 2 Na -0.67* -0.91** -0.94** -0.94** -0.93**
Pl -0.68* -0.94** -0.94** -0.95** -0.97**
Below -ground
Length of total roots (LTR)
Site 1 Na -0.02 -0.27 -0.38 -0.02 -0.01 -0.16
Pl -0.38 -0.28 -0.38 -0.12 -0.18 -0.27
Site 2 Na -0.16 -0.31 -0.32 -0.00 -0.17 -0.20
Pl -0.25 -0.02 -0.11 -0.11 -0.15 -0.13
Length of taproots (LT)
Site 1 Na -0.02 -0.77** -0.77** -0.73* -0.56 -0.74*
Pl -0.34 -0.35 -0.40 -0.35 -0.23 -0.12
Site 2 Na -0.43 -0.24 -0.28 -0.46 -0.18 -0.33
Pl -0.42 -0.67 -0.60 -0.52 -0.37 -0.51
Length of horizontal roots (LHT)
Site 1 Na -0.02 -0.23 -0.34 -0.03 -0.02 -0.12
Pl -0.39 -0.28 -0.39 -0.10 -0.18 -0.27
Site 2 Na -0.15 -0.30 -0.31 -0.01 -0.17 -0.19
Pl -0.27 -0.01 -0.14 -0.14 -0.17 -0.16
Dry weight of total roots (WTR)
Site 1 Na -0.01 -0.89** -0.76* -0.86** -0.81** -0.86**
Pl -0.56 -0.93** -0.86** -0.02 -0.89** -0.79*
Site 2 Na -0.37 -0.62 -0.64* -0.59 -0.77** -0.70*
Pl -0.43 -0.96** -0.82** -0.87** -0.90** -0.91**
Dry weight of taproot (WT)
Site 1 Na -0.10 -0.80** -0.77** -0.82** -0.80** -0.84**
Pl -0.46 -0.86** -0.76* -0.03 -0.81** -0.71*
Site 2 Na -0.28 -0.36 -0.43 -0.43 -0.57 -0.50
Pl -0.35 -0.91** -0.76* -0.80** -0.89** -0.86**
Dry weight of horizontal roots (WHT)
Site 1 Na -0.11 -0.84** -0.61 -0.77** -0.67* -0.72*
Pl -0.70* -0.96** -0.94** -0.01 -0.93** -0.85**
Site 2 Na -0.36 -0.82** -0.74* -0.63* -0.80** -0.77**
Pl -0.52 -0.92** -0.83** -0.90** -0.80** -0.89**
Volume of total roots (VTR)
Site 1 Na -0.06 -0.87** -0.78** -0.81** -0.74* -0.83**
Pl -0.74* -0.93** -0.95** -0.05 -0.90** -0.81**
Site 2 Na -0.54 -0.73* -0.80** -0.77** -0.81** -0.85**
Pl -0.42 -0.96** -0.82** -0.89** -0.91** -0.92**
2. 지상부와 지하부 상관관계
조사목의 지상부 생체량간의 상관관계를 Table 1 에 나 타내었다 . 수고에 대한 지상부 인자간의 상관관계에서는 수고를 제외한 모든 측정 인자들 간에는 높은 상관을 보 였다 . 지상부의 수고는 근원직경과 줄기 무게 등 몇몇 인
자들을 제외한 대부분의 상대측정항목간에 상관 관계가 나타나지 않았다 . 그러나 일반적으로 측정이 용이한 근원 경에 대한 지상부 인자간의 상관관계는 Site 1 의 인공림에 서 가지건중량을 제외한 모든 지역과 임분에서 높은 상관 관계를 나타내었으며 , 줄기 건중량에 대한 지상부 인자간
의 상관관계도 유사한 결과가 나타났다 . 가지건중량에 대 한 지상부 인자간의 상관관계는 Site 2 에서 천연림과 인공 림이 모든 인자들간에 높은 정의상관을 보인 반면 , Site 1
에서는 천연림만이 높은 상관관계를 나타내었다 . 침엽의 건중량과 지상부 전체 건중량 또한 두 지역의 모든 임분 에서 지상부 인자들간에 높은 상관 관계를 나타내었다 .
지상부와 지하부간의 상관관계를 살펴보면 , Site 1 의 천 연림을 제외한 나머지 임분에서는 각 지상부 인자들과 전 체 뿌리길이 , 주근의 길이 , 수평근의 길이 간에는 상관관 계가 나타나지 않았다 . 또한 수고와 각 지하부 인자간의
상관관계에서도 두 지역의 각 임분 모두에서 거의 대부분 의 인자들과 상관관계가 나타나지 않았다 . 하지만 지역 및 성립방법이 다른 임분간에 다소 차이는 있지만 , 근원경을 비롯한 나머지 지상부 인자들은 각 지하부 인자들과 대부
분 높은 정의 상관을 나타내고 있다 . 한편 Site 2 의 천연림
은 지상부 인자와 주근의 건중량 , 재적과 상관관계가 나
타나지 않아 다른 임분들과 상이한 결과를 나타내었다 .
3. 근원직경에 대한 지상부와 지하부 생체량 추정 본 연구에서는 어렵게 뿌리를 굴취하지 않아도 회귀식을 통하여 측정이 손쉬운 흉고직경을 이용하여 전체 뿌리 생 체량을 간접적으로 추정할 수 있도록 각 임분에서 근원직 경에 대한 지하부의 전체 건중량 및 재적과의 선형회귀식
을 구하였다 . 측정이 용이한 근원직경 (DRC) 을 독립변수 (X)
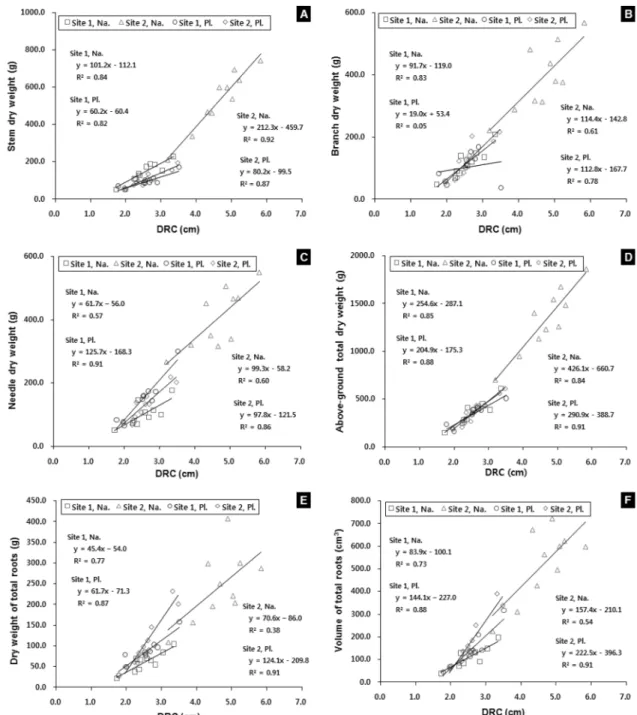
로 하고 지상부 생체량 변수인 줄기 , 가지 , 침엽 , 지상부 전체 건중량을 종속변수 (Y) 로 하여 두 지역의 천연림과 인 공림에서 근원직경에 대한 상호관계를 알아보았다 (Figure 4). 근원직경과 줄기건중량과의 회귀식은 Site 1 에서 천연 림과 인공림이 각각 Y=101.2X-112.1(r
2=0.84) 과 Y=60.2X- 60.4(r
2=0.82) 이고 , Site 2 에서는 천연림이 212.3X-459.7 (r
2=0.92), 인공림이 Y=80.2X-99.5(r
2=0.87) 이었으며 , 그 결 정계수는 모든 임분에서 높은 값을 나타내었다 (Figure 4A).
근원직경과 가지건중량의 선형회귀식에서 결정계수는 두
지역의 천연림과 Site 2 의 인공림은 높은 상관관계가 나타
났으나 , Site 1 의 인공림은 낮은 결정계수 값을 나타내었
다 (Figure 4B).
근원직경에 대한 침엽건중량은 그 회귀식이 두 지역의 천연림이 각각 Y=61.7X-56.0(r
2=0.57) 과 Y=99.3X-58.2
(r
2=0.60) 로 나타났으며 , 인공림은 두 지역에서 각각
Y=125.7X-168.3(r
2=0.91) 과 Y=97.8X-121.5(r
2=0.86) 로 나 타나 모든 임분에서 높은 결정계수 값이 나타났으나 , 인공 림의 결정계수 값이 천연림보다 높은 것으로 나타났다 (Figure
4C). 근원직경과 지상부 전체 건중량과는 Site 1 의 천연림
과 인공림이 각각 Y=254.6X-287.1(r
2=0.85) 과 Y=204X- 175.3(r
2=0.88) 이었으며 , Site 2 에서는 천연림이 Y=426.1X- 660.7(r
2=0.84), 인공림이 Y=290.9X-388.7(r
2=0.91) 으로 , 모 든 임분에서 높은 상관관계를 나타내었다 (Figure 4D).
Site 1 에서 천연림과 인공림의 근원직경에 대한 뿌리 전
체 무게간의 회귀식은 각각 Y=45.4X-54.0 과 Y=61.7X-
71.3 으로 나타났고 , 그 결정계수는 각각 0.77 과 0.87 로 두
임분 모두 높은 상관관계를 나타내었으며 , Site 2 의 인공 림도 그 회귀식이 Y=124.1X-209.8(r
2=0.91) 로 높은 상관 관계를 나타내었다 . 하지만 Site 2 의 천연림은 다른 임분 에 비해 그 값의 분포는 높았지만 근원직경과 뿌리 전체 건중량간의 회귀식에서 결정계수가 0.38 로 낮은 값을 나
타내었다 (Figure 4E). 근원직경과 전체 뿌리 재적과의 관
계에서는 Site 1 의 천연림이 Y=83.9X-100.1 의 회귀식과
0.73 의 결정계수를 나타내었고 , 인공림은 그 회귀식이
Table 1. Continued.
H DRC SW BW NW AGTW
Below -ground
Volume of taproots (VT)
Site 1 Na -0.17 -0.77** -0.77** -0.73* -0.68* -0.78**
Pl -0.72* -0.93** -0.94** -0.11 -0.95** -0.82**
Site 2 Na -0.45 -0.40 -0.55 -0.60 -0.56 -0.61
Pl -0.36 -0.91** -0.77* -0.84** -0.90** -0.88**
Volume of horizontal roots (VHR)
Site 1 Na -0.14 -0.81** -0.60 -0.73* -0.65* -0.70*
Pl -0.68* -0.78* -0.83** -0.06 -0.68* -0.68*
Site 2 Na -0.36 -0.83** -0.73* -0.57 -0.72* -0.73*
Pl -0.50 -0.95** -0.85** -0.90** -0.84** -0.91**
H : Tree height, DRC : Diameter at root collar, Na : Natural stand, Pl : Planted stand.
*and **indicate significance at 5% and 1% levels, respectively.
Y=144.1X-227.0 으로 나타났으며 결정계수는 0.88 로 나타
나 두 임분 모두 높은 상관관계를 보였다 . Site 2 에서는 인 공림의 결정계수가 0.91 로 높게 나타난 반면 , 천연림은 그 결정계수가 0.54 로 비교적 낮은 값이 나타났다 (Figure 4F).
고 찰
본 연구는 임분의 성립방법이 다른 천연림과 인공림간 의 지상부와 지하부 생체량간의 상관관계를 비교 분석하 기 위해 실시하였다 . 임목에 있어 지상부의 생장은 뿌리
구조 발달에 의해 균형을 이루지만 (Nielsen, 1992), 모수에
서 낙하된 종자에서 생산된 임목과 용기묘 또는 노지묘로 생산된 묘목을 식재한 임목간에는 지상부의 생장부터 지 하부의 생장 , 토심별 뿌리분포 , 뿌리 형태 등 많은 차이를 나타낸다 . 천연림과 인공림간의 지상부 비교에서 용기묘
를 인공조림한 수목은 조림 직후 5 년 동안 수목의 생장이
지연되고 (Sundström and Keane, 1999), 천연갱신된 임목 보다 더 낮은 수고대 직경비 (height-to-diameter ratio) 를 나 타내었으며 , 이러한 지상부 생장의 차이는 뿌리 기형으로
인해 야기된 영양분 흡수의 미흡 때문이라 하였다 (Robert
Figure 4. Correlation analysis between DRC and some important traits measured in natural and planted stands of
Pinus densiflorafor.
erectaof one age-class in two studied sites. Na : Natural stand, Pl : Planted stand, DRC : Diameter at root collar.
and Lindgren, 2006). 또한 Kim(2004) 은 조림지와 천연림 ,
맹아림에서 여러 수종의 직경생장을 비교한 결과 각 수종 에 따라 상이한 결과가 나타났지만 , 결과적으로 천연림이 인공림보다 우수한 직경생장을 나타낸다고 보고하였다 .
지하부의 형태 및 생장에서도 많은 차이점이 있는데 , 인 공림은 천연림에 비해 주근과 측근의 발달이 토양 표층에 집중되어 있으며 (Plorude et al ., 2009), 특히 용기묘는 용
기의 제한된 용적과 모양으로 인해 기형의 뿌리구조가 발
생하고 뿌리의 발달이 제한된다 (Van Erden and Arnott,
1974; Huuri, 1978; Halter et al ., 1993). 또한 용기묘의 가장 큰 문제점인 나선형뿌리 (root spiraling) 는 뿌리가 용 기내부를 따라 옆으로 돌아가는 비정상적이 뿌리를 말하 는데 (Sutton and Tinus, 1983), 이는 뿌리 형태에 직접적인 영향을 미칠 뿐만 아니라 현지 식재 후에도 단·장기간 수목의 생장에 큰 영향을 미친다 . 또한 나선형뿌리를 갖 고 있는 용기묘는 식재되었을 때 활착과 생육에 부정적인
영향과 주근의 발생을 저해하는 요인이 된다 (Burden and
Martin, 1982; Marler and Wilis, 1996). Persson(1978) 은
나선형뿌리가 인공조림 시 임목의 안정에 필수적인 2 차근 의 발생을 지연시킨다고 보고하였다 .
본 연구에서는 임분의 성립방법이 다른 천연림과 인공림 의 지상부와 지하부 생장에서 많은 차이를 나타내었다 . 또
한 동일한 천연림 지역이라도 임분이 위치한 해발고 , 임분
밀도 등 환경적인 요소들에 의해 생장차이가 나타나는 것
으로 나타났다 . 특히 Site 2 의 천연림은 잣나무 조림지 사이
에 성립된 임분으로서 매년 풀베기 작업을 이루어짐으로써
타 임분에 비해 매우 우수한 생장을 보였다 (Figure 2, 3).
이와 같이 임분의 성립기원 뿐만 아니라 임분의 위치 ,
육림작업의 여부 등에 따라 지상부 뿐만 아니라 지하부의 형태와 생장에 분명한 차이를 나타내지만 , 본 연구에서 실 시한 지상부와 지하부 생체량간의 상관관계 분석에서는 대부분의 지상부 인자간에 상관관계는 높은 상관관계가 나타났으며 , 지상부와 지하부의 각 인자별 상관관계에서
도 천연림과 인공림간의 차이를 보이지 않아 (Table 1), 모 든 임분이 유사한 결과를 나타내었다 . 한편 , 30-40 년생 독 일가문비나무 (Lee, 2001) 와 25-45 년생 소나무 (Lee, 2004a)
의 수고와 지상부 인자간의 상관관계는 모든 지상부 인자 와 높은 상관관계를 나타낸다고 보고되고 있으나 , 본 연
구에서 수고에 대한 각 지상부와 지하부 인자간에는 모든 임분에서 높은 정의상관이 나타나지 않아 (Table 1), 기존 연구들과 상이한 결과를 보였다 . 이는 본 조사 임분의 수 령이 10 년 이하의 유령림이고 , 조사목이 생장하는 환경적 인 차이로 인해 나타난 결과로 사료된다 . 하지만 기존의
연구들과 같이 흉고직경과 각 지상부와 지하부 인자들간 의 상관관계는 높은 상관관계를 나타내어 10 년 이하의 어 린 금강소나무 치수에 대한 지상부 생체량 추정에는 수고
보다 근원직경이 더 적합하다는 것을 의미한다 (Table 1 and Figure 4).
또한 지하부는 일반적으로 수목의 임령이 증가할수록 지상부와 지하부 생체량 비는 감소하지만 (Santantonio, 1990; Noh et al ., 2005), 이는 수종 (Koch, 1989; Cairns
et al ., 1997) 과 수목이 생육하는 환경 (Keyes and Grier, 1981; Fogle and Hunt, 1983; Persson, 1983; Lee, 2000;
2004b) 에 따라 매우 상이한 결과를 나타낸다 . 따라서 1 영
급 강원지역 금강소나무의 정확한 지하부 생체량 추정을 위해서는 근원직경 또는 지상부 전체 건중량으로써 전체 뿌리의 건중량을 추정하는 회귀식을 사용하는 것이 바람 직하다고 생각된다 (Figure. 4). 반면 , 뿌리의 전체 길이 , 수
직근의 길이 및 수평근의 길이는 각 지상부 인자들 뿐만 아니라 지하부 인자들간에서도 높은 정의 상관이 나타나 지 않아 임목의 지하부 생체량 추정에 사용되는 변수로서 는 미흡하다고 생각된다 .
자료에 대한 보다 높은 신뢰성은 다양한 영급과 지역에 서 추가적인 조사를 통하여 이루어져야 할 것이다 . 생육
하는 환경조건의 상이함 뿐만 아니라 임분의 성립 기원도 다른 네 곳의 임분에서 생육하는 1 영급 금강소나무의 생 체량을 추정하기 위해서는 측정이 용이한 근원직경이 유 용하게 사용될 수 있을 것이다 . 또한 본 연구에서 얻어진
회귀식은 강원지역 1 영급 금강소나무 임분에서 근원직경
을 이용한 지상부 및 지하부의 상대적인 뿌리 생체량을 추정하기 위한 기초적인 자료로 유용하게 이용될 수 있을 것이다 .
인용문헌
1. Alban, D.H., Pelata, D.A. and Schlaegel, B.E. 1978.
Biomass and nutrient distribution in aspen, pine and spruce stands on the same soil type in Minnesota. Cana- dian Journal of Forest Research 8: 290-299.
2. Bartelink, H.H. 1998. A model of dry matter partition- ing in trees. Tree Physiology 18: 91-101.
3. Burden, A.X. and Martin, P.A.F. 1982. Chemical root pruning of coniferous seedlings. Horticulture Science 17: 622-624.
4. Cairns, M.A., Brown, S., Helmer, E.H. and Baumgardner, G.A. 1997. Root biomass allocation in the world's upland forests. Oecologia 111: 1-11.
5. Cha, D.S., Oh, J.H., Ji, B.Y. and Chun, K.W. 2002. A study on slope stability effects by the tree root systems(I) -Spatial distribution and physical properties of red pine tree roots-. Joural of Korean Forest Society 91(1): 71-78.
6. Drexhage, M. and Gruber, F. 1999. Above- and below
stump relationships for Picea abies -estimating root sys-
tem biomass from breast-height diameter-. Scanadinavian
Journal of Forest Research 14: 328-333.
7. Fogel, R. and Hunt, G. 1983. Contribution of mycor- rhizae and soil fungi to nutrient cycling in a Douglas-fir ecosystem. Canadian Journal of Forest Research 13: 219- 8. Gruber, F. 1994. Morphology of coniferous trees : possi- 232.
ble effects of soil acidification on the morphology of Nor- way spruce and Silver fir. In Godbold, D and Htittermann, A.
(Eds.) Effects of Acid Rain on forest Processes, Wilwy- Liss, New York
.pp. 256-324.
9. Halter, M.R., Chanway, C.P. and Harper, G.J. 1993. Growth reduction and root deformation of containerized Lodge- pole pine saplings 11 years after planting. Forest Ecology and Management 56: 131-146.
10. Huuri, O. 1978. Effects of various treatments at planting and of soft wall containers on the development of Scots pine. In The Root Form of Planted Trees. Proc. Symp., 16-19 May 1978. Victoria, B.C., Canada. (Eds.) Van Eer- den, E. and Kinghorn, J.M. British Columbia Ministry of Forests, Victoria. pp. 101-108.
11. Jin, Y.H., Meng, X. and Lee, D.K. 1999. Biomass produ- citivity and its vertical allocation of natural Pinus densi- flora forests by stand density at the northeastern part of Mt. Baekdoo. Journal of Korean Forest Environment 18(2):
92-99.
12. Kapeluck, P.R. and Van Lear, D.H. 1995. A technique for estimating below-stump biomass of mature loblolly pine plantations. Canadian Journal of Forest Research 25: 355- 13. Keyes, M.R. and Grier, C.C. 1981. Below- and above- 360.
ground biomass and net production in two contrasting Douglas-fir stands. Canadian Journal of Forest Research 11: 599-605.
14. Kim, K.D. and Kim, C.M. 1988. Research trends on for- est biomass production in Korea. Journal of Korean For- est Environment 8(2): 94-107.
15. Kim, G.T. 2004. Ecological forest management and refor- estation problem -Comparison of diameter increment of Juflans mandshurica between artificial and natural forest-.
Korean Society of Environment and Ecology 17(4): 309- 16. Koch, P. 1989. Estimates by species group and region in 315.
the USA of below-ground root weight as a percentage of overdry complete-tree weight and carbon content of tree portions. Wood science laboratory, Inc., Carvallis, MT. pp.
17. Köstler, J.N., Bruckner, E. and Bibelriether, E. 1968. Die 23.
Wurzeln der Waldbaume. Verlag Paul Parey, hamburg, Ger- many
.pp. 284.
18. Kuiper, L.C. and Coutts, M.P. 1992. Spatial disposition and extension of the structural root system of Douglas-fir.
Forestry Ecology Management 47: 111-125.
19. Kwon, K.C. and Lee, D.K. 2006. Biomass and annual net production of Quercus mongolica stands in Mt, Joongwang
with respect to altitude and aspect. Journal of Korean For- est Society 95(4): 398-404.
20. Lacointe, A. 2000. Carbon allocation among tree organs : A review of basic processes and representation in func- tional-structural tree models. Annals of Forest Science 57:
521-533.
21. Le Goff, N. and Ottorini, J.M. 2001. Root biomass and biomass increment in a beech ( Fagus sylvatica L.) stand in North-Esat france. Annals of Forest Science 58: 1-13.
22. Lee, D.H. 2000. Root morphology of norway spruce ( Picea abies ) in the differently acidificated forest soil. Journal of Korean Forest Society 89(5): 677-684.
23. Lee, D.H. 2001. Relationship between above- and below- ground biomass for norway spruce ( Picea abies ) : Esti- mating root system biomass from breast height diameter.
Journal of Korean Forest Society 90(3): 338-345.
24. Lee, D.H. 2004a. Estimating above- and below-ground biomass from diameter of breast height and height for the Pinus densiflora Sieb. et Zucc. Journal of Korean Forest Society 93(3) : 242-250.
25. Lee, D.H. 2004b. Root adaptation of Pinus densiflora Sieb. et Zucc in the differently acidified forest soil in Korea. Jour- nal of Korean Forest Society 93(1): 50-58.
26. Lee, K.J., Kim, K.D., Kim, J.S. and Park, I.H. 1985. Dis- tribution of biomass and production of Pinus rigida and Pinus rigida × taeda Plantation in Kwangju District. Jour- nal of Korean Forest Society 69: 28-35.
27. Lee, Y.J., Lee, M.H., Lee, K.H., Son, Y.M., Seo, J.H., Park, I.H. and Son, Y.H. 2006. Effects of stand age classes on biomass expansion factors and stem densities in Chamae- cyparis obtusa plantations. Journal of Korean Forest Soci- ety 95(1): 50-54.
28. Marler, T.E. and Wilis, D. 1996. Chemical or air root pruning containers improve carambola. -Logan and mongo seedling root morphology and initial root growth after transplanting-. Journal of Environment Horticulture. 14(2):
47-49.
29. Na, S.J., Woo, K.S., Kim, C.S., Yoon, J.H., Lee, H.H. and Lee, D.H. 2010. Comparison of above-ground growth charac- teristics between naturally regenerated and planted stands of Pinus densiflora for. erecta Uyeki in Gangwon Prov- ince. Journal of Korean Forest Society 99(3): 323-330.
30. Noh, N.J., Son, Y.h., Kim R.H., Seo, K.Y., Seo, K.W. Koo, J.W., Kyung, J.H., Kim, J.S., Lee, Y.J., Park, I.H., Lee, K.H. and Son, Y.M. 2005. Biomass of Korean pine ( Pinus koraiensis ) in gapyeong area. Korean Journal of Forest Measurements 8: 75-82.
31. Nielsen, C.N. 1992. Will traditional conifer tree breeding for enhanced stem production reduce wind stability? Sil- vae Genetica 41: 307-318.
32. Park, G.S. and Lee, S.W. 2002. Biomass and net primary
production of Quercus serrata natural stands in Kwangy-
ang, Muju and Pohang areas. Journal of Korean Forest
Society 91(6): 714-721.
33. Park, I.H. and Lee, S.M. 1990. Biomass and net produc- tion of Pinus densiflora natural forests of four local forms in Korea. Journal of Korean Forest Society 79(2): 196-204.
34. Park, I.H., Lee, D.K., Lee, K.J. and Moon, G.S. 1996. Growth, biomass and net production of Quercus Species(I) -With Reference to Natural Stands of Quercus variabilis , Q.
acutissima , Q. dentata , and Q. mongolica in Kwangju, Kyonggido-. Journal of Korean Forest Society 83(1): 76- 35. Park, I.H., Park, M.S., Lee, K.H., Son, Y.M., Seo, J.H., Son, 83.
Y.h. and Lee, Y.J. 2005. Biomass expansion factors for Pinus densijfora in relation to ecotype and stand age.
Journal of Korean Forest Society 94(6): 441-445.
36. Persson, H. 1983. The distribution and productivity of fine roots in boreal forests. Plant and Soil 71: 87-101.
37. Persson, P. 1978. Some possible methods of influencing the root development of containerized tree seedlings. pp.
295-300 in Van Eerden and Kinghorn (1978).
38. Plourde, A., Krause, C. and Lord, D. 2009. Spatial distri- bution, architecture, and development of the root system of Pinus banksiana Lamb. in natural and planted stands.
Forest Ecology and Management 258: 2143-2152.
39. Robert, J.A. and Lindgren, B.S. 2006. Relationships between root form and growth, stability, and mortality in planted versus naturally regenerated lodgepole pine in north-cen- tral British Columbia. Canadian Journal of Forest Research 36(10): 2642-2653.
40. Santantonio, D. 1990. Modeling growth and production of
tree roots. In Dixon, R.K., Meldah, R.S., Ruark. G.A., Warren, W.G. (Eds.) Process modeling of forest growth responses to environmental stress. Timber Press, Port- land. pp. 124-141.
41. Sundström, E. and Keane, M. 1999. Root architecture, early development and basal sweep in containerized and bare- rooted Douglas-fir ( Pseudotsuga menziesii ). Plant and Soil 217: 65-78.
42. Sutton, R.F. and Tinus, R.W. 1983. Root and root system terminology. Forest Science 29, Monograph 24. pp. 137.
43. Thies, W.G. and Cunningham, P.G. 1996. Estimating large- root biomass from stump and breast-height diameters for Douglas-fir in western Oregon. Canadian Journal of For- est Research 26: 237-243.
44. Van Erden, E. and Arnott, J.T. 1974. Root growth of con- tainer-grown stock after planting. In North American con- tainerised tree seedling Symp., Aug. 1974, Denver, Colorado, USA. (Eds.) R.W. Tinus, W.J. Stein and Balmer, W.E.
Great Plains Agricultural Council Publication 68, pp. 393- 45. Watson, A. and O'Loughiin, C. 1990. Structural root mor- 397.
phology and biomass of tree age-classes of Pinus radi- ata . New Zealand. Journal of Forestry Science 20: 97-110.
46. Whittaker, R.H. and Marks, P.L. 1975. Methods of assess- ing terrestrial productivity. In : Primary Productivity of the Biosphere (Eds.) Lieth, H. and Whittaker, R.H. pp.
55-118. Springer Verlag. New York.
(2010년 10월 5일 접수; 2010년 11월 5일 채택)