Can a semi-quantitative method replace the current quantitative method for the annual screening of microalbuminuria in patients with diabetes? Diagnostic accuracy and cost- saving analysis considering the potential health burden
Yaerim Kim1,2☯, Seokwoo Park2,3,4☯, Myung-Hee Kim5, Sang Hoon Song6, Won Mok Lee7, Hye Soon Kim8, Kyubok Jin1, Seungyeup Han1, Yong Chul Kim2, Seung Seok Han2, Hajeong LeeID2,9, Jung Pyo Lee2,9,10, Kwon Wook Joo2,3,9, Chun Soo Lim2,9,10, Yon Su Kim2,3,9, Dong Ki KimID2,3,9*
1 Division of Nephrology, Department of Internal Medicine, Keimyung University School of Medicine, Daegu, Korea, 2 Division of Nephrology, Department of Internal Medicine, Seoul National University Hospital, Seoul, Korea, 3 Department of Internal Medicine, Seoul National University College of Medicine, Seoul, Korea, 4 Department of Biomedical Sciences, Seoul National University College of Medicine, Seoul, Korea, 5 Department of Dental Hygiene, College of Health Science, Eulji University, Gyeonggi-do, Korea, 6 Department of Laboratory Medicine, Seoul National University Hospital, Seoul, Korea, 7 Department of Laboratory Medicine, Keimyung University School of Medicine, Daegu, Korea, 8 Division of Endocrinology and Metabolism, Department of Internal Medicine, Keimyung University School of Medicine, Daegu, Korea, 9 Kidney Research Institute, Seoul National University College of Medicine, Seoul, Korea, 10 Division of Nephrology, Department of Internal Medicine, Seoul National University Boramae Medical Center, Seoul, Korea
☯These authors contributed equally to this work.
Abstract
Objectives
Diabetes is a global epidemic, and the high cost of annually and quantitatively measuring urine albumin excretion using the turbidimetric immunoassay is challenging. We aimed to determine whether a semi-quantitative urinary albumin-creatinine ratio test could be used as a screening tool for microalbuminuria in diabetic patients.
Methods
We assessed the diagnostic accuracy of the semi-quantitative method. The costs of false results in the semi-quantitative method were calculated based on the annual probability of disease progression analyzed through a systematic literature review and meta-analysis.
The pooled long-term cost-saving effect of the semi-quantitative method compared with the quantitative test was assessed using a Markov model simulating a long-term clinical setting.
Diagnostic accuracy and the cost-saving effect were also validated in an independent exter- nal cohort.
a1111111111 a1111111111 a1111111111 a1111111111 a1111111111
OPEN ACCESS
Citation: Kim Y, Park S, Kim M-H, Song SH, Lee WM, Kim HS, et al. (2020) Can a semi-quantitative method replace the current quantitative method for the annual screening of microalbuminuria in patients with diabetes? Diagnostic accuracy and cost-saving analysis considering the potential health burden. PLoS ONE 15(1): e0227694.https://
doi.org/10.1371/journal.pone.0227694
Editor: Tatsuo Shimosawa, International University of Health and Welfare, School of Medicine, JAPAN
Received: May 8, 2019 Accepted: December 25, 2019 Published: January 21, 2020
Copyright:© 2020 Kim et al. This is an open access article distributed under the terms of the Creative Commons Attribution License, which permits unrestricted use, distribution, and reproduction in any medium, provided the original author and source are credited.
Data Availability Statement: All relevant data are within the manuscript and its Supporting Information files.
Funding: This work was supported by: DK Kim, HI17C0530, Korea Healthcare Technology R&D Project, the Ministry of Health and Welfare,https://
www.htdream.kr/. The funders had no role in study design, data collection and analysis, decision to publish, or preparation of the manuscript.
Results
Compared with the quantitative test, the semi-quantitative method had sensitivities of 93.5%
and 81.3% and specificities of 61.4% and 63.1% in the overall sample of diabetic patients (n
= 1,881) and in diabetic patients with eGFR�60 ml/min/1.73 m2and a negative dipstick test (n = 1,110), respectively. After adjusting for direct and indirect medical costs, including the risk of disease progression, which was adjusted by the meta-analyzed hazard ratio for clini- cal outcomes, it was determined that using the semi-quantitative method could save 439.4 USD per person for 10 years. Even after adjusting the result to the external validation cohort, 339.6 USD could be saved for one diabetic patient for 10 years.
Conclusions
The semi-quantitative method could be an appropriate screening tool for albuminuria in dia- betic patients. Moreover, it can minimize the testing time and inconvenience and signifi- cantly reduce national health costs.
Introduction
Diabetic nephropathy (DN) is the most common cause of chronic kidney disease (CKD), and the risk for end-stage renal disease (ESRD) is approximately 12-fold higher in diabetic patients than in non-diabetic patients.[1–4] Guidelines have recommended measuring the urine albu- min-creatinine ratio (uACR) and estimated glomerular filtration rate (eGFR) annually in dia- betic patients.[5,6]
Quantitative measurement of the uACR with an immunoturbidimetric assay is the standard method, with excellent precision for determining the 24-hour urine albumin excretion level.
However, this method is expensive when used as a screening tool for detecting microalbumi- nuria and requires specialized equipment, trained personnel, and a considerable amount of time. Additionally, it requires the specimen to be transported to a central laboratory because the assay cannot be performed in primary clinics where most diabetic patients receive medical care. To counter these drawbacks, a semi-quantitative uACR test has been developed as a point-of-care testing (PoCT) method to screen for microalbuminuria. The strengths of PoCT include faster decisions, improved adherence to treatment, and reduced incidence rates of complications.[7] Recently, researchers have focused on the economic advantage of PoCT.
However, different results have been obtained, with a lack of evidence regarding the cost-sav- ing effect of PoCT.[8–10] To consider the opportunity cost of false negatives and false posi- tives, a cost-saving analysis needs to be performed to investigate whether the semi-quantitative method could replace the standard method for a disease that affects a large proportion of the population. Therefore, we focused on the diagnostic accuracy of the semi-quantitative method for detecting microalbuminuria and the cost-saving effect for diabetic patients, calculating the opportunity cost of false results via a meta-analysis.
Materials and methods
Development and validation cohorts
The study was performed in two independent cohorts. For the development cohort, diabetic patients diagnosed as per American Diabetes Association guidelines who visited the Seoul
Competing interests: The authors have declared that no competing interests exist.
National University Hospital between June 2017 and January 2018 were initially screened in the study.[11] Before screening for microalbuminuria, patients with microscopic hematuria, pyuria, or urinary casts were excluded. All clinical and laboratory data were retrospectively examined by reviewing the electronic health records. A subset with an eGFR �60 ml/min/1.73 m2and negative dipstick test for proteinuria was selected to assess the diagnostic accuracy of the semi-quantitative method for detecting microalbuminuria in diabetic patients without clinically evident DN.
In the validation cohort, we performed an additional analysis using diabetic patients who had their uACRs checked at the Keimyung University Dongsan Hospital between July 2019 and September 2019. The exclusion criteria were applied the same as those for the develop- ment cohort, all data were retrospectively reviewed using electronic health records.This study was approved by the local Institutional Review Board of Seoul National University Hospital (D-1704-018-843) and Keimyung University Dongsan Hospital (DSMC 2019-08-016) and reg- istered at ClinicalTrials.gov (NCT03238547).
Sample collection and Laboratory analysis
Freshly voided random urine samples were obtained and stored for a maximum of 24 hours at 4oC. All urine samples were analyzed within 6 hours of collection using the following three methods: dipstick urinalysis, quantitative testing, and the semi-quantitative method. Dipstick urinalysis was performed in the biomedical examination room using a SYSMEX UC-3500 ana- lyzer (Sysmex Co., Ltd., Kobe, Japan). Urine albumin was quantitatively measured using the immunoturbidimetry method with a TBA 120FR analyzer (Toshiba Medical Systems Corp., Tokyo, Japan). The urinary creatinine level was analyzed by the Jaffe kinetic reaction on Ci16000 and TBA 120FR analyzers (Toshiba Medical Systems Corp., Tokyo, Japan). The coef- ficients of variance were 5.6% and 3.6% for urine albumin and creatinine, respectively.
Serum creatinine (sCr) was measured using the alkaline picrate Jaffe kinetic method by a Hitachi 7600 analyzer (Toshiba Medical Systems Corp., Tokyo, Japan), and the assay was cali- brated to standardized creatinine measured using the IDMS via corrected equations: calibrated sCr = 1.00× measured sCr– 0.3 (mg/dL). The estimated GFR was calculated based on the Chronic Kidney Disease Epidemiology Collaboration equation.
In the validation cohort, all of the methods for sample preparation were the same as those for the development cohort. The types of equipment differed as follows: Roche cobas U6500 analyzer (Fritz Hoffmann-La Roche, Basel, Switzerland) for dipstick urinalysis, STRATEC SR 300 analyzer (Beckman Coulter Corp., California, United States) for urine albumin, Selectra ProS analyzer (ELITech Group, Puteaux, France) for urine creatinine, and Roche-Hitachi 8000 cobas C702 analyzer (Fritz Hoffmann-La Roche, Basel, Switzerland) for serum creatinine.
Urine albumin and was analyzed with the radio-immunoanalytical (RIA) method with an albumin RIA kit (Beckman Coulter Corp., California, United States). The method for analyz- ing urine and serum creatinine was the same as that in the development cohort.
Semi-quantitative test for uACR
The process for testing the semi-quantitative method was similar to the dipstick test. Urine albumin and creatinine were separately analyzed with the URiSCAN12ACR system
(YD-Diagnostics Co., Yongin, Korea) after placing the stick on the read device following brief exposure to the urine. Urine albumin was assayed using an immunoturbidity method with the Autokit Micro Albumin analyzer (FUJIFILM Wako Diagnostics, Osaka, Japan). Analysis of the urine creatinine level was performed by enzymatic assay with the L-Type Creatinine M analyzer (FUJIFILM Wako Diagnostics, Osaka, Japan). We performed the tests at 3 separate
experimental sites with 3 different operators using the URiSCAN12ACR strip and URiS- CAN1Pro urine analyzer (YD–Diagnostics Co.) to confirm the within-day precision.
Between-day precision was analyzed with 10 separate measurements per day for 10 days and was represented by the reproducibility based on the Clinical and Laboratory Standards Insti- tute guideline EP5–A2.[12] We conducted precision analysis with 3 different categories of uACR, namely, <30, 30–300, and �300 mg/g. Moreover, the sensitivity analysis and diagnos- tic accuracy test were performed based on dichotomous results, with a cutoff value of 30 mg/g.
Modeling for cost-saving analysis and cost assessment
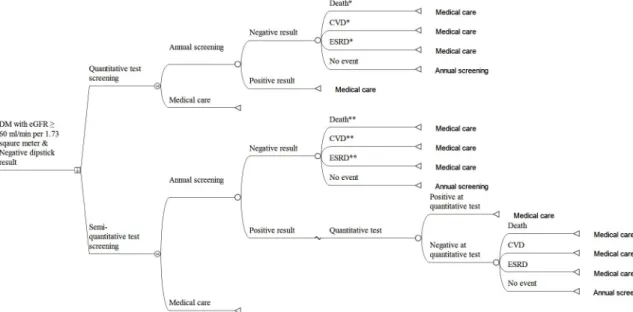
Model construction. We conducted cost-saving analyses using a Markov model simulat- ing a long-term clinical setting. The model is illustrated inFig 1. Screening tests were per- formed annually; hence, the cycle length was 1 year, and the time horizon was 10 years. Those testing positive on the quantitative test (Q positive) were assumed to have micro- or overt albuminuria and thus stopped undergoing screening. Even if participants were normo-albu- minuric on a quantitative test (Q negative), they were still susceptible to clinical outcomes (i.e., ESRD, cardiovascular disease [CVD], or death) to some extent. Those remaining without clini- cal outcomes were subject to the next the Markov cycle. For the semi-quantitative strategy, test positivity (SemiQ positive) was confirmed by the quantitative test. Depending on the confir- matory test results, for the false positive population, we assessed the probabilities of clinical outcomes in normo-albuminuria, while the true positive population, which had micro- or overt albuminuria, proceeded to medical care and were terminated from Markov cycle. Those testing negative on the semi-quantitative test (SemiQ negative) had the possibility of
Fig 1. Structure of the Markov model. The square denotes a decision node where the quantitative or semi-quantitative screening strategy can be chosen. The circles represent chance nodes in which subsequent events occur at probabilities allocated to each node. The letter M in a circle indicates a Markov node. The triangles represent terminal nodes, where subjects return to the Markov node from which they started the cycle and start the next cycle again. Descriptions accompanying terminal nodes designate the path for the subjects to follow at the next Markov cycle.�Annual probabilities of these clinical events were derived from diabetic patients with normo- albuminuria.��Putatively, both true negative and false negative fractions are present in the SemiQ negative population. The occurrences from both cases were included. For the population with false negatives, the hazard ratio for clinical outcomes was assessed in micro- or overt albuminuric diabetic patients. Additionally, for the population with true negative results, the hazard ratio for clinical outcomes was assessed in normo-albuminuric diabetic patients. Abbreviations: CVD, cardiovascular disease; DM, diabetes mellitus; ESRD, end-stage renal disease.
https://doi.org/10.1371/journal.pone.0227694.g001
developing clinical events. We considered the possibility that a population with true negative results could progress to non-albuminuric outcomes and the population with false negative results could progress to albuminuric outcomes. Remainders without clinical events entered the next cycle.
Input parameters. Parameter values are described inTable 1. The probabilities of positive or negative test results at annual screening were derived from the study results that we per- formed (Table 2). Regarding the SemiQ-positive or SemiQ-negative population, the true or false result rate of confirmatory quantitative tests was also obtained from the results of our study. Incidences of clinical outcomes, referred from previous reports performed in diabetic patients with normo-albuminuria,[13,14] were converted to probabilities by the formula:
probability = 1-e^{-(rate×time)}.[15] For cases with micro- or overt albuminuria, incidences of clinical outcomes were estimated by multiplying the meta-analyzed hazard ratios to inci- dences in normo-albuminuric cases.
Cost estimation. We calculated the pooled cost difference according to the measured dif- ferences between the semi-quantitative and quantitative methods. We included the direct
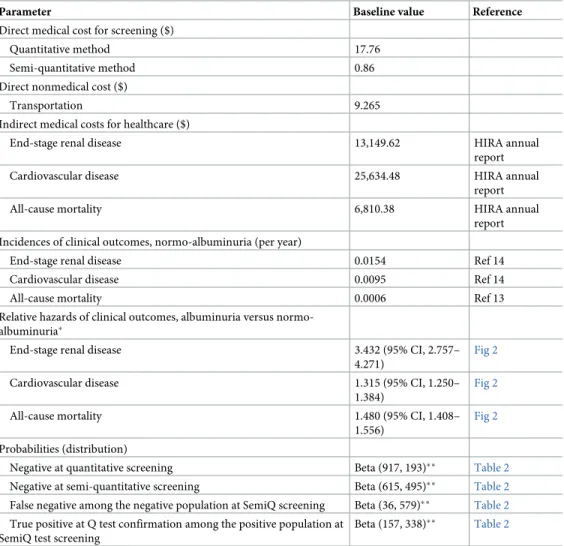
Table 1. Baseline input values used for cost-saving analyses.
Parameter Baseline value Reference
Direct medical cost for screening ($)
Quantitative method 17.76
Semi-quantitative method 0.86
Direct nonmedical cost ($)
Transportation 9.265
Indirect medical costs for healthcare ($)
End-stage renal disease 13,149.62 HIRA annual
report
Cardiovascular disease 25,634.48 HIRA annual
report
All-cause mortality 6,810.38 HIRA annual
report Incidences of clinical outcomes, normo-albuminuria (per year)
End-stage renal disease 0.0154 Ref 14
Cardiovascular disease 0.0095 Ref 14
All-cause mortality 0.0006 Ref 13
Relative hazards of clinical outcomes, albuminuria versus normo- albuminuria�
End-stage renal disease 3.432 (95% CI, 2.757–
4.271)
Fig 2
Cardiovascular disease 1.315 (95% CI, 1.250–
1.384)
Fig 2
All-cause mortality 1.480 (95% CI, 1.408–
1.556)
Fig 2
Probabilities (distribution)
Negative at quantitative screening Beta (917, 193)�� Table 2
Negative at semi-quantitative screening Beta (615, 495)�� Table 2
False negative among the negative population at SemiQ screening Beta (36, 579)�� Table 2 True positive at Q test confirmation among the positive population at
SemiQ test screening
Beta (157, 338)�� Table 2
�These values were used to estimate incidences of clinical outcomes among participants with albuminuria.
��Beta distribution.
https://doi.org/10.1371/journal.pone.0227694.t001
medical costs for receiving the semi-quantitative or quantitative tests, direct nonmedical costs for transportation, and indirect costs for disease progression or premature death. To include strategy-dependent differences in health outcomes in the analyses, we focused on unavoided clinical outcomes that occurred in participants declared negative by the screening tests. Medi- cal expenses for these events were added to the total cost of each strategy to comprehensively compare the economic values of the screening methods. Additional expenses for the quantita- tive assay and transportation were included for patients who were positive according to the semi-quantitative method.
The incidence rates of the clinical outcomes in normo-albuminuric diabetic patients were the previously reported values of 0.95%, 1.54%, and 0.06% for death,[13] CVD,[14] and ESRD, [14] respectively. The baseline annual medical costs were 6,810.4 USD per person per year (PPPY) for ESRD and 13,149.6 USD PPPY for CVD based on the Health Insurance Review and Assessment (HIRA) data mentioned above.[16] The expected cost of death was 25,634.5 USD PPPY.[16] The discount rate for both costs and health outcomes were considered as 3%
per year.[17] The pooled cost-saving effect was assessed by comparing the cost of the semi- quantitative method with that of the quantitative test.
Sensitivity analysis. We performed one-way sensitivity analyses to address model uncer- tainties. Changes in the amount of cost savings by the semi-quantitative method were evalu- ated, while input parameters varied. The costs of screening tests, transportation, and clinical outcomes were varied by 20% from the baseline values. Incidences of clinical outcomes, which were used to calculate annual probabilities, were also varied by 20%. Hazard ratios (HRs) for clinical outcomes were varied within the range of 95% confidence intervals.
Meta-analysis for probabilities of major clinical outcomes
The probabilities of major clinical outcomes occurring before the next annual screening were evaluated with a systematic literature review and subsequent meta-analysis. This review was performed following the Preferred Reporting Items for Systematic Reviews and Meta-analysis statement (S1 File). All included studies met the following inclusion criteria for the analysis:
(1) patients with a confirmed diagnosis of diabetes; (2) studies considered renal function in terms of serum eGFR and proteinuria; (3) study population consisting of diabetic patients
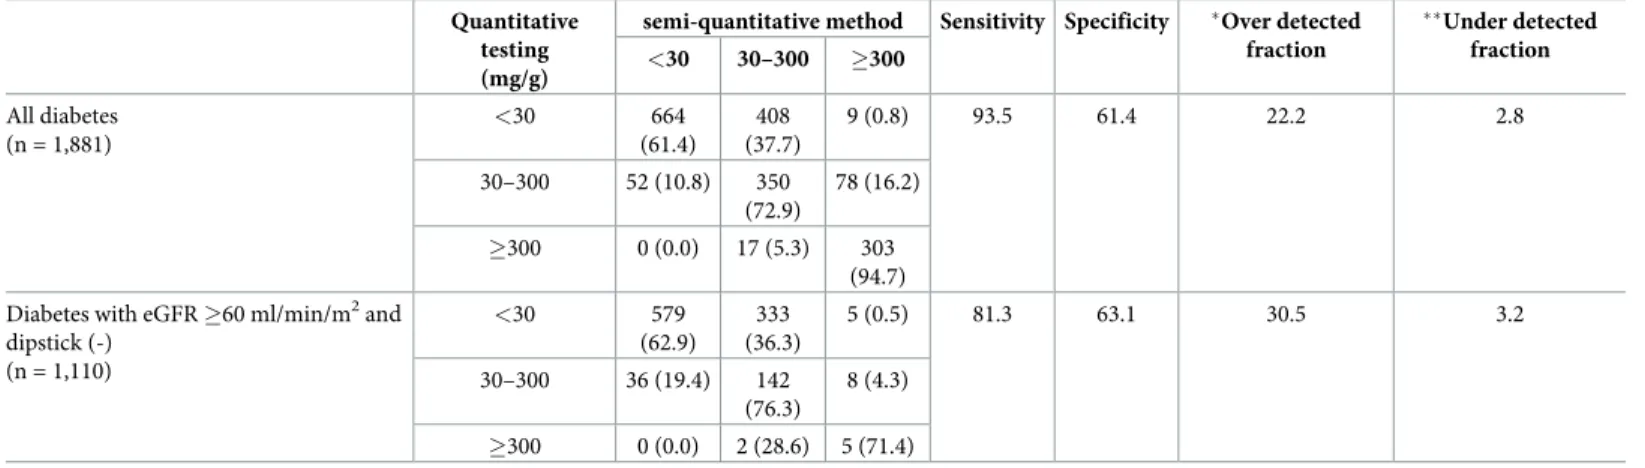
Table 2. The concordance of urine albumin/creatinine ratio using the semi-quantitative method and quantitative testing.
Quantitative testing (mg/g)
semi-quantitative method Sensitivity Specificity �Over detected fraction
��Under detected fraction
<30 30–300 �300 All diabetes
(n = 1,881)
<30 664
(61.4) 408 (37.7)
9 (0.8) 93.5 61.4 22.2 2.8
30–300 52 (10.8) 350
(72.9)
78 (16.2)
�300 0 (0.0) 17 (5.3) 303
(94.7) Diabetes with eGFR �60 ml/min/m2and
dipstick (-) (n = 1,110)
<30 579
(62.9) 333 (36.3)
5 (0.5) 81.3 63.1 30.5 3.2
30–300 36 (19.4) 142
(76.3)
8 (4.3)
�300 0 (0.0) 2 (28.6) 5 (71.4)
�, number of false positives/total number of population x 100
��, number of false negatives/total number of population x 100 eGFR, estimated glomerular filtration rate
https://doi.org/10.1371/journal.pone.0227694.t002
with normal renal function; (4) study outcome limited to all-cause mortality, CVD, and ESRD;
and (5) manuscript written in English. Exclusion criteria were as follows: (1) studies consider- ing interventions such as medication or lifestyle modification; (2) research for identifying the accuracy of a diagnostic tool; and (3) studies involving molecular analyses or biomarkers. We used the terms “mortality” or “myocardial infarction” or “cardiovascular disease” or “stroke”
or “cerebrovascular disorder” or “end-stage renal disease” combined with “diabetes mellitus”
and “albuminuria” for selecting eligible studies from the PubMed, MEDLINE, and EMBASE databases. Two different authors independently searched articles according to the above crite- ria published in web-based databases from January 1970 to January 2018. Finally, we found the articles that were maximally fitted to our requirement for calculating the relative HRs. We obtained the HRs and 95% confidence intervals (CIs) of major clinical outcomes in diabetic patients with albuminuria and eGFR �60 ml/min/1.73 m2compared to those of normo-albu- minuric diabetic patients.
Health burden of false results: Financial resources and statistical information
Medical expenses were defined by the total cost of the treatment, which was determined to be valid by the Korea HIRA review process. Each medical expense is the sum of the amounts paid by the patient and the National Health Insurance Service. We obtained information on annual medical costs from the National Health Insurance Statistical Annual Report 2016 from the HIRA. Medical diseases were classified by the International Classification of Diseases version 10 in the report, and we extracted data using the codes I 20–25, I 50, I 60–63, and N 17–19.
Estimates of the cost of death were based on research by the National Evidence-based Health- care Collaborating Agency, which measured the value of the extension of life in Korea for one year by using the maximum payment intention as the willingness to pay.[18,19] The cost of transportation was deduced from the HIRA report in 2005, and we reflected the price index from 2005 to 2016 in the inflation rate of 28.7%.[20] Statistical data regarding the population and the mortality rate according to age were extracted from the Korean Statistical Information Service. The prevalence of diabetes was multiplied by the reported incidence of diabetes among the population older than 20 years in Korea.
Statistical analysis
To compare the baseline characteristics between the overall diabetes group and the study group, we used the Mann-Whitney U test for continuous variables and the chi-square test for categorical variables. Sensitivity and specificity were analyzed using the chi-square test and were calculated based on the cutoff vales of �30 mg/g for positive results and by <30 mg/g for negative results for the uACR.
In the cost-saving analysis, all cost values were presented in USD based on the exchange rate of the year in which the medical expenses were incurred (annual average exchange rate, 2016; 1 USD = 1,160 KRW). Meta-regression analyses were performed using the meta package with the metagen function inR software to estimate the pooled effect sizes between patients with albuminuria and patients without albuminuria for clinical outcomes such as ESRD, CVD, and death. Heterogeneity between studies was quantified usingI2statistics. Heterogeneity was considered statistically significant when P was <0.05, and the hazard ratio from the random effects model was used to estimate the cost for each health outcome. Data were analyzed with R software version 3.5.1 (Comprehensive R Archive Network:http://cran.rproject.org) and TreeAge Pro version 2019 (TreeAge Software, Inc.). In all analyses, P <0.05 was considered statistically significant.
Results
Development and validation cohorts
In the development cohorts, among 1,881 diabetes patients, 1,369 patients had an eGFR �60 ml/min/1.73m2. Among these patients, we finally selected 1,110 with normal results in the uri- nary dipstick test. There were 917 (82.6%) patients with uACR <30 mg/g, 186 (16.8%) with 30 to 300 mg/g, and 7 (0.6%) with �300 mg/g (S1 Fig).
Compared with all patients, the group of patients with eGFR �60 mL/min/1.73m2and neg- ative dipstick results was younger (median age 64.0 [IQR 14.0] vs. 66.0 [IQR 15.0] years). Most participants had a normal range of uACR <30 mg/g, and the group with eGFR �60 ml/min/
1.73m2and negative dipstick results had a higher rate than that of all diabetic patients (82.6%
vs 57.5%) (S1 Table).
In the validation cohort, there were 431 diabetic patients. Among them, 301 patients showed an eGFR �60 ml/min/1.73m2and normal urinary dipstick test results. The proportion with micro (14.3%) or overt-albuminuria (1.0%) was similar that in the development cohort.
The baseline characteristics are described inS2 Table.
Diagnostic accuracy of the semi-quantitative uACR method
The concordance between the semi-quantitative and quantitative methods was highest in the
�300 mg/g uACR category in the overall diabetes group (94.7%). The sensitivity and specificity were 93.5% (748/800) and 61.4% (664/1,081), respectively (Table 2). The under-detected frac- tion was 2.8% (52/1,881) in the overall diabetic group. This means that out of 100 screened par- ticipants with diabetes, 42.5 had a uACR over 30 mg/g, and 39.7 of them would be correctly classified, while 2.8 of them would remain undetected by the semi-quantitative method. For the patients with eGFRs �60 ml/min/1.73 m2and negative dipstick results, the sensitivity and spec- ificity were 81.3% (157/193) and 63.1% (579/917), respectively. The under-detected fraction accounted for 3.2% (36/1,110) of the patients, meaning that out of 100 screened diabetic partici- pants with normal renal function and negative dipstick results, only 17.4 had a uACR over 30 mg/g, and 3.2 of them would receive false negative results on the semi-quantitative test.
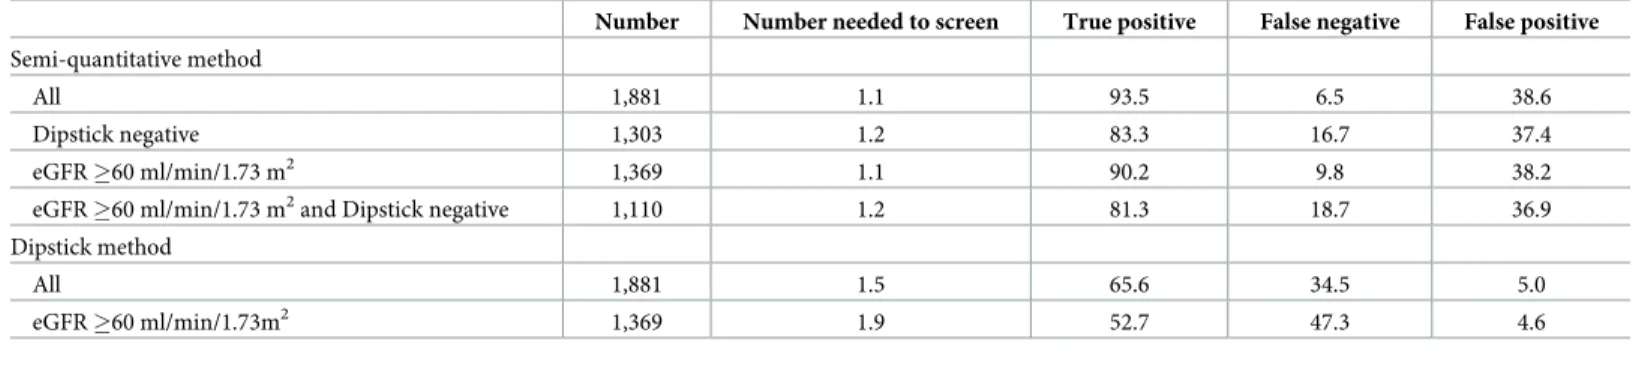
The number needed for screening was lower for the semi-quantitative method than for the dipstick test in both the overall diabetes group and in the group of diabetic patients with nor- mal renal function, indicating that the semi-quantitative method is more efficacious than the dipstick method as a screening tool for albuminuria in diabetic patients (Table 3).
The within-day precision was expressed by linearity, with values of 0.853, 0.814, and 0.811 for urine albumin and 0.931, 0.929, and 0.930 for urine creatinine at three different sites (S2
Table 3. Efficacy of the semi-quantitative method for albuminuria screening in patients with diabetes.
Number Number needed to screen True positive False negative False positive Semi-quantitative method
All 1,881 1.1 93.5 6.5 38.6
Dipstick negative 1,303 1.2 83.3 16.7 37.4
eGFR �60 ml/min/1.73 m2 1,369 1.1 90.2 9.8 38.2
eGFR �60 ml/min/1.73 m2and Dipstick negative 1,110 1.2 81.3 18.7 36.9
Dipstick method
All 1,881 1.5 65.6 34.5 5.0
eGFR �60 ml/min/1.73m2 1,369 1.9 52.7 47.3 4.6
eGFR, estimated glomerular filtration rate
https://doi.org/10.1371/journal.pone.0227694.t003
Fig). The coefficient of variance was <10% and showed 100% agreement in reflectance pho- tometry with the quantitative method according to different ranges and sites (S3 Table).
Cost-saving analysis based on the meta-analysis of the relative risks of clinical outcomes
To identify the induced costs associated with false results, the relative HRs for clinical out- comes were evaluated based on the results of a systematic review. In total, 7,085 articles were initially identified. After filtering by title and abstract and excluding duplicates, we reviewed the detailed contents of 45 articles, and finally, 13 articles were deemed eligible for inclusion (S3 Fig). Among these articles, 9 included results regarding all-cause mortality, 6 included results regarding CVD, and 5 included results regarding ESRD. We next meta-analyzed the different HRs in diabetic patients with and without albuminuria. The pooled HRs were 1.48 (95% CI, 1.41–1.56), 1.31 (95% CI, 1.25–1.38), and 3.27 (95% CI, 2.58–4.13) for all-cause mor- tality, CVD, and ESRD, respectively (Fig 2).
We considered all fractions of true and false results in the semi-quantitative test compared to the quantitative test, as described inTable 3. Based on the pooled HRs of the clinical out- comes, we adjusted the medical cost for each fraction of the results. The overall calculated costs for the direct and indirect medical expenses are illustrated inTable 4. Screening by the semi-quantitative method reduced the total cost for 10 years in one diabetic patient by 23.8%
(439.4 USD) even after considering all disease progression probabilities in the false negative fraction. Moreover, after adjusting for the prevalence of diabetes, 200 billion USD could be saved nationwide.
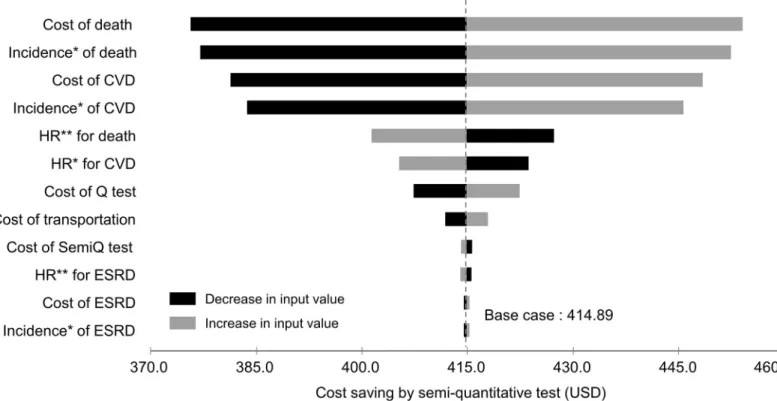
In the one-way sensitivity analysis, the amount of cost savings by the semi-quantitative method was changed according to a variety of input parameters. Although the cost of death changed with the broadest range (375.6 to 454.1 USD) depending on an input variation, the semi-quantitative method still saved costs. The result was depicted using a tornado plot (Fig 3).
Validation of diagnostic accuracy of the semi-quantitative method and cost-saving analysis
The sensitivity and specificity were 83.8% (93/111) and 66.9% (214/320), respectively (S4 Table). The under-detected fraction was 4.2% (18/431) in the overall diabetic group. For the patients with eGFRs �60 ml/min/1.73 m2and negative dipstick results, the sensitivity and specificity were 82.6% (38/46) and 73.3% (187/255), respectively. The under-detected fraction accounted for 2.7% (8/301) of the patients. To validate the cost-saving effect of the semi-quan- titative method, we adjusted all fractions of the result to the Markov model. Finally, the semi- quantitative method saved 16.7% (339.6 USD) of costs compared to the quantitative test in one diabetic patient for 10 years (S5 Table).
In the one-way sensitivity analysis, the amount of cost savings yielded by the semi-quantita- tive method exhibited lowest and highest savings ranging from 0.4 to 54.5 USD according to the change in input parameters. Similarly to that in the development cohort, the cost of death showed the widest range in saving costs: 294.0 to 348.5 USD (S4 Fig).
Discussion
Given that screening for albuminuria is recommended as an annual procedure for all diabetic patients, who comprise approximately 10% of the general population,[21] it is necessary to evaluate whether the semi-quantitative method, which is less expensive and more accessible,
can replace the standard method.[5,6,22] In the present study, the semi-quantitative method showed comparable diagnostic accuracy to that identified in other published articles that eval- uated albuminuria in diabetic patients.[23–27] Several reports have considered ethnicity, co- morbidities, the duration of diabetes, and the level of hemoglobin A1C.[25,27] However, very few studies have focused on the clinical appropriateness of the test with respect to its cost effec- tiveness. This study focused on patients with normal renal function who had normal results on the dipstick test and revealed that the semi-quantitative method can be used as the standard screening tool for albuminuria in a specific subset of diabetic patients, with worthwhile eco- nomic benefit.
As expected, in almost 20% of the patients, albuminuria was not detected by the dipstick test even when the patients had uACR �30 mg/g. The semi-quantitative method identified albuminuria in over 80% of the above missed patients. The sensitivity was understandably lower in diabetic patients with normal renal function who were negative for proteinuria on the dipstick test. This lower sensitivity may have resulted from a lower prevalence of albuminuria in the study group than in the overall diabetic population. Despite relatively stricter criteria for inclusion, these results showed better sensitivity than those previously reported.[23,24,27]
Although only 3.2% of patients were under-detected in the study group, we carefully con- sidered these results and adjusted the medical costs. We tried to calculate the cost-saving effec- tiveness with the highest possible estimate for the false negative fractions by using a more conservative approach, as mentioned above, because the patients logically could have experi- enced critical clinical outcomes for a year. CVD, ESRD, and mortality are the critical compli- cations for patients with DN. Albuminuria is a good indicator and a well-known risk factor for predicting these complications and the long-term prognosis in DN patients.[14,27–34] To
Fig 2. Relative hazard ratios for major clinical outcomes such as death, cardiovascular disease, and end-stage renal disease in diabetic patients with albuminuria and eGFR �60 ml/min/1.73 m2compared to normo-albuminuric diabetic patients.
Abbreviations: CVD, cardiovascular disease; CI, confidence interval; ESRD, end-stage renal disease; HR, hazard ratio.
https://doi.org/10.1371/journal.pone.0227694.g002
Table 4. Cost-saving analysis of semi-quantitative compared with quantitative methods of a 10-year screening strategy for individuals over 20 years old in the total Korean population.
Quantitative strategy (per person)
Semi-quantitative strategy (per person)
Initial screening for urine albumin to creatinine ratio, $� 80.72 4.38
Transportation, $ 84.22 47.15
Total costs for screening, $ 164.95 51.53
Confirmatory quantitative test for the positive fraction from the semi-quantitative strategy, $
Quantitative test - 40.31
Transportation - 21.03
Cost of the under detected fraction, $ (95% CI)
End-stage renal disease 15.34 13.16
Cardiovascular disease 754.57 576.99
All-cause mortality 910.11 702.52
Summed costs (crude), $ 1844.97 1405.54
Summed costs (discounted), $ 1701.25 1286.36
Saved cost (crude), $ 439.44
Saved cost (crude), % 23.8
�1 USD = 1,160 KRW (Annual average exchange rate, 2016). Baseline year of cost, 2016.
https://doi.org/10.1371/journal.pone.0227694.t004
reflect these risks in the cost, we selected matched articles by a systematic literature review. We selected the model closest to our study with information on kidney function and albuminuria, and predicted the relative risk by the sum of the HRs.
We contemplated the risk of clinical outcomes in diabetic patients with normal renal func- tion and normo-albuminuria as a reference. The relative HR for mortality in DN patients with albuminuria compared to normo-albuminuric diabetic patients ranged from 1.02 to 2.15.[28, 30,34–40] Only 2 of the 9 studies were completely matched and considered eGFR and albu- minuria, and they showed results analogous to the others.[30,40] Although several reports suggested a relative HR without considering the eGFR range, we included all the studies to obtain a more accurate result.[34,36,37] This approach could have ultimately caused an over- estimation of the costs for the false negative fraction.
There were 4 articles that reported the relative risk of CVD and ESRD together.[14,35,40, 41] The HRs for CVD were similar to those for all-cause mortality (1.27–1.89), but the HRs for ESRD were significantly higher (2.71–4.13) than those for the other outcomes. These results reflected the fact that albuminuria is involved in the development of ESRD. The annual pro- gression rate from albuminuria to ESRD was only 0.1–0.3%.[42] However, most researchers did not show 1-year outcomes, so it was difficult to estimate the 1-year risk of the progression of disease. Therefore, we focused instead on the difference in the risk of albuminuria based on a normal eGFR. The pulled HRs for the clinical outcomes obtained from the reviewed studies were predisposed to overestimate the risk, which led to an increased cost for the false negative fraction.
Fig 3. Tornado diagram of one-way sensitivity analyses. The vertical dashed line indicates the value in the base case analysis. Black bars represent the deviation resulting from the increase in corresponding input values. Gray bars represent the deviation resulting from the decrease in corresponding input values.�Incidences of clinical outcomes were converted to annual probabilities in the Markov model.��Hazard ratios for clinical outcomes among diabetic patients (micro-or overt albuminuria versus normo-albuminuria). The values were used to calculate incidences of clinical outcomes in diabetic patients with micro- or overt albuminuria.
Abbreviations: CVD, cardiovascular disease; ESRD, end-stage renal disease; HR, hazard ratio; Q test, quantitative test; SemiQ test, semi-quantitative test.
https://doi.org/10.1371/journal.pone.0227694.g003
The induced costs were inferred by multiplying the baseline medical cost by the relative hazard ratio for each clinical outcome in diabetic patients with albuminuria. The baseline medical costs were similar to those previously reported for each clinical outcome. For the CVD events, the event-year costs were reported as 56,445, 42,119, and 23,758 USD PPPY for myocardial infarction, stroke, and congestive heart failure, respectively, but the state costs reflecting annual resources were 1,904, 15,541, and 1,904 USD PPPY, respectively, for each outcome.[43] More recent research reported that the increased cost for overall CVD events in diabetic patients was 331.68 USD per person per month. Medicare costs attributable to CKD gradually increase as the stage increases; the adjusted annual cost for CKD stage IV progress- ing to ESRD was 43,272 USD.[44,45] To compensate for this diversity and uncertainty for the induced costs, we performed a sensitivity analysis with various ranges in input parameters;
particularly, for HRs, we used CIs in the meta-analysis. Moreover, the diversity of medical expenses necessarily reflects the socioeconomic status of the country and other circumstances.
Thus, we calculated the induced costs with a more conservative approach, reflecting Korea’s socioeconomic status. To the best of our knowledge, this is the first study to consider the cost- saving effect of using the semi-quantitative method to detect albuminuria by calculating all the possibilities of disease progression based on the diagnostic accuracy. Notably, we considered the annual progression probability of critical clinical outcomes when the semi-quantitative method failed to detect albuminuria. Moreover, we extended the time horizon to 10 years in the Markov model and maximally assessed the potential health burden for the semi-quantita- tive method. To contemplate the probability of disease progression in patients with albumin- uria, HRs were reassessed by evaluating the difference between patients with and without albuminuria. Despite adjusting the assessed HRs for each clinical outcome to the cost of the false negative fraction, the 10-year expected summed cost using quantitative testing was as high as 439.4 USD for one diabetic patient. In addition to the convenience of the semi-quanti- tative method, these results demonstrate how valuable this tool is for screening.
This study had several limitations. First, the proportion of patients with albuminuria was relatively small, which could have decreased the specificity of the semi-quantitative method.
Second, the designs of the studies included in the pooled meta-analysis did not completely match our design; in particular, most of them did not consider the annual risk of disease.
These unmatched criteria increased the medical costs in instances of false negative results.
Third, although we performed a cost-saving analysis to elicit the economic value of the semi- quantitative method, it was limited to adopting a conservative methodological approach, such as a cost-effectiveness analysis (S2 File). However, we did not assess the cost by direct compari- son but assessed it by considering the major health burden that could occur in diabetic patients with or without microalbuminuria over a 10-year time horizon. Thus, this approach to cost analysis could be considered as close to the conservative methodology. Based on these limita- tions, we should consider the possibility of an overestimation of the total cost and a diminution of the cost-saving effect of the semi-quantitative method.
In conclusion, the semi-quantitative method is eligible to serve as a screening tool for detecting albuminuria in diabetic patients. Furthermore, the use of this protocol was found to reduce the direct and indirect medical costs by >60% and provide excellent diagnostic accu- racy. This approach can minimize time investment and patient inconvenience and improve the implementation of screening tests for albuminuria in diabetic patients.
Supporting information
S1 Table. Baseline characteristics of the development cohort.
(DOCX)
S2 Table. Baseline characteristics of the validation cohort.
(DOCX)
S3 Table. Reproducibility of the semi-quantitative assay for detection of microalbumi- nuria.
(DOCX)
S4 Table. The concordance of urine albumin/creatinine ratio using the semi-quantitative method and quantitative testing in the validation cohort.
(DOCX)
S5 Table. Cost-saving analysis of the semi-quantitative method compared with the quanti- tative method utilizing data from the validation cohort.
(DOCX)
S1 Fig. Differentiated groups according to the eGFR and urine albumin creatinine ratio criteria in the development cohort. Abbreviations: eGFR, estimated glomerular filtration rate; n, number; uACR, urine albumin-creatinine ratio.
(DOCX)
S2 Fig. Within-run precision for urinary (A) albumin and (B) creatinine in the semi-quantita- tive method. The linearity was 0.853, 0.814, and 0.811 for urine albumin, and 0.931, 0.929, and 0.930 for urine creatinine at three different sites.
(DOCX)
S3 Fig. Flow chart of studies through the systematic literature review. Abbreviations: eGFR, estimated glomerular filtration rate; n, number.
(DOCX)
S4 Fig. Tornado diagram of one-way sensitivity analyses for the validation cohort. The ver- tical dashed line indicates the value in the base case analysis. Black bars represent the deviation resulting from the increase in corresponding input values. Gray bars represent the deviation resulting from the decrease in corresponding input values.
�Incidences of clinical outcomes were converted to annual probabilities in the Markov model.
��Hazard ratios for clinical outcomes among diabetic patients (micro- or overt albuminuria versus normo-albuminuria). The values were used to calculate incidences of clinical outcomes in diabetic patients with micro- or overt albuminuria.
Abbreviations: CVD, cardiovascular disease; ESRD, end-stage renal disease; HR, hazard ratio;
Q test, quantitative test; SemiQ test, semi-quantitative test.
(DOCX)
S1 File. PRISMA 2009 checklist.
(PDF)
S2 File. CHEERS checklist.
(PDF)
Acknowledgments
The biospecimens were provided by the Seoul National University Hospital Human Biobank, a member of the National Biobank of Korea, which is supported by the Ministry of Health and Welfare, Republic of Korea.
Author Contributions
Conceptualization: Hajeong Lee, Yon Su Kim, Dong Ki Kim.
Data curation: Myung-Hee Kim.
Investigation: Sang Hoon Song, Won Mok Lee, Hye Soon Kim, Kyubok Jin, Seungyeup Han.
Methodology: Yong Chul Kim.
Resources: Jung Pyo Lee, Chun Soo Lim.
Software: Seokwoo Park.
Supervision: Jung Pyo Lee, Kwon Wook Joo, Chun Soo Lim, Yon Su Kim, Dong Ki Kim.
Validation: Won Mok Lee, Hye Soon Kim.
Writing – original draft: Yaerim Kim.
Writing – review & editing: Seokwoo Park, Kyubok Jin, Seungyeup Han, Yong Chul Kim, Seung Seok Han, Hajeong Lee, Yon Su Kim, Dong Ki Kim.
References
1. Jin DC, Yun SR, Lee SW, Han SW, Kim W, Park J, et al. Current characteristics of dialysis therapy in Korea: 2016 registry data focusing on diabetic patients. Kidney Res Clin Pract. 2018; 37(1):20–9.
https://doi.org/10.23876/j.krcp.2018.37.1.20PMID:29629274
2. Haffner SM, Lehto S, Ronnemaa T, Pyorala K, Laakso M. Mortality from coronary heart disease in sub- jects with type 2 diabetes and in nondiabetic subjects with and without prior myocardial infarction. N Engl J Med. 1998; 339(4):229–34.https://doi.org/10.1056/NEJM199807233390404PMID:9673301 3. de Boer IH, Rue TC, Hall YN, Heagerty PJ, Weiss NS, Himmelfarb J. Temporal trends in the prevalence
of diabetic kidney disease in the United States. Jama. 2011; 305(24):2532–9.https://doi.org/10.1001/
jama.2011.861PMID:21693741
4. Brancati FL, Whelton PK, Randall BL, Neaton JD, Stamler J, Klag MJ. Risk of end-stage renal disease in diabetes mellitus: a prospective cohort study of men screened for MRFIT. Multiple Risk Factor Inter- vention Trial. Jama. 1997; 278(23):2069–74. PMID:9403420
5. Standards of medical care in diabetes—2013. Diabetes Care. 2013; 36 Suppl 1:S11–66.
6. Zaharie F. K/DOQI clinical practice guidelines for chronic kidney disease: evaluation, classification, and stratification. Am J Kidney Dis. 2002; 39(2 Suppl 1):S1–266.
7. Price CP. Point of care testing. Bmj. 2001; 322(7297):1285–8.https://doi.org/10.1136/bmj.322.7297.
1285PMID:11375233
8. Nichols JH, Christenson RH, Clarke W, Gronowski A, Hammett-Stabler CA, Jacobs E, et al. Executive summary. The National Academy of Clinical Biochemistry Laboratory Medicine Practice Guideline: evi- dence-based practice for point-of-care testing. Clin Chim Acta. 2007; 379(1–2):14–28; discussion 9–30.
https://doi.org/10.1016/j.cca.2006.12.025PMID:17270169
9. Gialamas A, St John A, Laurence CO, Bubner TK. Point-of-care testing for patients with diabetes, hyperlipidaemia or coagulation disorders in the general practice setting: a systematic review. Fam Pract. 2010; 27(1):17–24.https://doi.org/10.1093/fampra/cmp084PMID:19969524
10. Laurence CO, Moss JR, Briggs NE, Beilby JJ. The cost-effectiveness of point of care testing in a gen- eral practice setting: results from a randomised controlled trial. BMC Health Serv Res. 2010; 10:165.
https://doi.org/10.1186/1472-6963-10-165PMID:20546629
11. 2. Classification and Diagnosis of Diabetes: Standards of Medical Care in Diabetes-2019. Diabetes Care. 2019; 42(Suppl 1):S13–s28.https://doi.org/10.2337/dc19-S002PMID:30559228
12. Tholen DW, Kallner A, Kennedy JW, Krouwer JS, Meier K. Evaluation of precision performance of quan- titative measurement methods; approved guideline—second edition. Evaluation. 2004; 24(25).
13. Yokoyama H, Araki S, Haneda M, Matsushima M, Kawai K, Hirao K, et al. Chronic kidney disease cate- gories and renal-cardiovascular outcomes in type 2 diabetes without prevalent cardiovascular disease:
a prospective cohort study (JDDM25). Diabetologia. 2012; 55(7):1911–8.https://doi.org/10.1007/
s00125-012-2536-yPMID:22476921
14. Ninomiya T, Perkovic V, de Galan BE, Zoungas S, Pillai A, Jardine M, et al. Albuminuria and kidney function independently predict cardiovascular and renal outcomes in diabetes. J Am Soc Nephrol.
2009; 20(8):1813–21.https://doi.org/10.1681/ASN.2008121270PMID:19443635
15. Lee T, Biddle AK, Lionaki S, Derebail VK, Barbour SJ, Tannous S, et al. Personalized prophylactic anticoagulation decision analysis in patients with membranous nephropathy. Kidney Int. 2014; 85 (6):1412–20.https://doi.org/10.1038/ki.2013.476PMID:24336031
16. Lee J, Lee JS, Park SH, Shin SA, Kim K. Cohort Profile: The National Health Insurance Service- National Sample Cohort (NHIS-NSC), South Korea. Int J Epidemiol. 2017; 46(2):e15.https://doi.org/10.
1093/ije/dyv319PMID:26822938
17. Olson M, Bailey MJ. Positive time preference. Journal of Political Economy. 1981; 89(1):1–25.
18. Ahn JH, Kim YH, Shin SJ, JY P. Cost of Medical Decision Making—Asian Joint Research on Effective- ness. National Evidence-based Healthcare Collaborating Agency; 2012.
19. Kwon S, Lee T-j, Kim C-y. Republic of Korea health system review. Asia Pac. Observatory Public Health Syst. Policies. 2015; 5(4).
20. Cheol Seong S, Kim YY, Khang YH, Heon Park J, Kang HJ, Lee H, et al. Data Resource Profile: The National Health Information Database of the National Health Insurance Service in South Korea. Int J Epidemiol. 2017; 46(3):799–800.https://doi.org/10.1093/ije/dyw253PMID:27794523
21. Organization WH. Global report on diabetes: World Health Organization; 2016.https://doi.org/10.2337/
db15-0956
22. (NCD-RisC) NRFC. Worldwide trends in diabetes since 1980: a pooled analysis of 751 population- based studies with 4.4 million participants. Lancet. 2016; 387(10027):1513–30.https://doi.org/10.1016/
S0140-6736(16)00618-8PMID:27061677
23. Le Floch JP, Marre M, Rodier M, Passa P. Interest of Clinitek Microalbumin in screening for microalbu- minuria: results of a multicentre study in 302 diabetic patients. Diabetes Metab. 2001; 27(1):36–9.
PMID:11240444
24. Croal BL, Mutch WJ, Clark BM, Dickie A, Church J, Noble D, et al. The clinical application of a urine albumin:creatinine ratio point-of-care device. Clin Chim Acta. 2001; 307(1–2):15–21.https://doi.org/10.
1016/s0009-8981(01)00450-8PMID:11369331
25. Meinhardt U, Ammann RA, Fluck C, Diem P, Mullis PE. Microalbuminuria in diabetes mellitus: efficacy of a new screening method in comparison with timed overnight urine collection. J Diabetes Complica- tions. 2003; 17(5):254–7.https://doi.org/10.1016/s1056-8727(02)00180-0PMID:12954153 26. Graziani MS, Gambaro G, Mantovani L, Sorio A, Yabarek T, Abaterusso C, et al. Diagnostic accuracy
of a reagent strip for assessing urinary albumin excretion in the general population. Nephrol Dial Trans- plant. 2009; 24(5):1490–4.https://doi.org/10.1093/ndt/gfn639PMID:19037085
27. McTaggart MP, Price CP, Pinnock RG, Stevens PE, Newall RG, Lamb EJ. The diagnostic accuracy of a urine albumin-creatinine ratio point-of-care test for detection of albuminuria in primary care. Am J Kid- ney Dis. 2012; 60(5):787–94.https://doi.org/10.1053/j.ajkd.2012.05.009PMID:22721931
28. Gerstein HC, Mann JF, Yi Q, Zinman B, Dinneen SF, Hoogwerf B, et al. Albuminuria and risk of cardio- vascular events, death, and heart failure in diabetic and nondiabetic individuals. Jama. 2001; 286 (4):421–6.https://doi.org/10.1001/jama.286.4.421PMID:11466120
29. Valmadrid CT, Klein R, Moss SE, Klein BE. The risk of cardiovascular disease mortality associated with microalbuminuria and gross proteinuria in persons with older-onset diabetes mellitus. Arch Intern Med.
2000; 160(8):1093–100.https://doi.org/10.1001/archinte.160.8.1093PMID:10789601
30. O’Hare AM, Hailpern SM, Pavkov ME, Rios-Burrows N, Gupta I, Maynard C, et al. Prognostic implica- tions of the urinary albumin to creatinine ratio in veterans of different ages with diabetes. Arch Intern Med. 2010; 170(11):930–6.https://doi.org/10.1001/archinternmed.2010.129PMID:20548004 31. Yuyun MF, Khaw KT, Luben R, Welch A, Bingham S, Day NE, et al. Microalbuminuria independently
predicts all-cause and cardiovascular mortality in a British population: The European Prospective Inves- tigation into Cancer in Norfolk (EPIC-Norfolk) population study. Int J Epidemiol. 2004; 33(1):189–98.
https://doi.org/10.1093/ije/dyh008PMID:15075168
32. Klausen K, Borch-Johnsen K, Feldt-Rasmussen B, Jensen G, Clausen P, Scharling H, et al. Very low levels of microalbuminuria are associated with increased risk of coronary heart disease and death inde- pendently of renal function, hypertension, and diabetes. Circulation. 2004; 110(1):32–5.https://doi.org/
10.1161/01.CIR.0000133312.96477.48PMID:15210602
33. Berhane AM, Weil EJ, Knowler WC, Nelson RG, Hanson RL. Albuminuria and estimated glomerular fil- tration rate as predictors of diabetic end-stage renal disease and death. Clin J Am Soc Nephrol. 2011; 6 (10):2444–51.https://doi.org/10.2215/CJN.00580111PMID:21852671
34. Ritte R, Luke J, Nelson C, Brown A, O’Dea K, Jenkins A, et al. Clinical outcomes associated with albu- minuria in central Australia: a cohort study. BMC Nephrol. 2016; 17(1):113.https://doi.org/10.1186/
s12882-016-0328-1PMID:27495237
35. Tong PC, Kong AP, So WY, Yang X, Ng MC, Ho CS, et al. Interactive effect of retinopathy and macroal- buminuria on all-cause mortality, cardiovascular and renal end points in Chinese patients with Type 2 diabetes mellitus. Diabet Med. 2007; 24(7):741–6.https://doi.org/10.1111/j.1464-5491.2007.02145.x PMID:17403120
36. Targher G, Zoppini G, Chonchol M, Negri C, Stoico V, Perrone F, et al. Glomerular filtration rate, albu- minuria and risk of cardiovascular and all-cause mortality in type 2 diabetic individuals. Nutr Metab Car- diovasc Dis. 2011; 21(4):294–301.https://doi.org/10.1016/j.numecd.2009.10.002PMID:20096544 37. Konta T, Kudo K, Sato H, Ichikawa K, Ikeda A, Suzuki K, et al. Albuminuria is an independent predictor
of all-cause and cardiovascular mortality in the Japanese population: the Takahata study. Clin Exp Nephrol. 2013; 17(6):805–10.https://doi.org/10.1007/s10157-013-0770-3PMID:23345069
38. Svensson MK, Cederholm J, Eliasson B, Zethelius B, Gudbjornsdottir S. Albuminuria and renal function as predictors of cardiovascular events and mortality in a general population of patients with type 2 dia- betes: a nationwide observational study from the Swedish National Diabetes Register. Diab Vasc Dis Res. 2013; 10(6):520–9.https://doi.org/10.1177/1479164113500798PMID:24002670
39. Hsieh YT, Kuo JF, Su SL, Chen JF, Chen HC, Hsieh MC. Subnormal Estimated Glomerular Filtration Rate Strongly Predict Incident Cardiovascular Events in Type 2 Diabetic Chinese Population With Nor- moalbuminuria. Medicine (Baltimore). 2016; 95(2):e2200.
40. Wada T, Haneda M, Furuichi K, Babazono T, Yokoyama H, Iseki K, et al. Clinical impact of albuminuria and glomerular filtration rate on renal and cardiovascular events, and all-cause mortality in Japanese patients with type 2 diabetes. Clin Exp Nephrol. 2014; 18(4):613–20.https://doi.org/10.1007/s10157- 013-0879-4PMID:24132561
41. So WY, Kong AP, Ma RC, Ozaki R, Szeto CC, Chan NN, et al. Glomerular filtration rate, cardiorenal end points, and all-cause mortality in type 2 diabetic patients. Diabetes Care. 2006; 29(9):2046–52.
https://doi.org/10.2337/dc06-0248PMID:16936151
42. Adler AI, Stevens RJ, Manley SE, Bilous RW, Cull CA, Holman RR. Development and progression of nephropathy in type 2 diabetes: the United Kingdom Prospective Diabetes Study (UKPDS 64). Kidney Int. 2003; 63(1):225–32.https://doi.org/10.1046/j.1523-1755.2003.00712.xPMID:12472787 43. Ward A, Alvarez P, Vo L, Martin S. Direct medical costs of complications of diabetes in the United
States: estimates for event-year and annual state costs (USD 2012). J Med Econ. 2014; 17(3):176–83.
https://doi.org/10.3111/13696998.2014.882843PMID:24410011
44. Vupputuri S, Kimes TM, Calloway MO, Christian JB, Bruhn D, Martin AA, et al. The economic burden of progressive chronic kidney disease among patients with type 2 diabetes. J Diabetes Complications.
2014; 28(1):10–6.https://doi.org/10.1016/j.jdiacomp.2013.09.014PMID:24211091
45. Honeycutt AA, Segel JE, Zhuo X, Hoerger TJ, Imai K, Williams D. Medical costs of CKD in the Medicare population. J Am Soc Nephrol. 2013; 24(9):1478–83.https://doi.org/10.1681/ASN.2012040392PMID:
23907508