INTRODUCTION
The high temperature in the summer poses extensive challenges to the poultry industry, for instance, less feed intake and subsequent lower weight gain incorporated mortality which plays an adverse effect on total poultry production (Teeter and Belay, 1996). High environment temperature (>
26℃) induces the loss of ions from plasma with sweat and urine that reduce the level of plasma K
+and Na
+which resulted lower dietary electrolyte balance (DEB) in broilers (Borges et al., 2004). The DEB value is determined by the ratios of Na
+, Cl
—and K
+levels in the plasma that
responsible in regulating the acid-base balance and pH, which are the factors help to maintain optimum enzymatic efficiency in broilers (Hooge, 2003). Moreover, DEB has a crucial role in broiler growth performance including proper bone development and litter quality (Borges et al., 2004).
It has been known that, addition of cation like Na
+and K
+along with Cl
—could be used to enhance the growth per- formance of broilers (Mushtaq et al., 2005). Dietary sodium chloride (NaCl) is an inexpensive ion source that can be used to enhance the DEB in broilers (Murakami et al., 2001).
Sodium is also responsible for amino acids and sugar absorption in the small intestine (Leeson and Summers,
Determination of the Effect of Feeding Different Sodium Chloride Regimes on Growth Performance, Viscera Organ Weights and Meat Quality Parameters of
Broilers from Hatch to 35 Days of Age
Geerththana Vinothsankar
1*, Shemil Priyan Macelline
1,2*, Samiru Sudharaka Wickramasuriya
1,2, Shan Randima Nawarathna
1,2, Li Ang
3, Himali Tharangani
4, Dinesh Darshaka Jayasena
5†and Jung Min Heo
6†1
Student, Department of Animal Science, Uva Wellassa University, Badulla 90000, Sri Lanka
2
Student, Department of Animal Science and Biotechnology, Chungnam National University, Daejeon 34134, Republic of Korea
3
Quality Assuarance Manager, New Hope Lanka Ltd, No. 255A, Kurunduwatte Road, Ekala, Ja-ela 11350, Sri Lanka
4
Lecturer, Department of Animal Science, Uva Wellassa University, Badulla 90000, Sri Lanka
5
Professor, Department of Animal Science, Uva Wellassa University, Badulla 90000, Sri Lanka
6
Associate Professor, Department of Animal Science and Biotechnology, Chungnam National University, Daejeon 34134, Republic of Korea
ABSTRACT This study intended to investigate the growth performance and meat quality traits in broilers fed different regimens of NaCl over a period of 35 days. Seven hundred and fifty 1-day-old chicks (Cobb 500) were randomly assigned to five NaCl feeding regimens to obtain three replicates for each regimen. Broilers in CON group were provided with concentrations of 0.35% NaCl for the duration of the experimental period. The other groups were provided with two concentrations of NaCl (0.45% and 0.55%) under two durations, namely: 1) 1∼28 d: 0.45% or 0.55% NaCl for 28 days then CON; and 2) 1∼35 d: 0.45% or 0.55% NaCl for 35 days. Broilers fed 0.55% NaCl for 1∼35 d showed improved (P<0.05) growth performance compared with broilers fed the CON regimen. Moreover, higher water holding capacity of breast meat was shown by the broilers fed 0.55% NaCl for 1∼28 d when compared with that in broilers fed the CON diet (P<0.05).
Broilers fed 0.45% NaCl showed an increase (P<0.05) in the lightness of the meat over CON diet and the 0.55% NaCl diet.
In addition, broilers offered CON had the highest redness value and highest crude ash content in the breast meat (P<0.05).
Feeding 0.45% NaCl for 1 ∼35 d and 0.55% NaCl for 1∼28 d resulted in a higher (P<0.05) protein content in breast meat.
In conclusion, broilers fed diets with 0.55% NaCl for 1∼35 d showed improved growth performance as well as water holding capacity and protein content of the breast meat.
(Key words: broilers, growth performance, protein, sodium chloride, water holding capacity)
*
These authors have contributed equally to this work.
†
To whom correspondence should be addressed : [email protected] and [email protected]
2001). Importantly, Cl
—level in the diets should be maintain because, excess level of Cl
—can be a reason for the leg and articulation outbreaks in broilers (Murakami et al., 2001). It has been stated that increasing Na
+levels from 0.10% to 0.46% in the diet, improved the growth performance of broilers in the pre-starter phase (Maiorka et al., 2004).
Interestingly, incorporating NaCl as the primary source of Na
+to the diets has ability to improve the growth perfor- mance of broilers compared to the use of sodium bicarbonate (Murakami et al., 2000). However, previous studies empha- sised that maintaining proper DEB value (200∼300 meq/kg) also important to obtain optimum performance from broilers fed elevated levels of NaCl (Murakami et al., 2000).
Additionally, it is important to consider that broilers were more sensitive to the levels of electrolytes at early stages than latter stages which allow to reduce the Na
+and Cl
—incor- poration into broiler diets (Mushtaq et al., 2013). Therefore, it is unnecessary to supply higher level of NaCl into diets at later stage of broilers.
Results of the previous studies revealed that supplemen- tation of elevated levels of dietary NaCl under preferable DEB value to broilers have been inconsistent. Further, fewer studies investigated the effect of NaCl on meat quality and carcass parameters of broilers. Therefore, this study was designed to test the hypothesis of broilers fed elevated level of NaCl improved growth performance in hot and humid (32℃
and 90% respectively) environmental condition while main- taining the carcass and meat quality parameters for 35 d.
MATERIAL AND METHODS
1. Experiment Design and Management
A total of 750 one-day-old Cobb 500 male broiler chicks were randomly distributed into one of five feeding regimens to give three replicates per each (50 birds/replicate). Broilers were allotted into the CON group provided 0.35% level of NaCl for 35 d. Broilers in other four groups provided two elevated levels of NaCl (0.45% and 0.55%) under two feeding regimens consisted of broilers were in other four groups provided two levels of NaCl (0.45% and 0.55%) under two durations which is known as 1) 1∼28 d: feeding
0.45% and 0.55% level of NaCl for 28 d then provide CON diet for 28 d to 35 d, 2) 1 ∼35d: feeding 0.45% and 0.55%
level of NaCl for 35d.
All the management practices were followed the Cobb broiler management guide (2012). Birds were in the deep litter cages under normal environment conditions. The average temperature and humidity were recorded as 32℃ and 90%, respectively during the experimental period. Broilers were permitted to ad-libitum access to experimental diets and water.
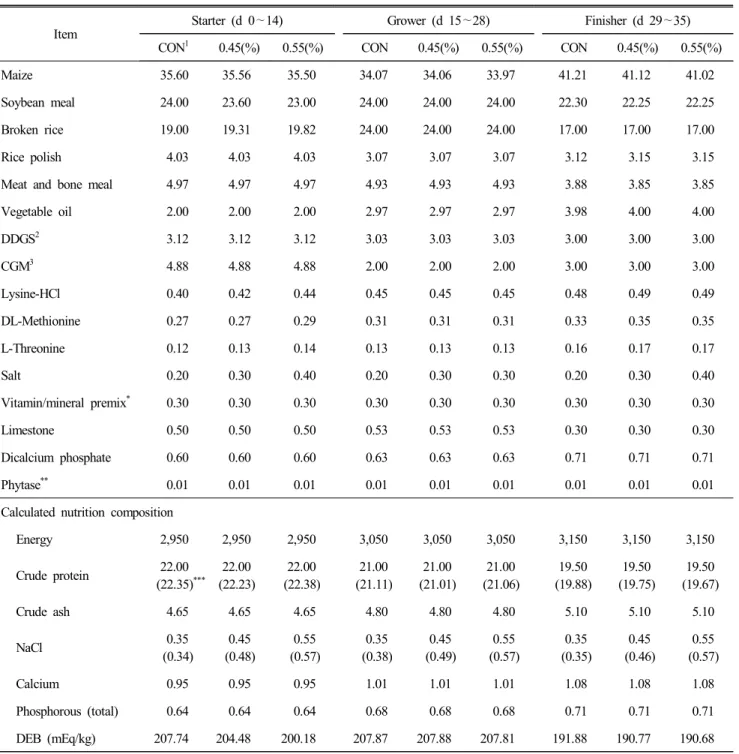
2. Experimental Diets
Experimental diets were formulated to fulfil or exceed the Cobb 500 broiler nutrition requirement (Cobb500-vantresss, 2012). Maize-broken rice and soybean meal were used to produce basal diets. All the diets were free from added antibiotics and any other antimicrobial growth promoters.
Feeding program was divided into three phases as following starter (day 1∼14), grower (day 15∼28) and finisher (day 29
∼35) during the experimental period (Table 1). Starter and grower diets were produced as crumble form whereas finisher feed was made in pellet form. Sodium chloride was added into the experimental diets in expenses of maize and soybean meal via dietary salt.
3. Measurements
Initial body weights of the broiler chicks were measured and recorded on a pen basis on arrival. Thereafter, final body weights (pen basis) were measured to determine the average daily weight gain of broilers on day 35. Feed intake was measured based on the feed disappearance rate in each cage and calculated the daily average feed intake for the experi- mental period. Finely, the mortality corrected feed conversion ratio was measured per each cage.
At the end of the experiment, two birds near to the median
weight from each cage were selected (n=6) and euthanized by
cervical dislocation. Abdominal incisions were made to
remove the internal organs such as the liver, gizzard, small
intestine, and heart. Thereafter, absolute weights of the
abovementioned organs were taken after removing fat and
other adherent materials then recorded as relative weights to
the body weights.
Table 1. Composition (% as-fed basis) of the basal diet (CON)
Item
Starter (d 0 ∼14) Grower (d 15 ∼28) Finisher (d 29 ∼35)
CON
10.45(%) 0.55(%) CON 0.45(%) 0.55(%) CON 0.45(%) 0.55(%)
Maize 35.60 35.56 35.50 34.07 34.06 33.97 41.21 41.12 41.02
Soybean meal 24.00 23.60 23.00 24.00 24.00 24.00 22.30 22.25 22.25
Broken rice 19.00 19.31 19.82 24.00 24.00 24.00 17.00 17.00 17.00
Rice polish 4.03 4.03 4.03 3.07 3.07 3.07 3.12 3.15 3.15
Meat and bone meal 4.97 4.97 4.97 4.93 4.93 4.93 3.88 3.85 3.85
Vegetable oil 2.00 2.00 2.00 2.97 2.97 2.97 3.98 4.00 4.00
DDGS
23.12 3.12 3.12 3.03 3.03 3.03 3.00 3.00 3.00
CGM
34.88 4.88 4.88 2.00 2.00 2.00 3.00 3.00 3.00
Lysine-HCl 0.40 0.42 0.44 0.45 0.45 0.45 0.48 0.49 0.49
DL-Methionine 0.27 0.27 0.29 0.31 0.31 0.31 0.33 0.35 0.35
L-Threonine 0.12 0.13 0.14 0.13 0.13 0.13 0.16 0.17 0.17
Salt 0.20 0.30 0.40 0.20 0.30 0.30 0.20 0.30 0.40
Vitamin/mineral premix
*0.30 0.30 0.30 0.30 0.30 0.30 0.30 0.30 0.30
Limestone 0.50 0.50 0.50 0.53 0.53 0.53 0.30 0.30 0.30
Dicalcium phosphate 0.60 0.60 0.60 0.63 0.63 0.63 0.71 0.71 0.71
Phytase
**0.01 0.01 0.01 0.01 0.01 0.01 0.01 0.01 0.01
Calculated nutrition composition
Energy 2,950 2,950 2,950 3,050 3,050 3,050 3,150 3,150 3,150
Crude protein 22.00
(22.35)
***22.00 (22.23)
22.00 (22.38)
21.00 (21.11)
21.00 (21.01)
21.00 (21.06)
19.50 (19.88)
19.50 (19.75)
19.50 (19.67)
Crude ash 4.65 4.65 4.65 4.80 4.80 4.80 5.10 5.10 5.10
NaCl 0.35
(0.34)
0.45 (0.48)
0.55 (0.57)
0.35 (0.38)
0.45 (0.49)
0.55 (0.57)
0.35 (0.35)
0.45 (0.46)
0.55 (0.57)
Calcium 0.95 0.95 0.95 1.01 1.01 1.01 1.08 1.08 1.08
Phosphorous (total) 0.64 0.64 0.64 0.68 0.68 0.68 0.71 0.71 0.71
DEB (mEq/kg) 207.74 204.48 200.18 207.87 207.88 207.81 191.88 190.77 190.68
1
Control diet.
2
Distilers dried grains solute.
3
Corn gluten meal.
*
Supplied per kilogram of total diets: Fe (FeSO
4․H
2O), 80 mg; Zn (ZnSO
4․H
2O), 80 mg; Mn (MnSO
4․H
2O), 80 mg; Co (CoSO
4․H
2O), 0.5 mg; Cu (CuSO
4․H
2O), 10 mg; Se (Na
2SeO
3), 0.2 mg; I, (Ca(IO
3) ․2H
2O) 0.9 mg; vitamin A, 24,000 IU; vitamin D
3, 6,000 IU;
vitamin E, 30 IU; vitamin K, 4 mg; thiamin, 4 mg; riboflavin, 12 mg; pyridoxine, 4 mg; folacine, 2 mg; biotin, 0.03 mg; vitamin B
8, 0.06 mg; niacin, 90 mg; pantothenic acid, 30 mg.
**
Natuphos
®E, BSAF, Germany.
***
Calculated values.
4. Sample Collection and Laboratory Analyses Breast meat was separated from the carcass and samples were packed in the vacuumed sample bags and stored in the iceboxes until transport to the laboratory. Hereafter, labo- ratory analyses for the meat quality parameters and proxi- mate composition were performed within one-week post- mortem.
5. Meat Quality Analysis
Water holding capacity, pH value, cooking loss and meat colour of the broiler breast meat were measured using the methods described by the Jayasena et al. (2013) and Nuwan et al. (2016). Proximate compositions (crude protein, crude fat, NaCl, crude ash, Ca and P) were measured in the breast meat samples as the methods described in AOAC (1995) and Lakshani et al. (2016).
6. Statistical Analysis
Data were analysed by the General Linear Model (GLM) procedure of one-way ANOVA of SPSS software (version
24, Armonk, NY: IBM Corp.). Each replicate of the treat- ments was considered as the experimental unit for the growth performance whereas the birds which selected to near to the medium body weight of each replicate were considered as experimental units for the meat quality parameters. Tukey’s multiple range test was performed when the significance was found at P<0.05.
RESULTS
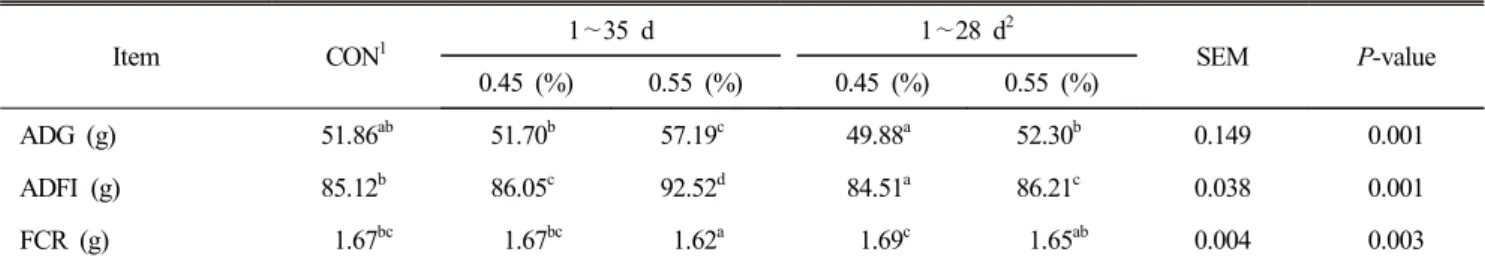
The results of broilers fed different NaCl regimens on growth performance of broilers presented in Table 2. Broilers fed diet with 0.55% level of NaCl for 1 ∼35d improved (P<0.01) ADG, ADFI and FCR compared broilers fed CON diet on day 35. Broilers fed a diet with 0.45% level of NaCl for 1∼28 d reduced (P<0.01) the feed intake compared to broilers fed CON diet on day 35.
The effect of broilers fed different NaCl regimens on viscera organ weights presented in Table 3. Broilers fed elevated levels of NaCl did not alter (P<0.05) the relative
Table 2. Growth performance of broilers fed diet with different NaCl regimens for 35 days
Item CON
11 ∼35 d 1 ∼28 d
2SEM P-value
0.45 (%) 0.55 (%) 0.45 (%) 0.55 (%)
ADG (g) 51.86
ab51.70
b57.19
c49.88
a52.30
b0.149 0.001
ADFI (g) 85.12
b86.05
c92.52
d84.51
a86.21
c0.038 0.001
FCR (g) 1.67
bc1.67
bc1.62
a1.69
c1.65
ab0.004 0.003
1
Control diet with 0.35% level of NaCl.
2
Feeding a specific diet for 28 days and then feeding a CON diet from day 29 to day 35.
SEM, standard error of mean; ADG, average daily gain; ADFI, average daily feed intake; FCR, feed conversion ratio.
Table 3. Viscera organ weights of broilers fed diet with different NaCl regimens for 35 days
Item CON
11 ∼35 d 1 ∼28 d
2SEM P-value
0.45 (%) 0.55 (%) 0.45 (%) 0.55 (%)
Gizzard (%) 1.38 1.27 1.24 1.28 1.26 1.210 0.803
Heart (%) 0.46 0.42 0.46 0.40 0.41 0.014 0.467
Small intestine (%) 5.53
b5.50
b3.92
a5.43
b4.62
ab0.186 0.040
1
Control diet with 0.35% level of NaCl.
2
Feeding a specific diet for 28 days and then feeding a CON diet from day 29 to day 35.
SEM, standard error of mean.
weights of gizzard and heart compared to broilers fed CON.
Interestingly, broilers supplemented 0.55% level of NaCl for 1∼35 d has reduced (P<0.05) the relative weight of small intestine compared to broilers fed CON on day 35.
Meat quality parameters of broiler breast meat from the broilers fed different NaCl regimens presented in Table 4.
Broilers fed a diet with 0.55% NaCl for 1 ∼28 d showed higher (P<0.01) WHC compared to those fed CON on day 35. The lightness of the surface of breast meat has been increased (P<0.01) by the 0.45% NaCl supplementation to the broilers regardless of the feeding duration that compared to broilers fed CON diet on day 35. In the aspect of breast meat redness, broilers fed a diet with 0.45% and 0.55% NaCl
level for 1 ∼28 d obtain lower value (P<0.05) compared to broilers fed CON diet on day 35.
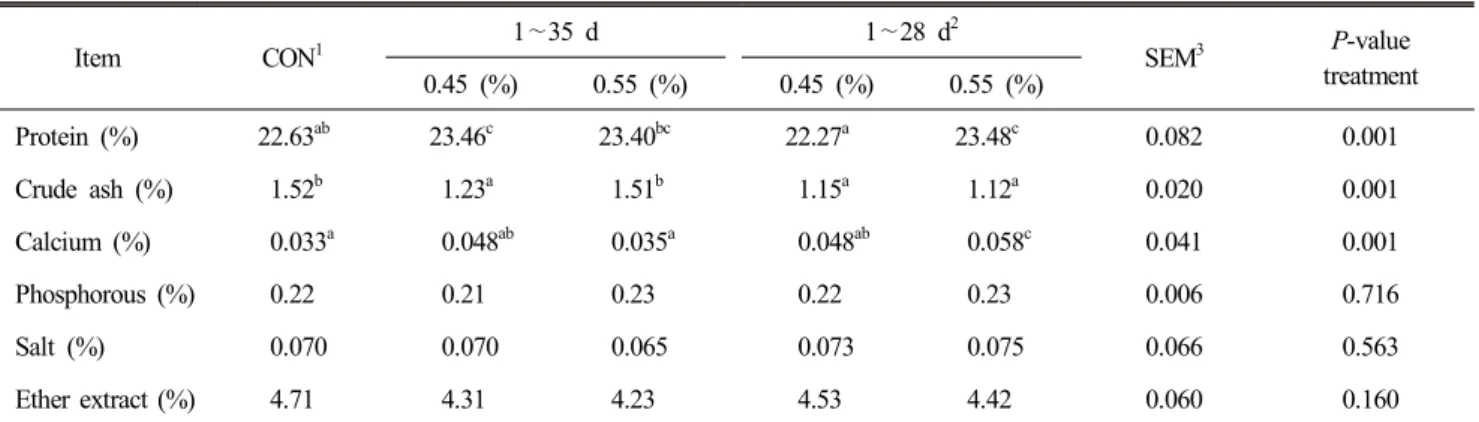
The effect of different regimens of NaCl supplementation on the proximate nutrition composition of broiler breast meat is presented in Table 5. Broilers fed a diet with 0.45% for the 1 ∼35 d had amplified (P<0.01) the breast meat protein content by 4% compared to broilers fed CON on day 35.
Interestingly, broilers fed CON and 0.55% level of NaCl for 1∼35 d increased (P<0.01) the crude ash of the broiler breast meat compared to broilers fed other diets. Moreover, broilers fed 0.55% level of NaCl increased (P<0.05) the Ca amount in the breast meat by 75% compared to those fed CON diet.
Table 4. Meat quality parameters of broilers fed diet with different NaCl regimens for 35 days
Item CON
11 ∼35 d 1 ∼28 d
2SEM P-value
0.45 (%) 0.55 (%) 0.45 (%) 0.55 (%)
WHC (%) 78.83
ab81.22
bc78.22
a78.49
a82.21
C0.257 0.002
CL (%) 27.08 27.55 26.82 27.12 30.48 0.459 0.145
pH 5.86 5.84 5.89 5.92 6.04 0.039 0.537
L* 62.57
a67.74
b62.51
a66.49
b66.93
B0.305 0.001
a* 15.00
b12.03
ab12.22
ab11.26
a11.83
A0.658 0.019
b* 14.02 15.09 16.80 15.10 15.93 0.520 0.581
1
Control diet with 0.35% level of NaCl.
2
Feeding a specific diet for 28 days and then feeding a CON diet from day 29 to day 35.
SEM, standard error of mean; WHC, water holding capacity; CL, cooking loss; L*, lightness of the meat; a*, redness; b*, yellowness.
Table 5. Proximate chemical composition in breast meat of broilers treated different NaCl regimens for 35 days
Item CON
11 ∼35 d 1 ∼28 d
2SEM
3P-value
treatment 0.45 (%) 0.55 (%) 0.45 (%) 0.55 (%)
Protein (%) 22.63
ab23.46
c23.40
bc22.27
a23.48
c0.082 0.001
Crude ash (%) 1.52
b1.23
a1.51
b1.15
a1.12
a0.020 0.001
Calcium (%) 0.033
a0.048
ab0.035
a0.048
ab0.058
c0.041 0.001
Phosphorous (%) 0.22 0.21 0.23 0.22 0.23 0.006 0.716
Salt (%) 0.070 0.070 0.065 0.073 0.075 0.066 0.563
Ether extract (%) 4.71 4.31 4.23 4.53 4.42 0.060 0.160
1
Control diet with 0.35% level of NaCl.
2